MEMBERS ONLY
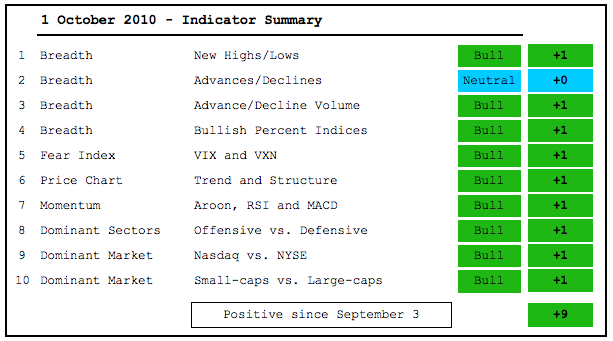
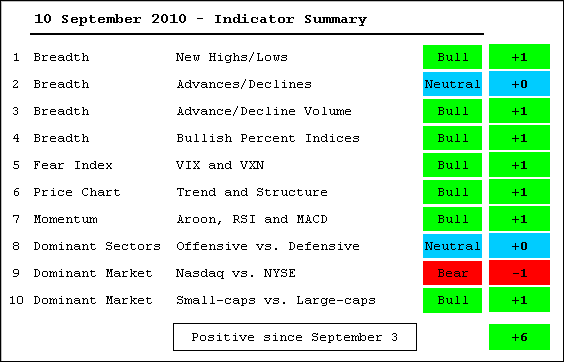
Indicator Summary remains positive
by Arthur Hill,
Chief Technical Strategist, TrendInvestorPro.com
The indicator summary has been positive for almost a full month. While there are no signs of medium-term weakness, there are some signs of short-term fatigue setting into the market. First, the Russell 2000 ETF is still battling resistance from its summer highs. Second, the Finance SPDR failed at resistance...
READ MORE
MEMBERS ONLY
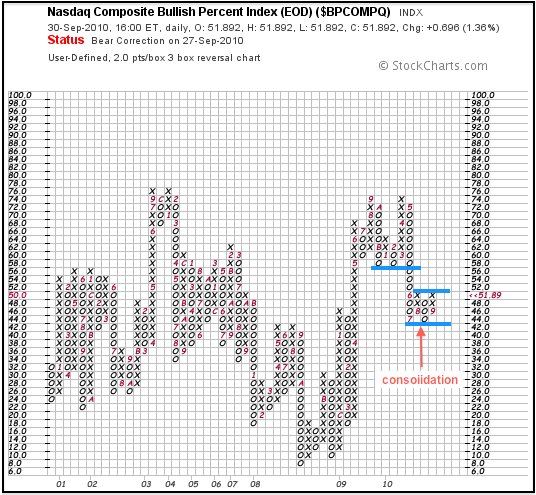
Nasdaq Bullish% Index remains stuck
by Arthur Hill,
Chief Technical Strategist, TrendInvestorPro.com
Despite the sharp September rally, the Nasdaq Bullish% Index ($BPCOMPQ) remains stuck in a consolidation and has yet to break its summer highs. The Bullish Percent Index broke support with the May decline and needs to break above current resistance to negate the current P&F sell signal. Click...
READ MORE
MEMBERS ONLY
Doji signals indecision for DIA
by Arthur Hill,
Chief Technical Strategist, TrendInvestorPro.com
The Dow Industrials SPDR(DIA) signaled indecision on Wednesday with a small doji. Wednesday marks the fourth straight close in the 108-109 area. Doji can sometimes foreshadow a reversal, such as in early August. Alternatively, doji can simply mark a rest in the uptrend, such as mid September.
Click this...
READ MORE
MEMBERS ONLY
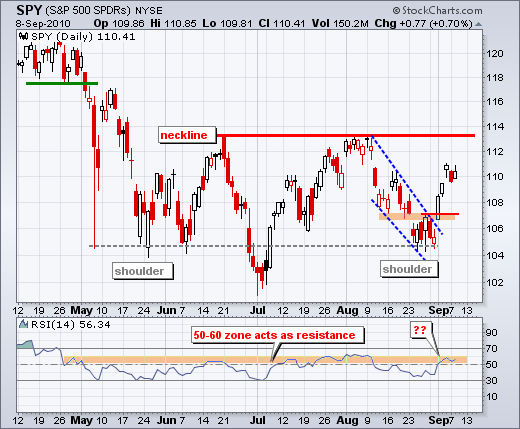
SPY forms small inverse HS pattern
by Arthur Hill,
Chief Technical Strategist, TrendInvestorPro.com
There is no change on the daily chart. SPY continues to stall around 114 and has yet to break support. Even though the trend is clearly up here, I am leaving the ABC correction possibility on the chart. SPY is also near channel resistance and overbought. The upper trendline of...
READ MORE
MEMBERS ONLY
Charts of Interest: ADM, AN, ASEI, CME, FITB, HCBK, HSY, LSI, PLCM
by Arthur Hill,
Chief Technical Strategist, TrendInvestorPro.com
Charts of Interest: ADM, AN, ASEI, CME, FITB, HCBK, HSY, LSI, PLCM
---------------------------------------------------------------------------------------------------------------------
This commentary and charts-of-interest are designed to stimulate thinking. This analysis is not a recommendation to buy, sell, hold or sell short any security (stock ETF or otherwise). We all need to think for ourselves when it...
READ MORE
MEMBERS ONLY
Energy edges towards resistance $XLE
by Arthur Hill,
Chief Technical Strategist, TrendInvestorPro.com
The Finance SPDR (XLF) and the Energy SPDR (XLE) are the only two sectors that have yet to break their summer highs. XLE is close as it works its way higher after a pennant breakout seven days ago. With this advance, the ETF is now trading at the upper trendline...
READ MORE
MEMBERS ONLY
Charts of Interest: AN, CLF, FDX, NAT, RTN, SHAW, THC
by Arthur Hill,
Chief Technical Strategist, TrendInvestorPro.com
Charts of Interest: AN, CLF, FDX, NAT, RTN, SHAW, THC
This commentary and charts-of-interest are designed to stimulate thinking. This analysis is not a recommendation to buy, sell, hold or sell short any security (stock ETF or otherwise). We all need to think for ourselves when it comes to trading...
READ MORE
MEMBERS ONLY
Stocks stall as risk-on trade turns mixed
by Arthur Hill,
Chief Technical Strategist, TrendInvestorPro.com
The risk-on trade remains in force, but the bullish case has been weakening since last week. Even though the Euro remains in clear uptrend, supporting the risk-on trade, the 10-year Treasury Yield ($TNX) remains in a downtrend and fell further on Monday. In addition, the Finance SPDR (XLF) was hit...
READ MORE
MEMBERS ONLY
Dips continue to entire stock buying
by Arthur Hill,
Chief Technical Strategist, TrendInvestorPro.com
Once again, stocks dipped on Monday and early Tuesday, but quickly recovered with a sharp rally that held up into the close. The medium-term and short-term trends are clearly up, but the intermarket picture remains mixed. Strength in the Euro is positive for stocks, but strength in bonds and weakness...
READ MORE
MEMBERS ONLY
Techs and healthcare lead the September surge $XLK $XLV
by Arthur Hill,
Chief Technical Strategist, TrendInvestorPro.com
The S&P Sector PerfChart shows the percentage change for the nine sectors and the S&P 500. Those up more than the S&P 500 are leading. Those up less are lagging. In a surprising twist, both the technology and healthcare sectors are leading the S&...
READ MORE
MEMBERS ONLY
Small dip entices the bulls
by Arthur Hill,
Chief Technical Strategist, TrendInvestorPro.com
After a relatively short pullback the prior three days, stocks rebounded with a strong move on Friday. The major indices were all up 2% or more with the Russell 2000 leading the charge (+3.42%). Relative strength in small-caps is a big positive for the market. We are also seeing...
READ MORE
MEMBERS ONLY
Point & Figure breakout for QQQQ
by Arthur Hill,
Chief Technical Strategist, TrendInvestorPro.com
After consolidating for a few days, the Nasdaq 100 ETF (QQQQ) broke resistance with a surge on Friday. In fact, the 30-minute PnF chart shows an ascending triangle taking shape this week. These are bullish continuation patterns.
Click this image for a live chart...
READ MORE
MEMBERS ONLY
Finance sector drags SPY down
by Arthur Hill,
Chief Technical Strategist, TrendInvestorPro.com
Thursday's action was not encouraging. Stocks started weak as the major index ETFs gapped down on the open. However, the bulls came in almost immediately and pushed stocks into positive territory just after 11AM. Techs led the rebound. This looked encouraging, but selling pressure took hold in the...
READ MORE
MEMBERS ONLY
Indicator Summary remains firmly positive
by Arthur Hill,
Chief Technical Strategist, TrendInvestorPro.com
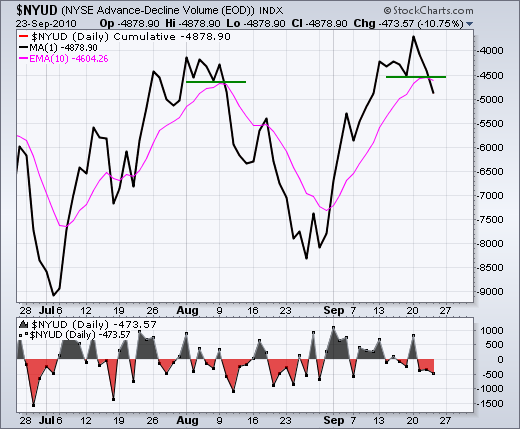
Despite a few discrepancies, the indicator summary remains in the bullish camp. The Russell 2000 ETF (IWM) has yet to break its summer highs, but QQQQ, SPY and DIA have broken through. The NYSE AD Line hit another new high, but the Nasdaq AD Line has yet to take out...
READ MORE
MEMBERS ONLY
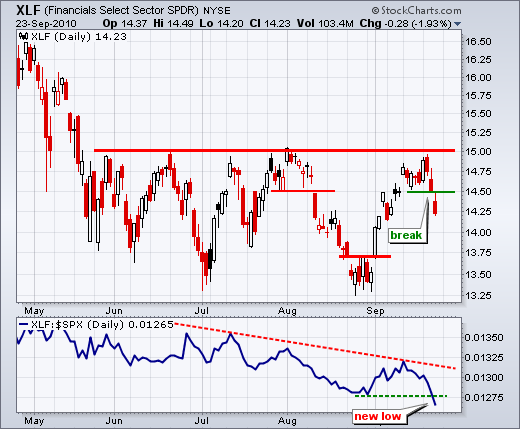
Finance SPDR fails at resistance $XLF
by Arthur Hill,
Chief Technical Strategist, TrendInvestorPro.com
With a sharp decline the last three days, the Finance SPDR (XLF) failed at resistance for the fifth time since late May. In addition, the chart below shows the ETF breaking short-term support with a gap down. Deja vu? The price relative moved to a new low as finance continues...
READ MORE
MEMBERS ONLY
SPY continues stall near summer highs
by Arthur Hill,
Chief Technical Strategist, TrendInvestorPro.com
On the daily chart, SPY formed red indecisive candlesticks with a stall around 114 the last two days. These spinning tops can sometimes foreshadow reversals. Judging from the candlesticks, a decline below 112 would erase Monday's gain and call for a short-term trend reversal. Also notice that SPY...
READ MORE
MEMBERS ONLY
Consumer discretionary SPDR hits channel resistance $XLY
by Arthur Hill,
Chief Technical Strategist, TrendInvestorPro.com
The Consumer Discretionary SPDR (XLY) is one of the leaders in September, but the ETF is now stalling near the upper trendline of a rising price channel. The lower trendline was drawn first and the upper trendline is parallel from the late July high. This trendline extension coincides with the...
READ MORE
MEMBERS ONLY
Google breaks Volume by Price resistance
by Arthur Hill,
Chief Technical Strategist, TrendInvestorPro.com
With a high volume surge the last three days, Google (GOOG) broke above Volume by Price resistance around 500. The stock also broke above its summer highs and has shown relative strength in September.
Click this image for a live chart...
READ MORE
MEMBERS ONLY
SPY breaks above summer highs
by Arthur Hill,
Chief Technical Strategist, TrendInvestorPro.com
SPY broke above its summer highs and closed at its highest level since the second week of May. Perhaps the advance is accelerating higher with this breakout. At this point, the bulls are in clear control and I am focused on what it would take to turn this chart bearish....
READ MORE
MEMBERS ONLY
SPY turns indecisive after resistance break
by Arthur Hill,
Chief Technical Strategist, TrendInvestorPro.com
For stocks, there was good news and bad news on Tuesday. It is positive to see the Euro surging, but negative to see interest rates falling. Throughout 2010, stocks have been positively correlated with interest rates and negatively correlated with the Euro. Which relationship are we to follow here? I...
READ MORE
MEMBERS ONLY
Midcap SPDR also forms inverse head-and-shoulders $MID
by Arthur Hill,
Chief Technical Strategist, TrendInvestorPro.com
In addition to the S&P 500 ($SPX), the S&P MidCap 400 ($MID) formed an inverse head-and-shoulders pattern over the last four months and broke neckline resistance with a surge on Monday. MACD also remains in bull mode as it remains in positive territory and above its...
READ MORE
MEMBERS ONLY
SPY remains buoyant near resistance
by Arthur Hill,
Chief Technical Strategist, TrendInvestorPro.com
There is not much change on the daily chart as we head towards the Fed policy statement on Tuesday. Even though no major policy changes are expected, we cannot not rule volatility on Tuesday afternoon. After churning around 112 the prior four days, SPY opened above 113 with a gap...
READ MORE
MEMBERS ONLY
OFFENSIVE SECTORS LEAD SEPTEMBER SURGE
by Arthur Hill,
Chief Technical Strategist, TrendInvestorPro.com
Leadership from three of the four key offensive sectors makes the September surge all the more impressive. I consider the consumer discretionary, finance, technology and industrials sectors as the offensive sectors that are key to the stock market and the economy. Leadership from at least 2 of the 4 is...
READ MORE
MEMBERS ONLY
Large techs leading the large-caps
by Arthur Hill,
Chief Technical Strategist, TrendInvestorPro.com
The Nasdaq 100 ($NDX) represents large-cap tech stocks and the S&P 100 ($OEX) represents large-cap everything. We can compare these two with the price relative or $NDX:$OEX ratio. With this ratio plot breaking to new highs, it is clear that $NDX is leaving $OEX in the dust....
READ MORE
MEMBERS ONLY
Indicator Summary becomes more positive
by Arthur Hill,
Chief Technical Strategist, TrendInvestorPro.com
With a couple more indicator turns, the indicator summary is now within a point of its maximum reading, which is +10. This often happens after an extended advance and the S&P 500 ($SPX) is up significantly in September. Lagging Nasdaq breadth has been countered by relative strength in...
READ MORE
MEMBERS ONLY
SPY range narrows at resistance
by Arthur Hill,
Chief Technical Strategist, TrendInvestorPro.com
Trading is getting a bit strange, but the bulls clearly have the edge in the stock market right now. Techs have started to lead on the upside, but small-caps were relatively weak as IWM closed down on Thursday. Even though stocks continue to move higher, oil took a rather hard...
READ MORE
MEMBERS ONLY
SPY remains buoyant near resistance
by Arthur Hill,
Chief Technical Strategist, TrendInvestorPro.com
After a weak open, buyers came into the market and pushed stocks higher with a little pop coming in the final hour. There seems to be some performance anxiety creeping into the market as the major indices trade well above their August lows. There is not much change in the...
READ MORE
MEMBERS ONLY
Schwab stalls at trendline resistance
by Arthur Hill,
Chief Technical Strategist, TrendInvestorPro.com
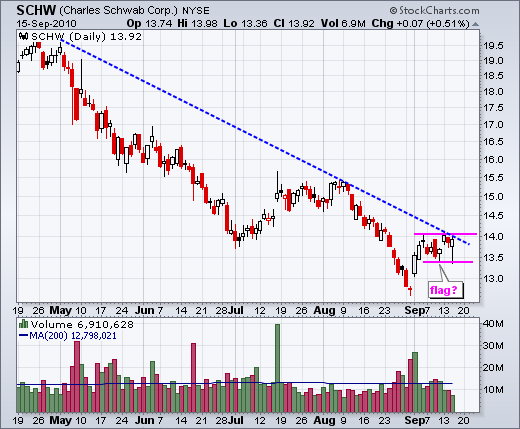
After a high volume surge at the start of September, Charles Schwab (SCHW) moved into a trading range the last two weeks. The pattern this month looks like a flat flag with resistance at the May trendline. A move above 14.10 would break flag resistance and expanding volume would...
READ MORE
MEMBERS ONLY
SPY stalls in resistance zone
by Arthur Hill,
Chief Technical Strategist, TrendInvestorPro.com
There were a couple of bullish developments in the intermarket area over the last few weeks. First, bonds have been moving down and interest rates higher since late August. Bonds have been negatively correlated with stocks in 2010. Interest rates have been positively correlated. Despite an overall uptrend in rates,...
READ MORE
MEMBERS ONLY
Info Tech Bullish Percent Index remains below 50% $XLK
by Arthur Hill,
Chief Technical Strategist, TrendInvestorPro.com
Since moving below 50% in June, the Info Tech Bullish% ($BPTECH) has been oscillating above/below the 50% line the last three months. This reflects indecision and a tug-of-war between bulls and bears. The overall trend is down for BPI, which gives the current edge to the bears. Look for...
READ MORE
MEMBERS ONLY
A narrow range day near resistance
by Arthur Hill,
Chief Technical Strategist, TrendInvestorPro.com
The S&P 500 Volatility Index ($VIX) reached an extreme five days ago that could foreshadow a pullback or top in the stock market. The chart below shows the VIX with Bollinger Bands. Notice that the indicator moved below the lower band on September 3rd for the first time...
READ MORE
MEMBERS ONLY
A flag breakout for the Bovespa
by Arthur Hill,
Chief Technical Strategist, TrendInvestorPro.com
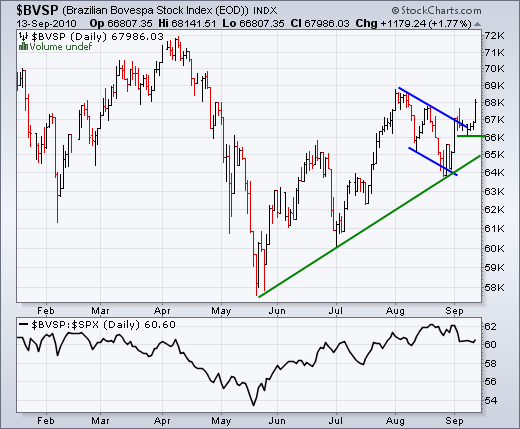
The Brazilian Bovespa Index ($BVSP) is one of the best performing markets since late May. After surging in July, the index formed a large falling flag in August and broke above flag resistance the last few days. This calls for a continuation of the uptrend with the April high marking...
READ MORE
MEMBERS ONLY
The bulls refuse to buckle
by Arthur Hill,
Chief Technical Strategist, TrendInvestorPro.com
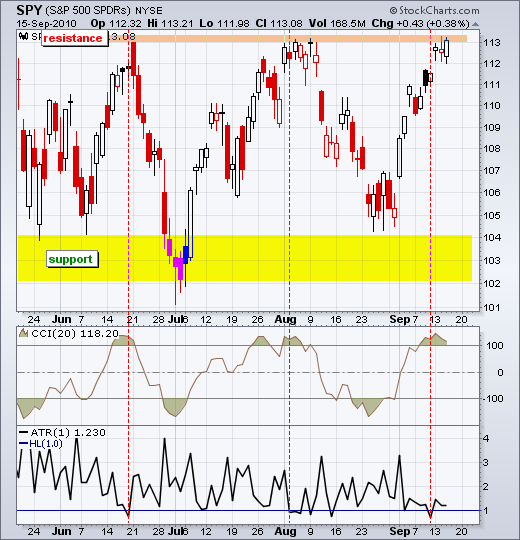
On the daily chart, SPY remains within a large consolidation with support around 104 and resistance around 113. The ETF closed at 111.48 and the futures are pointing to a little upside pop on the open. At some point, performance anxiety may enter the picture to propel the ETF...
READ MORE
MEMBERS ONLY
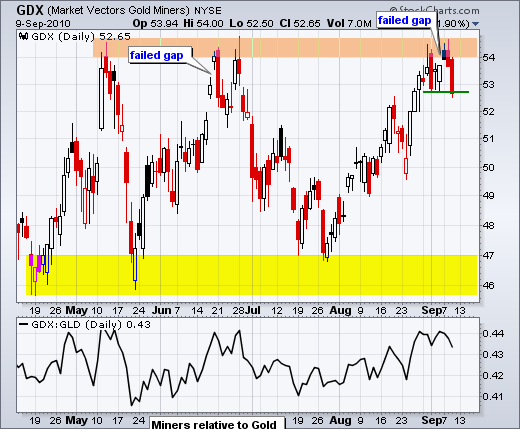
$GDX forms exhaustion gap at resistance
by Arthur Hill,
Chief Technical Strategist, TrendInvestorPro.com
The Gold Miners ETF (GDX) surged to resistance at the end of August and then formed a big bearish engulfing the first trading day of September. After stalling on Thursday-Friday last week, the stock gapped up on Tuesday and then came down hard Wednesday-Thursday this week. The gap failed and...
READ MORE
MEMBERS ONLY
Indicator Summary remains positive
by Arthur Hill,
Chief Technical Strategist, TrendInvestorPro.com
The indicator summary has been switching from positive to negative since May. This coincides with a trading range in the S&P 500 since May. This week the Bullish Percent Indices and Volatility Indices flipped into bull mode. While the majority of indicators are bullish overall, many remain vulnerable...
READ MORE
MEMBERS ONLY
SPY labors higher
by Arthur Hill,
Chief Technical Strategist, TrendInvestorPro.com
There is no real change on the daily chart as SPY labors higher. The ETF fell back with a red candlestick on Tuesday, edged higher with a small white candlestick on Wednesday and then formed a filled black candlestick yesterday. Black means the close was up from the prior close....
READ MORE
MEMBERS ONLY
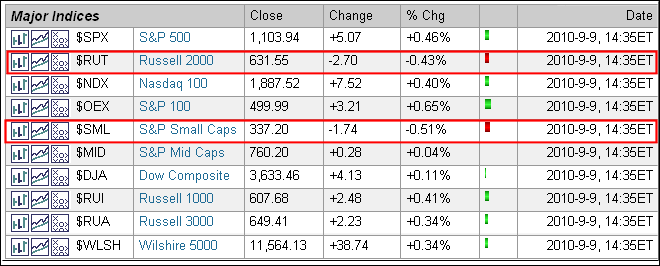
Small-caps show relative weakness
by Arthur Hill,
Chief Technical Strategist, TrendInvestorPro.com
Even though the market as a whole was up on Thursday afternoon, a quick look at the intraday market summary reveals some relative weakness in small-caps. Of the 10 major indices shown, the Russell 2000 ($RUT) and the S&P 600 SmallCap Index ($SML) are the only two losers....
READ MORE
MEMBERS ONLY
SPY consolidates in resistance zone
by Arthur Hill,
Chief Technical Strategist, TrendInvestorPro.com
For short-term traders, SPY is currently caught between a rock and a hard place. The swing is clearly up after last week's breakout, but the ETF became overbought with Friday's close above 111. Also note that the ETF remains in a large trading range that extends...
READ MORE
MEMBERS ONLY
Net New Highs surge on TSX
by Arthur Hill,
Chief Technical Strategist, TrendInvestorPro.com
With a big move in the TSX Composite ($TSX) over the last two weeks, Net New Highs surged to their highest level since April. Notice that Net New Highs turned positive in early July, strengthened in August and then broke above +50 in late August.
Click this image for a...
READ MORE
MEMBERS ONLY
SPY backs off short-term resistance
by Arthur Hill,
Chief Technical Strategist, TrendInvestorPro.com
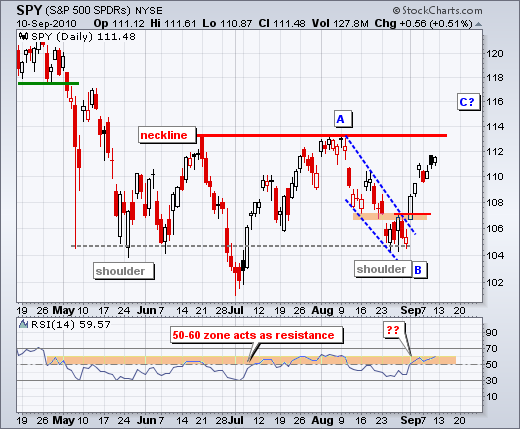
On the daily chart, the S&P 500 ETF (SPY) is currently on an upswing within a larger consolidation. This larger consolidation is, of course, the inverse head-and-shoulders pattern. Unconfirmed, this pattern is just one big consolidation or trading range. Confirmed, with a break above the June-August highs, it...
READ MORE