MEMBERS ONLY
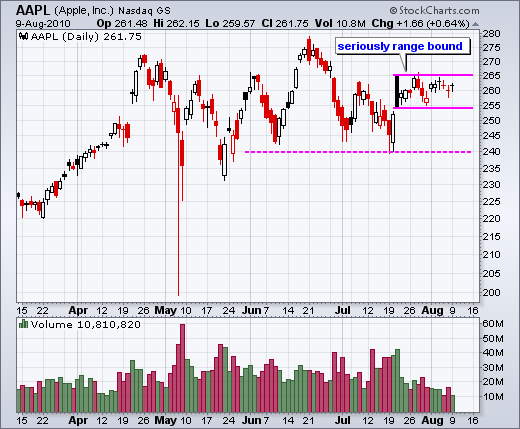
Bollinger Bands narrow for Apple
by Arthur Hill,
Chief Technical Strategist, TrendInvestorPro.com
Apple (AAPL) continues to consolidation within a relatively narrow range. The stock has traded between 266 and 254.90 for the last 13 days. Falling volatility is confirmed with the Bollinger BandWidth indicator, which shows the bands at their tightest in over five months. The direction of the consolidation break...
READ MORE
MEMBERS ONLY
SPY stays strong as Fed looms
by Arthur Hill,
Chief Technical Strategist, TrendInvestorPro.com
Don't fight the Fed. This Wall Street motto is as old as the Fed. Even if you doubt the Fed's ability to influence the long-term outcome, the Fed can still affect the short-term expectations. Quantitative easing (QE) is back on the table and this may keep...
READ MORE
MEMBERS ONLY
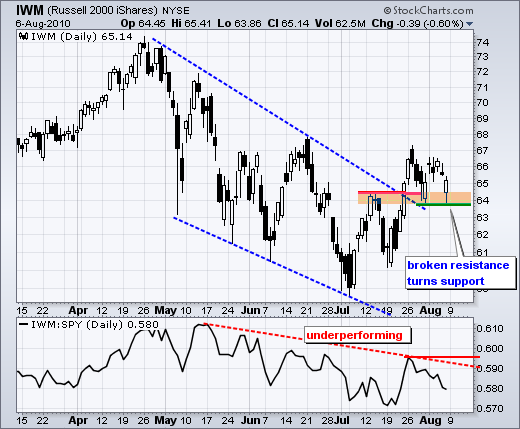
Broken resistance turns support for IWM
by Arthur Hill,
Chief Technical Strategist, TrendInvestorPro.com
A classic tenet of technical analysis is that broken resistance turns into support (and visa versa). The Russell 2000 ETF (IWM) broke the April trendline and resistance from its mid July high with a surge above 64.5 in late July. This broken resistance zone (63.8-64.5) now turns...
READ MORE
MEMBERS ONLY
SPY still challenging resistance
by Arthur Hill,
Chief Technical Strategist, TrendInvestorPro.com
Despite a worse-than-expected jobs number, stocks managed to limit early losses and surge in the final hour of trading. Conspiracy theorists are calling this manipulation. Maybe. Maybe not. To be honest, nobody really knows. The best we can do is watch the price action and trade accordingly. Even if the...
READ MORE
MEMBERS ONLY
Risk-on versus Risk-off with intermarket PerfCharts
by Arthur Hill,
Chief Technical Strategist, TrendInvestorPro.com
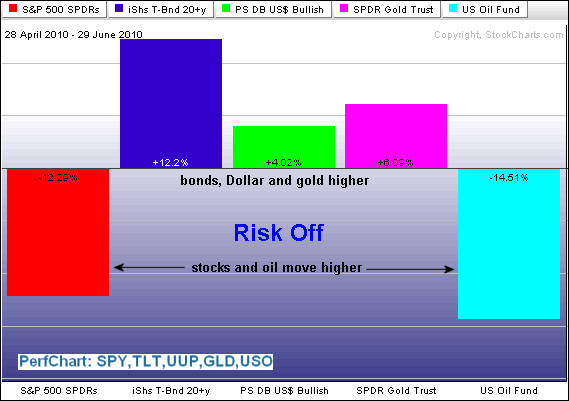
The intermarket picture shows a preference for the risk-on trade over the last five weeks. The next two PerfCharts show five intermarket ETFs over two distinct timeframes. The first extends from late April until late June, which is when stocks declined sharply. The second extends from early July to early...
READ MORE
MEMBERS ONLY
Risk-on trade favors stocks and oil
by Arthur Hill,
Chief Technical Strategist, TrendInvestorPro.com
The intermarket relationships over the last five weeks show stocks and oil rising together. On the other side, bonds, the Dollar and gold are down since early July. This looks like the classic "risk-on" trade. Strength in stocks and oil reflects an increased appetite for risk.
Click this...
READ MORE
MEMBERS ONLY
Indicator Summary turns positive
by Arthur Hill,
Chief Technical Strategist, TrendInvestorPro.com
The overall picture is still mixed, but bullish assessments of the volatility indices and Net New Highs pushed the indicator summary into positive territory for the first time since mid June. The S&P 500 Volatility Index ($VIX) and Nasdaq 100 Volatility Index ($VXN) continue to move lower and...
READ MORE
MEMBERS ONLY
Muted reaction to initial claims increase
by Arthur Hill,
Chief Technical Strategist, TrendInvestorPro.com
Despite a jump in initial jobless claims, the market managed to mute its losses and trade in a narrow range. The consensus was for 455,000 initial jobless claims and the actual number was 479,000. This is considerably higher, but the market took it in stride. The market held...
READ MORE
MEMBERS ONLY
Hostage to the employment numbers
by Arthur Hill,
Chief Technical Strategist, TrendInvestorPro.com
There is no change in the medium-term or short-term trends, which are both up. Even though SPY is trading in a resistance zone marked by the June high and 50-62% retracement zone, the trend is up and we have yet to see a failure or reversal at resistance. The break...
READ MORE
MEMBERS ONLY
Bonds test support ahead of employment report
by Arthur Hill,
Chief Technical Strategist, TrendInvestorPro.com
The 20+ Year T-Bond ETF (TLT) is at a make-or-break level with two key employment related releases over the next two days. An improving employment picture would likely lead to a support break, but further weakness in the employment numbers could keep bonds buoyant.
Click this image for details...
READ MORE
MEMBERS ONLY
An inside day to signal indecision
by Arthur Hill,
Chief Technical Strategist, TrendInvestorPro.com
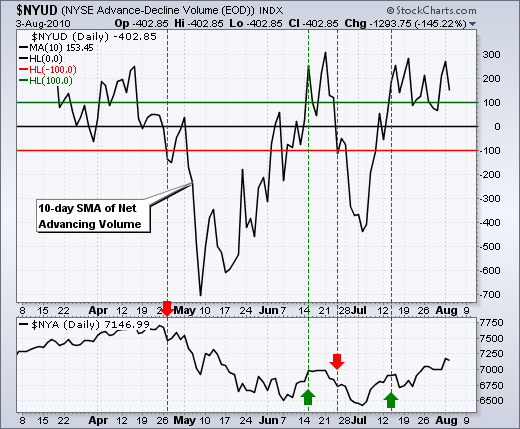
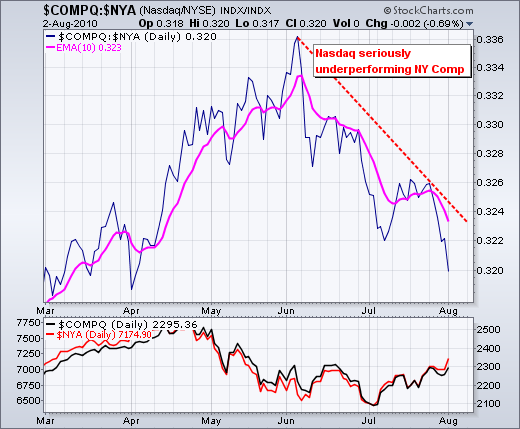
The NYSE and NY Composite have been driving the current rally. NYSE breadth has been stronger than Nasdaq breadth and the NY Composite has far outperformed the Nasdaq over the last five weeks. The leader will offer the first clues of a potential reversal. The chart below shows the 10-day...
READ MORE
MEMBERS ONLY
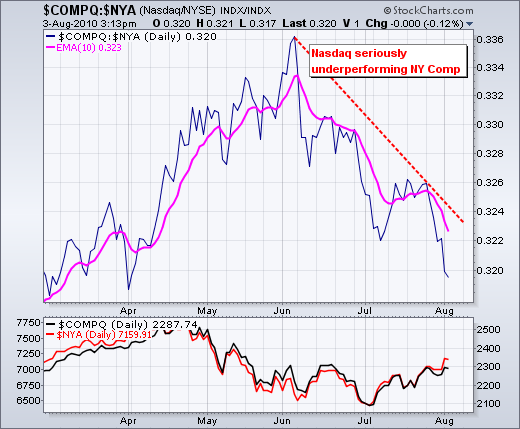
Nasdaq underperforming the NY Composite
by Arthur Hill,
Chief Technical Strategist, TrendInvestorPro.com
Ratio charts allow chartists to compare the performance of one security against another. The chart below plots the ratio of the Nasdaq and the NY Composite. The Nasdaq is underperforming because this ratio ($COMPQ:$NYA) has been falling since June.
Click this image for details...
READ MORE
MEMBERS ONLY
SPY surges towards June high
by Arthur Hill,
Chief Technical Strategist, TrendInvestorPro.com
The bulls came out charging on Monday. Strength in European banks and equities triggered yesterday's strong open. More importantly, stocks remained strong throughout the day and the major index ETFs closed near their highs for the session. NYSE breadth was strong, but Net Advances, Net Advancing Volume and...
READ MORE
MEMBERS ONLY
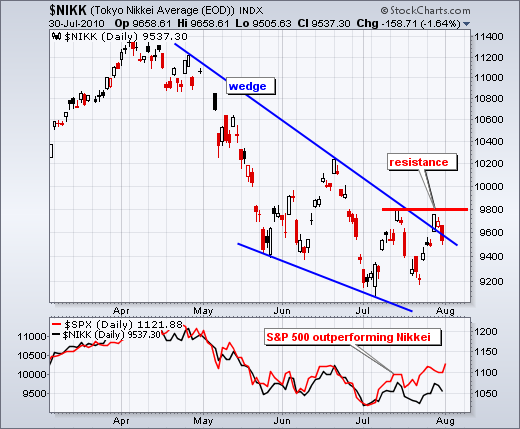
Nikkei remains short of breakout
by Arthur Hill,
Chief Technical Strategist, TrendInvestorPro.com
While the S&P 500 moved above its mid July high, the Nikkei 225 ($NIKK) remains short of a breakout and within a downtrend still. $NIKK surged to resistance last week, but fell just short of 9800 and pullback on Friday. A break above this resistance level is needed...
READ MORE
MEMBERS ONLY
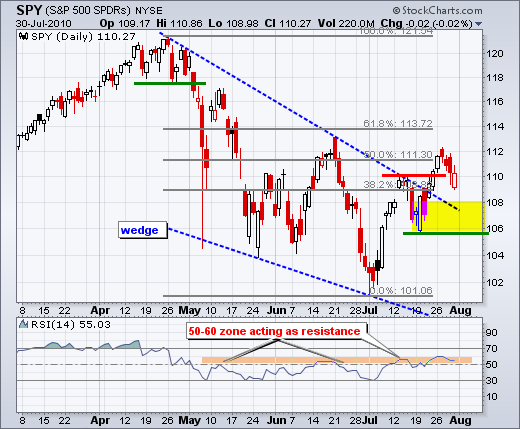
SPY holds suppport and uptrend
by Arthur Hill,
Chief Technical Strategist, TrendInvestorPro.com
After a big surge in July, the S&P 500 ETF (SPY) hit resistance around 112 and pulled back last week. Overall, SPY broke above the wedge trendline and exceeded its mid July high. These are bullish developments, but overbought conditions, key retracements and resistance kept stocks under pressure...
READ MORE
MEMBERS ONLY
A P&F triple bottom break for Whirlpool
by Arthur Hill,
Chief Technical Strategist, TrendInvestorPro.com
Whirlpool (WHR) came across the triple bottom break scan. The stock is in a clear downtrend with lower lows and lower highs since May. WHR broke triple bottom support twice in the next few days and the downside price objective is 74. This objected is based on traditional P&...
READ MORE
MEMBERS ONLY
Indicator Summary remains negative - barely
by Arthur Hill,
Chief Technical Strategist, TrendInvestorPro.com
It all depends on where we set key resistance. If the mid July highs marked key resistance, then this indicator summary would be in bull mode. If the mid June highs mark key resistance, then a number of indicators and ETFs remain short of trend changing breakouts. Because this is...
READ MORE
MEMBERS ONLY
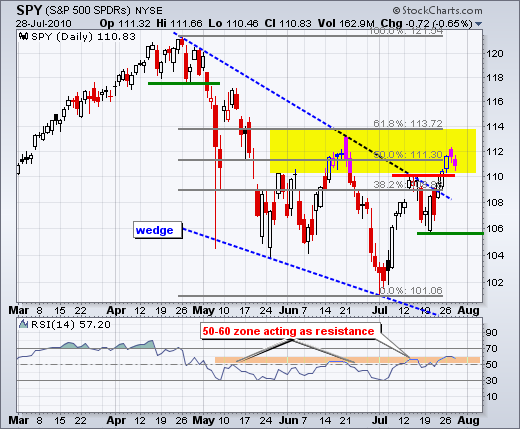
Two failed gaps at resistance
by Arthur Hill,
Chief Technical Strategist, TrendInvestorPro.com
Even though the July surge had impressive breadth and upside momentum, the S&P 500 ETF (SPY) is clearly running into resistance around 112. Resistance from prior highs and key retracements is not surprising. In addition, the ETF became overbought early this week after a 10% advance in 17...
READ MORE
MEMBERS ONLY
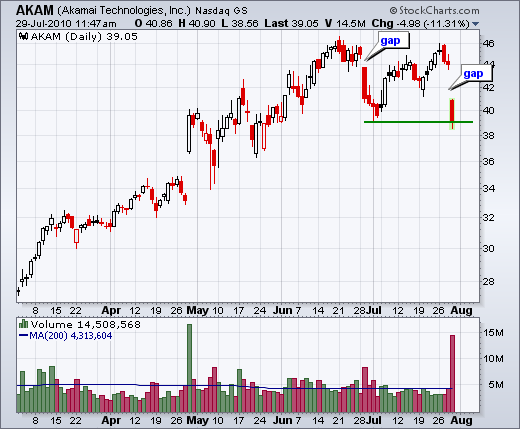
Akamai gaps down from resistance
by Arthur Hill,
Chief Technical Strategist, TrendInvestorPro.com
For the second time in two months, Akamai (AKAM) gapped down from resistance at 46. The stock first hit resistance here in mid June and gapped down in late June. AKAM moved back to resistance in July, but failed again with another gap and high-volume decline.
Click this image for...
READ MORE
MEMBERS ONLY
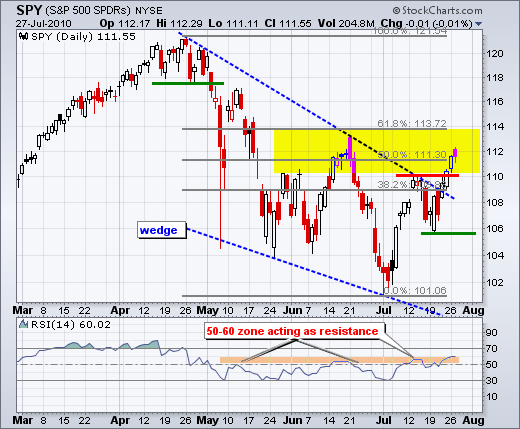
SPY forms small falling flag
by Arthur Hill,
Chief Technical Strategist, TrendInvestorPro.com
There is no change on the daily chart as SPY stalls in its resistance zone. Even though the strong July surge and wedge breakout are medium-term bullish, SPY is still on the overbought side and battling resistance. First, the ETF advanced around 10% from its July low (~102 to ~112)...
READ MORE
MEMBERS ONLY
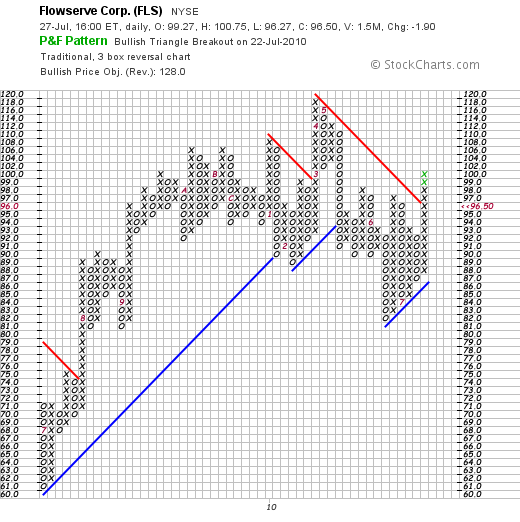
Flowserve with P&F triangle breakout
by Arthur Hill,
Chief Technical Strategist, TrendInvestorPro.com
Flowserve (FLS) came across the bullish triangle alert page from the P&F pattern scans. On the P&F chart, notice how the stock broke above the bearish resistance line with a surge above 98. As far as Point & Figure is concerned, this chart remains bullish as...
READ MORE
MEMBERS ONLY
A little selling pressure emerges
by Arthur Hill,
Chief Technical Strategist, TrendInvestorPro.com
After strong buying pressure four of the last five days, stocks took a breather on Tuesday as the S&P 500 ETF (SPY) forged a small red candlestick. SPY opened above 112 and closed below 112. After a strong open, SPY moved lower and this indicates selling pressure. The...
READ MORE
MEMBERS ONLY
Apple stalls with 3 inside days
by Arthur Hill,
Chief Technical Strategist, TrendInvestorPro.com
While the market continued higher the last three days, Apple (AAPL) stalled with three inside days. This stall comes after last week's wedge breakout, which is still holding. A move below last week's gap (252) would negate the breakout.
Click this image for details...
READ MORE
MEMBERS ONLY
Short-term overbought and staying that way
by Arthur Hill,
Chief Technical Strategist, TrendInvestorPro.com
Even though volume has been light in July, breadth has been strong, especially on the NYSE. Breadth is picking up steam on the Nasdaq as Net New Highs hit +91 and Net Advances exceeded +1000 for the third day in a row. Summer volume is supposed to be light so...
READ MORE
MEMBERS ONLY
Dollar Index becomes oversold
by Arthur Hill,
Chief Technical Strategist, TrendInvestorPro.com
The US Dollar Index ($USD) became oversold as RSI moved below 30 last week. In addition, notice that the index has retraced just over 62% of the March-June advance. A channel has taken shape since early June and traders should watch for a channel breakout to reverse this downtrend.
Click...
READ MORE
MEMBERS ONLY
SPY breaks falling wedge trendline
by Arthur Hill,
Chief Technical Strategist, TrendInvestorPro.com
The medium-term picture is perking up as stocks finished strong last week. SPY started the week with an indecisive candlestick last Monday. After a weak open below 106 on Tuesday, SPY finished strong with a close above 108 that very same day. There was a sharp pullback on Wednesday, but...
READ MORE
MEMBERS ONLY
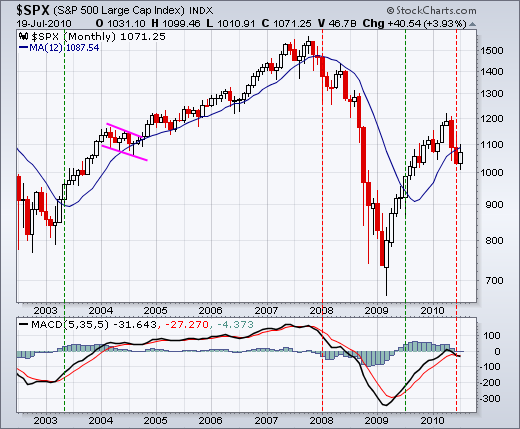
S&P 500 BREAKS LONG-TERM MOVING AVERAGE
by Arthur Hill,
Chief Technical Strategist, TrendInvestorPro.com
On the monthly chart, the S&P 500 broke below its 12-month moving average for the first time since July 2009. Even though moving average crossovers do not pick exact bottoms or tops, this moving average cross captured the major moves over the last eight years. As with all...
READ MORE
MEMBERS ONLY
DAX has yet to break down
by Arthur Hill,
Chief Technical Strategist, TrendInvestorPro.com
Despite all the troubles in Europe, the German DAX ($DAX) remains in a uptrend since March 2009 and has yet to roll over. The index is above its 12-month moving average and MACD(5,35,5) is positive. However, notice that index retraced 50-62% of its prior decline and is...
READ MORE
MEMBERS ONLY
Bonds remain in long-term uptrend
by Arthur Hill,
Chief Technical Strategist, TrendInvestorPro.com
The 20+ Year T-Bond ETF (TLT) continues to trend higher within a large rising price channel. The ETF surged above the channel during the finance crisis of 2008, but returned to this channel in 2009 and resumed its rise in 2010. Long-term support is set at 85.
Click this image...
READ MORE
MEMBERS ONLY
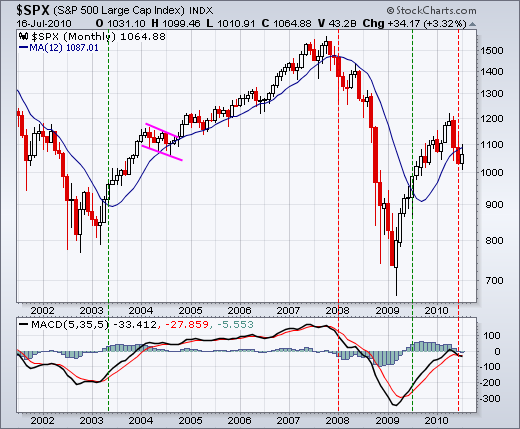
S&P 500 breaks 12-month moving average
by Arthur Hill,
Chief Technical Strategist, TrendInvestorPro.com
The monthly chart below shows the S&P 500 holding its 12-month moving average throughout long-term moves over the last 9 years. A decisive close above or below this 12-month moving average has been indicative of a long-term trend change, which occurred last month. Also notice that MACD(5,...
READ MORE
MEMBERS ONLY
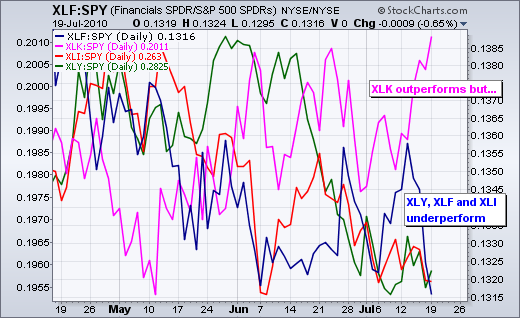
XLK outperforms SPY in July
by Arthur Hill,
Chief Technical Strategist, TrendInvestorPro.com
Believe it or not, the Technology SPDR (XLK) is outperforming the S&P 500 ETF (SPY) in July. The chart below shows four price relatives comparing the performance of the Technology SPDR (XLK), Industrials SPDR (XLI), Financials SPDR (XLF) and Consumer Discretionary SPDR (XLY) to the S&P...
READ MORE
MEMBERS ONLY
SPY stalls after sharp decline
by Arthur Hill,
Chief Technical Strategist, TrendInvestorPro.com
On the daily chart, the S&P 500 ETF (SPY) stalled with a small gain on the day. After Friday's sharp decline, a little indecision or a small rebound is normal. There is really no change on the daily chart. The falling wedge still dominates the overall...
READ MORE
MEMBERS ONLY
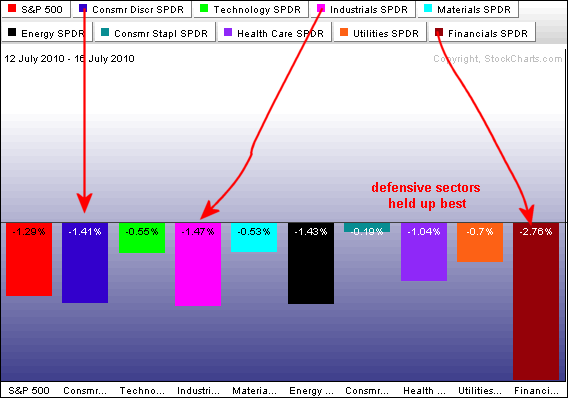
Finance leads the way lower
by Arthur Hill,
Chief Technical Strategist, TrendInvestorPro.com
The PerfChart below shows the percentage change for the nine sector SPDRs over the last five days (last week). Stocks were holding up well until Friday. With Friday's sharp decline, finance is now showing relative weakness because it declined more than the S&P 500 and more...
READ MORE
MEMBERS ONLY
SPY fails at resistance zone
by Arthur Hill,
Chief Technical Strategist, TrendInvestorPro.com
Stocks moved sharply lower with a broad decline on Friday. The major indices were down from 2.52% (Dow) to 3.82% (Russell 2000). Small-caps continue showing relative weakness. All sectors were down with finance (-4.21%), consumer discretionary (-3.50%) and industrials (-3.34%) leading the way. Relative weakness...
READ MORE
MEMBERS ONLY
Cummins forms bearish engulfing near resistance
by Arthur Hill,
Chief Technical Strategist, TrendInvestorPro.com
Cummins Engine came across the bearish engulfing scan as it opened strong and closed weak near resistance. The stock failed in the 74-76 area in April, May and June. July marks the fourth attempt. A move above resistance would break resistance from a rather large symmetrical triangle.
Click this image...
READ MORE
MEMBERS ONLY
Indicator Summary remains negative
by Arthur Hill,
Chief Technical Strategist, TrendInvestorPro.com
Even though last week's bounce continued this week, the indicator summary remains negative. The AD Lines and AD Volume Lines surged, but remain below their June highs (resistance). Another strong week would likely push these indicators above resistance and into bull mode. This means Mr Market is at...
READ MORE
MEMBERS ONLY
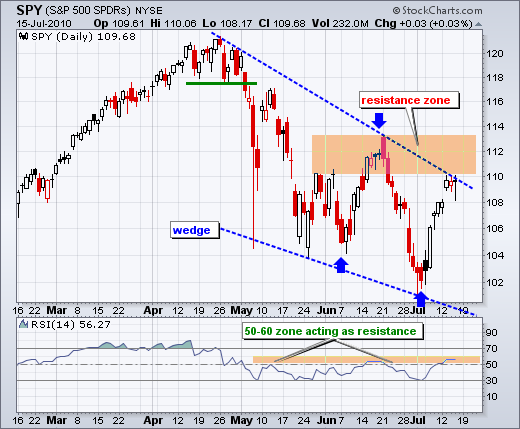
SPY extends stall near resistance zone
by Arthur Hill,
Chief Technical Strategist, TrendInvestorPro.com
There is no change on the daily chart as SPY stalls just below its big resistance zone. On a closing basis, there have been three moves in excess of 6% over the last 26 days (blue arrows). First, SPY bottomed on June 7th and advanced 6.4% in nine days....
READ MORE
MEMBERS ONLY
Euro-SPY connection remains
by Arthur Hill,
Chief Technical Strategist, TrendInvestorPro.com
There was a little delay, but the positive correlation between the Euro the US stocks remains in place.
The Euro ETF (FXE) bottomed on June 29 and SPY bottomed two days later. FXE surged in early July and SPY followed the Euro high the second week of July.
Click this...
READ MORE
MEMBERS ONLY
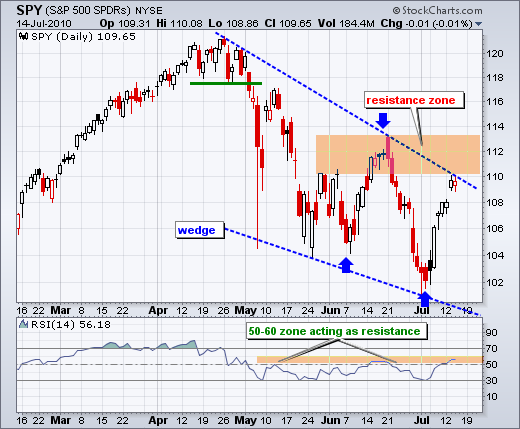
SPY stall near resistance zone
by Arthur Hill,
Chief Technical Strategist, TrendInvestorPro.com
There is no change on the daily chart as SPY stalls just below its big resistance zone. On a closing basis, there have been three moves in excess of 6% over the last 26 days (blue arrows). First, SPY bottomed on June 7th and advanced 6.4% in nine days....
READ MORE
MEMBERS ONLY
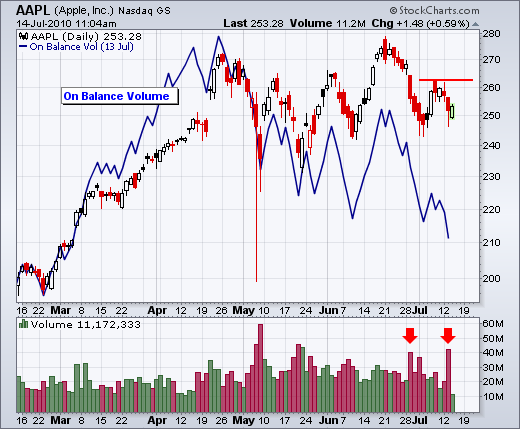
Selling Pressue in OBV for Apple
by Arthur Hill,
Chief Technical Strategist, TrendInvestorPro.com
The Apple chart shows signs of increased selling pressure with a steady decline in On Balance Volume (OBV) the last 2-3 months. OBV peaked in mid April, formed a lower high in late June and moved to new lows in July. With Apple (AAPL) hitting a new high in late...
READ MORE