MEMBERS ONLY
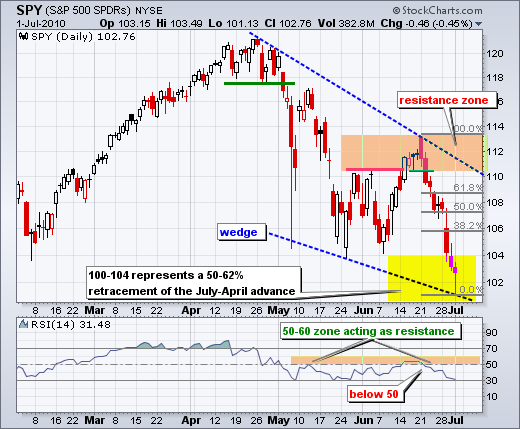
SPY hits resistance zone on daily chart
by Arthur Hill,
Chief Technical Strategist, TrendInvestorPro.com
Stocks were oversold 7-8 days ago and an oversold bounce was expected. However, I must admit that I did not expect a move all the way to the 110-113 resistance zone, especially after sharpness of the prior decline. On a closing basis, there have been three moves in excess of...
READ MORE
MEMBERS ONLY
See the Market Message for today's commentary
by Arthur Hill,
Chief Technical Strategist, TrendInvestorPro.com
See the Market Message for today's commentary ( click here)....
READ MORE
MEMBERS ONLY
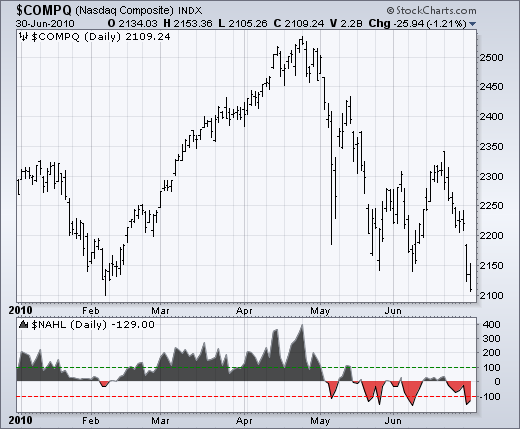
Nasdaq P&F chart shows downtrend
by Arthur Hill,
Chief Technical Strategist, TrendInvestorPro.com
The Nasdaq Point & Figure chart sports a clear downtrend with a bearish resistance line and a downside price objective around 1900. According to this chart, the trend will remain down until there is a break above the bearish resistance line, which is currently around 2345.
Click this image for...
READ MORE
MEMBERS ONLY
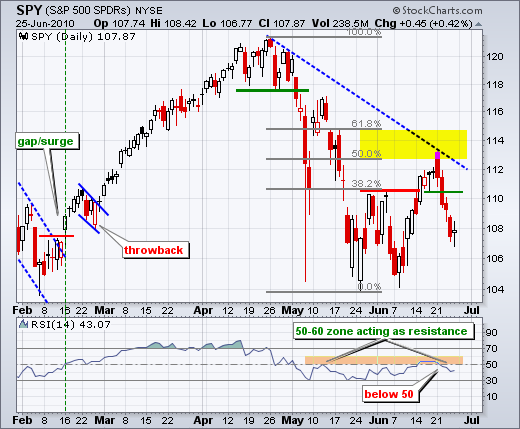
SPY enters retracement zone
by Arthur Hill,
Chief Technical Strategist, TrendInvestorPro.com
There is no change on the daily chart. SPY remains in a downtrend overall and is currently trading near the middle of its seven week range (113-101). A falling wedge defines the overall downtrend with a resistance zone around 110-113 from the June highs. Even though last week's...
READ MORE
MEMBERS ONLY
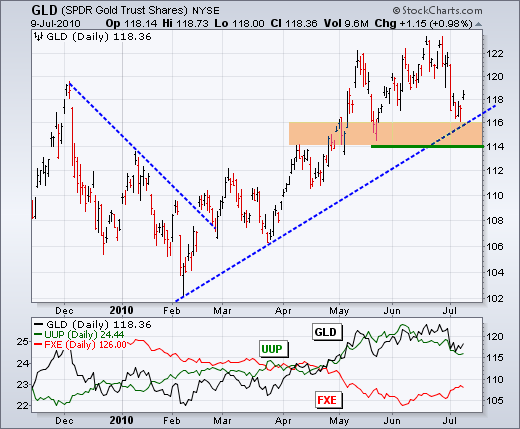
Gold and silver test support zones
by Arthur Hill,
Chief Technical Strategist, TrendInvestorPro.com
After sharp declines in late June and early July, gold and silver are testing important support zones from their prior lows. The fist chart shows the Gold ETF (GLD) hitting new 52-week highs in late June. These highs did not hold long as GLD declined towards support around 114-116. This...
READ MORE
MEMBERS ONLY
Fidelity Funds carpet view
by Arthur Hill,
Chief Technical Strategist, TrendInvestorPro.com
Even if you do not invest in Fidelity Funds, the Fidelity Funds Carpet can be used to find outperforming and underperforming groups. Over the last 6 days, bond funds have been lagging and international funds have been leading. Within the US, Energy Services are leading and Gold is lagging.
Click...
READ MORE
MEMBERS ONLY
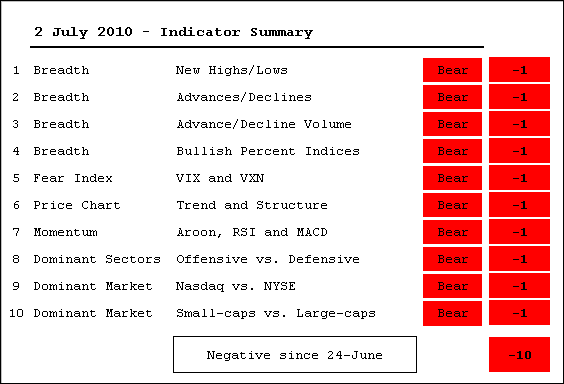
Indicator Summary remains decidedly negative
by Arthur Hill,
Chief Technical Strategist, TrendInvestorPro.com
Even with this week's bounce, the indicator summary remains decidedly negative. The AD Lines and AD Volume Lines remain in clear downtrends and bullish divergences have yet to appear. NYSE Net New Highs have yet to break down, but have yet to surge higher. The S&P...
READ MORE
MEMBERS ONLY
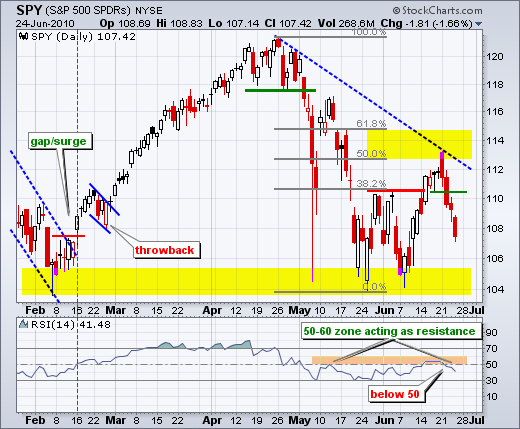
SPY hits the 50% retracement
by Arthur Hill,
Chief Technical Strategist, TrendInvestorPro.com
On the daily chart, SPY remains in a downtrend overall and is currently trading in the middle of its seven week range. This range includes the mid June high around 113 and the early July low around 101. A falling wedge defines the overall downtrend with a resistance zone around...
READ MORE
MEMBERS ONLY
Relative strength in XLU
by Arthur Hill,
Chief Technical Strategist, TrendInvestorPro.com
Over the last 10 trading days, the Utilities SPDR (XLU) is the only sector sporting a gain. Utilities show both absolute and relative strength.
Click this image for details...
READ MORE
MEMBERS ONLY
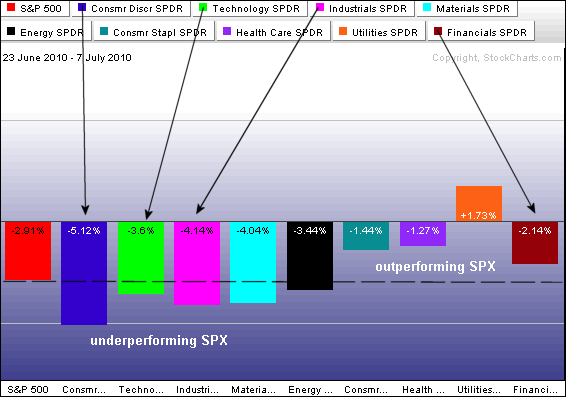
Oversold bounce within a bigger downtrend
by Arthur Hill,
Chief Technical Strategist, TrendInvestorPro.com
Stocks surged yesterday with a pretty strong advance. Advances swamped declines and advancing volume far exceeded declining volume - on both the NYSE and the Nasdaq. Volume was light, but volume should be light during the summer so I am not concerned with volume at this point. All sectors were...
READ MORE
MEMBERS ONLY
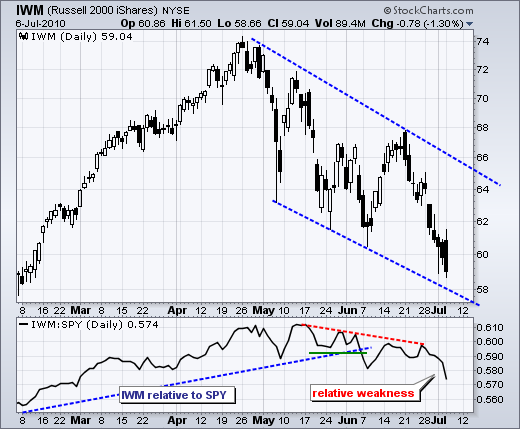
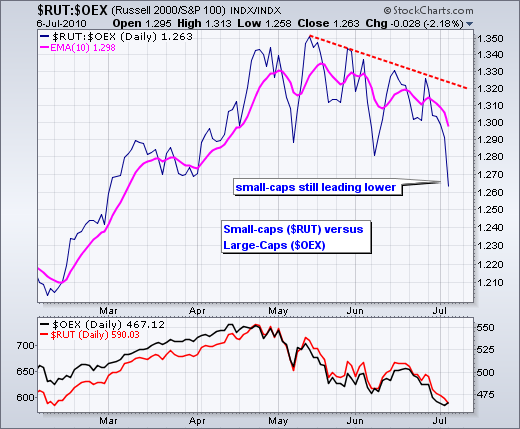
IWM closes weak and leads lower
by Arthur Hill,
Chief Technical Strategist, TrendInvestorPro.com
The Russell 2000 ETF (IWM) surged above 61 intraday, but gave up sizable gains and closed near 59. The ETF even closed below last week's low. The indicator window shows the IWM:SPY ratio, which compares small-caps to large-caps. This ratio is moving lower as small-caps lead lower....
READ MORE
MEMBERS ONLY
Stocks fail to hold gains and close weak
by Arthur Hill,
Chief Technical Strategist, TrendInvestorPro.com
Stocks were strangely mixed on Tuesday with the large-cap indices edging higher and the small-cap indices falling rather sharply. The S&P 500 and Dow gained around .50%, but the Russell 2000 and S&P 600 SmallCap Index lost around 1.50%. The Russell 2000 was up over...
READ MORE
MEMBERS ONLY
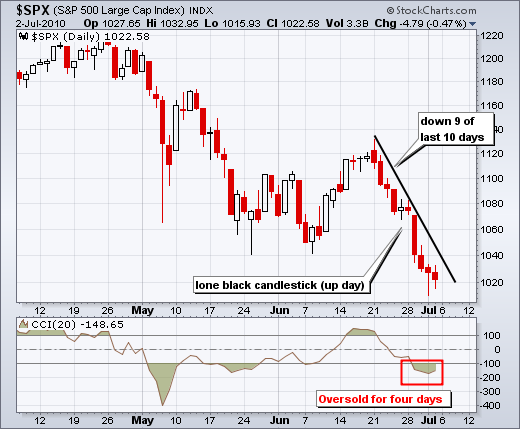
SPX declines 9 out of 10 days
by Arthur Hill,
Chief Technical Strategist, TrendInvestorPro.com
The S&P 500 is now down nine of the last 10 days. Notice the nine red candlesticks and the lone black candlestick. In addition, the Commodity Channel Index (CCI) has been oversold since the decline below 1040.
Click this image for details...
READ MORE
MEMBERS ONLY
Stocks remain oversold after steep decline
by Arthur Hill,
Chief Technical Strategist, TrendInvestorPro.com
After a steep decline the last two weeks, stocks are deeply oversold and pessimism is running rampant. A story on Bob Prechter's "take cover" forecast is the "most emailed" article in the New York Times. The 50-day SMA closed below the 200-day SMA in...
READ MORE
MEMBERS ONLY
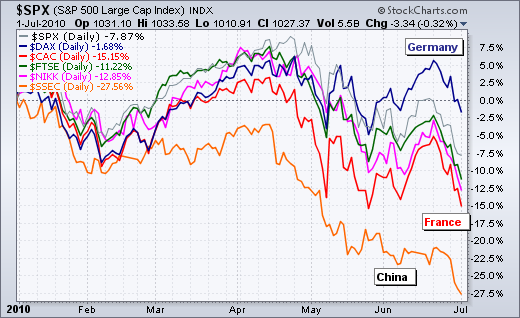
China leads lower in 2010
by Arthur Hill,
Chief Technical Strategist, TrendInvestorPro.com
Of the six equity indices shown below, the Shanghai Composite ($SSEC) is the weakest in 2010 with a 27.56% loss (year-to-date). The Nikkei 225 ($NIKK), French CAC 40 ($CAC) and London FTSE ($FTSE) are all down double digits. The S&P 500 is holding up relatively well with...
READ MORE
MEMBERS ONLY
Indicator Summary goes more negative
by Arthur Hill,
Chief Technical Strategist, TrendInvestorPro.com
With a sharp decline the last two weeks, all indicators are in bear mode. The indicator summary turned negative last Friday (-4) and moved to -10 this week. Oversold conditions and excessive bearish sentiment are the only positives in the stock market right now. This may produce an oversold bounce,...
READ MORE
MEMBERS ONLY
SPY forms hammer after steep decline
by Arthur Hill,
Chief Technical Strategist, TrendInvestorPro.com
After a 9 day 9.7% decline from high to low, the S&P 500 ETF (SPY) formed a hammer by closing well above its intraday low. I do not think this was the big selling climax, but it does mark an intraday reversal that could put in a...
READ MORE
MEMBERS ONLY
Nasdaq new 52-week lows expanding
by Arthur Hill,
Chief Technical Strategist, TrendInvestorPro.com
New 52-week lows are expanding on the Nasdaq and new 52-week highs are drying up. Net New Highs (new 52-week highs less new 52-week lows) is an easy way to assess the battle for new 52-week extremes. Net New Highs first dipped below -100 in early May and has dipped...
READ MORE
MEMBERS ONLY
The knife continues to fall for SPY
by Arthur Hill,
Chief Technical Strategist, TrendInvestorPro.com
Stocks attempted to hold their ground on Wednesday, but afternoon selling pressure drove the major index ETFs below Tuesday's lows. The major index ETFs were down around 1%. All sectors were lower with technology, consumer discretionary and finance leading the way down. Relative weakness in these three reinforces...
READ MORE
MEMBERS ONLY
StochRSI turns oversold for SMH
by Arthur Hill,
Chief Technical Strategist, TrendInvestorPro.com
Also known as RSI on steroids, StochRSI is the Stochastic Oscillator applied to RSI values. It becomes overbought and oversold a lot more than both indicators. SMH declined to support in the 25.5-26 area as StochRSI moved below .20 to become oversold. The cup is half full for StochRSI...
READ MORE
MEMBERS ONLY
SPY becomes oversold near May lows
by Arthur Hill,
Chief Technical Strategist, TrendInvestorPro.com
At this point the medium-term trends (daily charts) are clearly in bear mode (downtrends). However, the major index ETFs are short-term oversold after sharp declines. In addition, many are trading near potential support from their May lows. "Potential" is the key word here. Support levels are potential in...
READ MORE
MEMBERS ONLY
S&P 500 tests May lows
by Arthur Hill,
Chief Technical Strategist, TrendInvestorPro.com
With a sharp decline early Tuesday, the S&P 500 is once again testing the May-June lows. In fact, this test also involves the February low. The 1040 level held in February, late May and early June. Can it handle another assault?
Click this image for a live chart....
READ MORE
MEMBERS ONLY
SPY forms triangle within downtrend
by Arthur Hill,
Chief Technical Strategist, TrendInvestorPro.com
The demise of the consumer discretionary remains the most important event of the last few weeks. The Consumer Discretionary SPDR (XLY) was holding up fine in May, but came down hard in June and is the weakest of the eight sectors this month. Consumer discretionary is no ordinary sector. It...
READ MORE
MEMBERS ONLY
Gold ETF battles resistance
by Arthur Hill,
Chief Technical Strategist, TrendInvestorPro.com
For the second time in two weeks, the Gold ETF (GLD) surged above resistance at 122 and then moved back below with a long red candlestick. The overall uptrend in GLD remains in place, but there is considerable resistance in this area. First support is set at last week'...
READ MORE
MEMBERS ONLY
SPY forms spinning top near key retracement
by Arthur Hill,
Chief Technical Strategist, TrendInvestorPro.com
After a four day decline, SPY formed a big spinning top to establish a potential support zone around 107-108. These candlesticks have small bodies and long upper/lower shadows. The small bodies reflect little change from open to close. The upper and lower shadows indicate movement during the day that...
READ MORE
MEMBERS ONLY
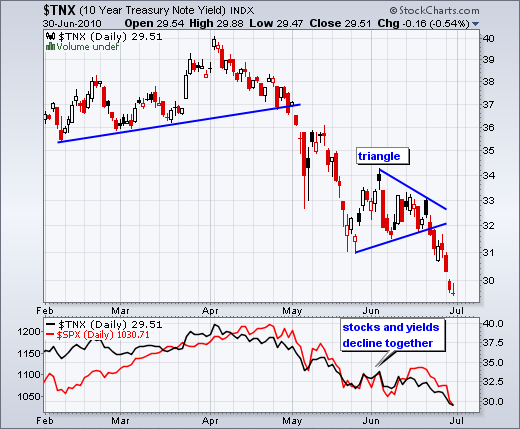
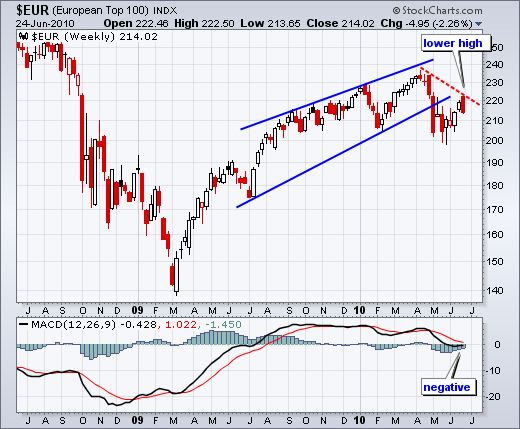
Negative MACD for Euro Top 100 Index
by Arthur Hill,
Chief Technical Strategist, TrendInvestorPro.com
The Euro Top-100 Index ($EUR) is forming a potentially lower high with bearish momentum. After a bounce in June, the index reversed course this week with an outside reversal well below the April high. MACD moved into negative territory in late May and remains in negative territory.
Click this image...
READ MORE
MEMBERS ONLY
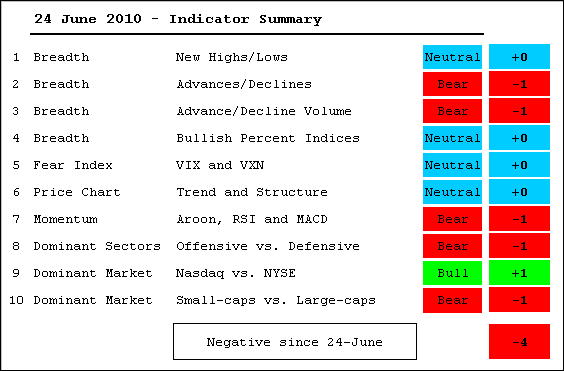
Indicator Summary flips back to negative
by Arthur Hill,
Chief Technical Strategist, TrendInvestorPro.com
There have been three changes in the last three weeks. The summary turned negative on 11-June, positive on 18-June and negative again on 24-June. Interpretation of these indicators is somewhat subjective. For instance, the NYSE AD Line appears to be forming a lower high with this week's sharp...
READ MORE
MEMBERS ONLY
SPY extends short-term downtrend
by Arthur Hill,
Chief Technical Strategist, TrendInvestorPro.com
The daily chart is looking rather ugly. It all started with Monday's reversal day near the 50% retracement. Selling pressure continued on Tuesday with a move below the resistance breakout. A little uncertainty surrounding the Fed announcement made for indecisive trading on Wednesday, but no gains were to...
READ MORE
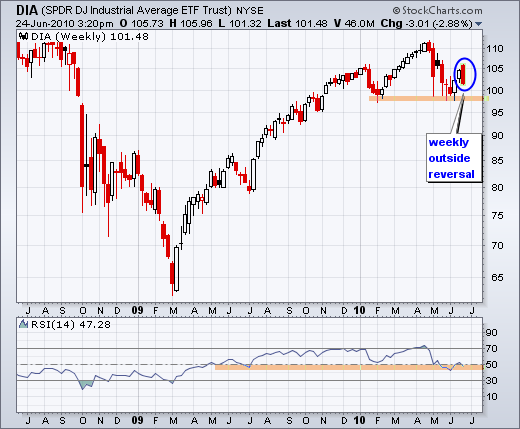
MEMBERS ONLY
A weekly outside reversal working for $DIA
by Arthur Hill,
Chief Technical Strategist, TrendInvestorPro.com
As of late Thursday afternoon, the Dow SPDR (DIA) was forming a weekly outside reversal. Notice how Monday's trading started above last week's close and is now below last week's open. This week's reversal has completely engulfed the prior white candlestick.
Click...
READ MORE
MEMBERS ONLY
SPY consolidates below support break
by Arthur Hill,
Chief Technical Strategist, TrendInvestorPro.com
On the daily chart, SPY failed to hold the breakout at 110.5 and remains below support from broken resistance. Is this just a pullback or the start of a bigger decline? Ideally, a pullback should be a little tamer. The sharp Monday-Tuesday reversal day is dominating the picture here....
READ MORE
MEMBERS ONLY
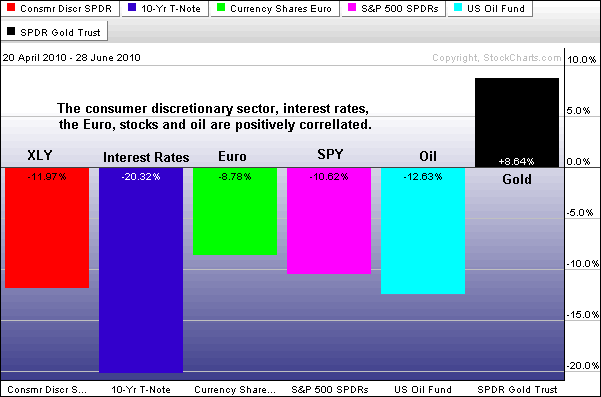
Markets turn defensive ahead of Fed
by Arthur Hill,
Chief Technical Strategist, TrendInvestorPro.com
The PerfChart below shows the performance for five intermarket related ETFs over the last two days. Stocks and the oil are down as money moved out of risk ahead of Wednesday's FOMC policy statement. Conversely, bonds, gold and the Dollar are up as money moved into relative safety....
READ MORE
MEMBERS ONLY
SPY breaks support ahead of FOMC
by Arthur Hill,
Chief Technical Strategist, TrendInvestorPro.com
Stocks took it on the chin Tuesday with big losses in the major index ETFs. The Russell 2000 ETF (IWM) and S&P 400 MidCap ETF (MDY) led the way lower with losses greater than 2%. All sectors were down with energy, materials, utilities, industrials and consumer discretionary losing...
READ MORE
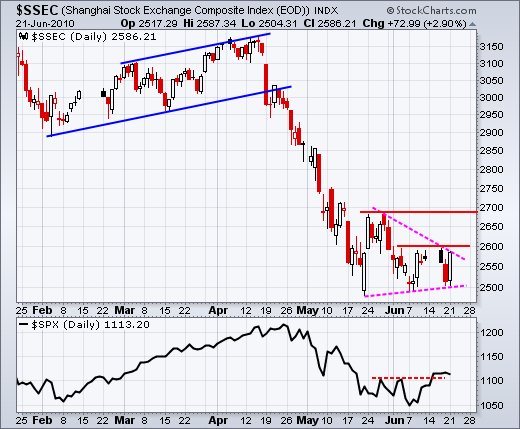
MEMBERS ONLY
Shanghai Composite remains relatively weak
by Arthur Hill,
Chief Technical Strategist, TrendInvestorPro.com
Despite a big bounce on Monday's currency news, the Shanghai Composite ($SSEC) remains within a trading range and continues to show relative weakness. After a sharp decline in April-May, the index formed a triangle consolidation around 2550. Watch these boundaries for the next directional clue. Also notice that...
READ MORE
MEMBERS ONLY
A wild day in the market
by Arthur Hill,
Chief Technical Strategist, TrendInvestorPro.com
It was a pretty crazy day on Wall Street - and in the rest of the markets. Stocks surged in early trading on news that China would allow the Yuan to strengthen for the first time since July 2005. Obviously, China is not in any hurry to let its currency...
READ MORE
MEMBERS ONLY
Yuan Fund surges to long-term moving average
by Arthur Hill,
Chief Technical Strategist, TrendInvestorPro.com
News that China adjusted its currency's peg to the Dollar sent the Chinese Yuan Fund (CYB) surging back above 25. While the three week move may seem impressive, the ETF is really just making it back to its 52-week average. In fact, the ETF spent most of 2009...
READ MORE
MEMBERS ONLY
SPY holds its breakout
by Arthur Hill,
Chief Technical Strategist, TrendInvestorPro.com
Stocks held their ground on Friday and most major indices ended with small gains, very small gains. Sectors were mixed with three down, five up and one unchanged (tech). Over the last two weeks, industrials and technology have been leading the market higher, but consumer discretionary and finance have been...
READ MORE
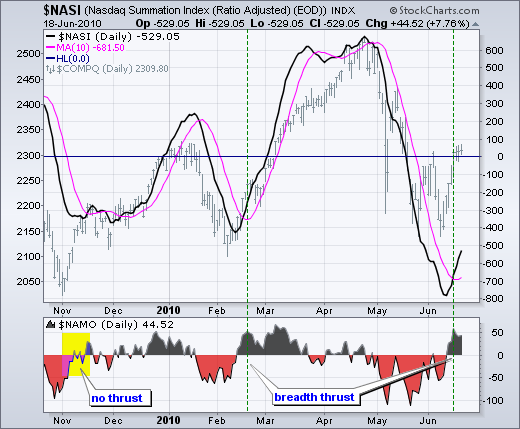
MEMBERS ONLY
A BREADTH THRUST FOR THE MCCLELLAN OSCILLATOR
by Arthur Hill,
Chief Technical Strategist, TrendInvestorPro.com
Before getting into this breadth thrust, let's review the McClellan Oscillator and McClellan Summation Index. Basically, the McClellan Oscillator is the 19-day EMA of Net Advances less the 39-day EMA of Net Advances (advances less declines). Like MACD, it is a momentum oscillator for Net Advances. The McClellan...
READ MORE
MEMBERS ONLY
Staples forms bearish engulfing
by Arthur Hill,
Chief Technical Strategist, TrendInvestorPro.com
Staples surged with the rest of the market over the prior seven days, but hit resistance from broken support with a bearish engulfing candlestick on Thursday. Also notice that the falling 200-day EMA and the 50% retracement mark.
Click this image for details...
READ MORE
MEMBERS ONLY
Indicator Summary flips positive
by Arthur Hill,
Chief Technical Strategist, TrendInvestorPro.com
After one week in negative territory, the indicator summary flipped back into positive territory on Friday, 18-June. The surge over the last eight days was strong enough to trigger a breakout in the NYSE AD Volume Line and pushed the 10-day SMA for NYSE Net New Highs into positive territory...
READ MORE
MEMBERS ONLY
Stocks eke out another gain
by Arthur Hill,
Chief Technical Strategist, TrendInvestorPro.com
Stocks traded mixed most of the day, but a late rally pushed the S&P 500, Nasdaq and Dow into positive territory for the close. The final gain was small though. In addition, the Russell 2000 and S&P 600 SmallCap Index both finished with small losses. Once...
READ MORE