MEMBERS ONLY
S&P 500 tests May lows
by Arthur Hill,
Chief Technical Strategist, TrendInvestorPro.com
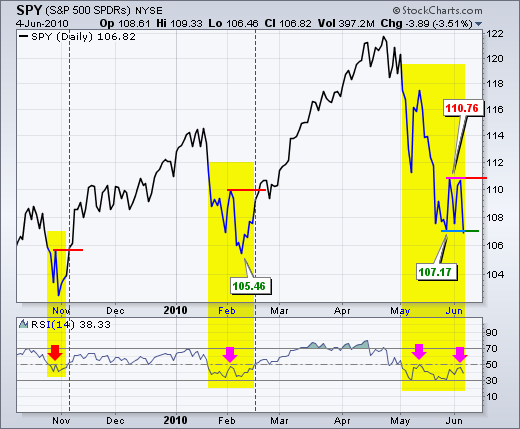
With a sharp decline early Tuesday, the S&P 500 is once again testing the May-June lows. In fact, this test also involves the February low. The 1040 level held in February, late May and early June. Can it handle another assault?
Click this image for a live...
READ MORE
MEMBERS ONLY
SPY forms triangle within downtrend
by Arthur Hill,
Chief Technical Strategist, TrendInvestorPro.com
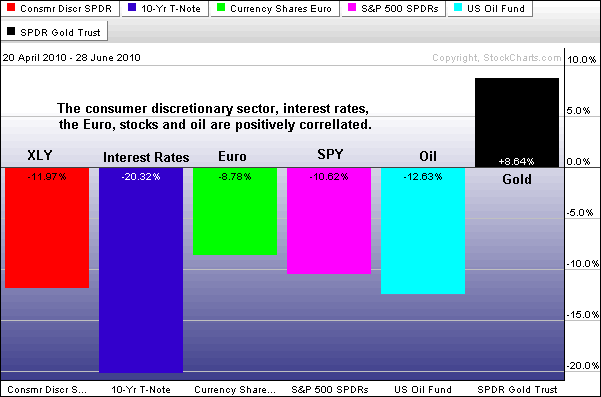
The demise of the consumer discretionary remains the most important event of the last few weeks. The Consumer Discretionary SPDR (XLY) was holding up fine in May, but came down hard in June and is the weakest of the eight sectors this month. Consumer discretionary is no ordinary sector. It...
READ MORE
MEMBERS ONLY
Gold ETF battles resistance
by Arthur Hill,
Chief Technical Strategist, TrendInvestorPro.com
For the second time in two weeks, the Gold ETF (GLD) surged above resistance at 122 and then moved back below with a long red candlestick. The overall uptrend in GLD remains in place, but there is considerable resistance in this area. First support is set at last week'...
READ MORE
MEMBERS ONLY
SPY forms spinning top near key retracement
by Arthur Hill,
Chief Technical Strategist, TrendInvestorPro.com
After a four day decline, SPY formed a big spinning top to establish a potential support zone around 107-108. These candlesticks have small bodies and long upper/lower shadows. The small bodies reflect little change from open to close. The upper and lower shadows indicate movement during the day...
READ MORE
MEMBERS ONLY
Negative MACD for Euro Top 100 Index
by Arthur Hill,
Chief Technical Strategist, TrendInvestorPro.com
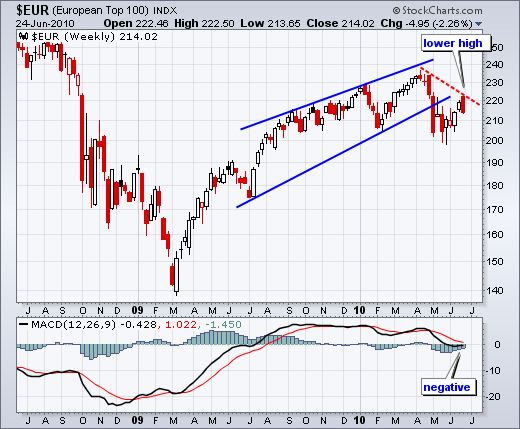
The Euro Top-100 Index ($EUR) is forming a potentially lower high with bearish momentum. After a bounce in June, the index reversed course this week with an outside reversal well below the April high. MACD moved into negative territory in late May and remains in negative territory.
Click this...
READ MORE
MEMBERS ONLY
Indicator Summary flips back to negative
by Arthur Hill,
Chief Technical Strategist, TrendInvestorPro.com
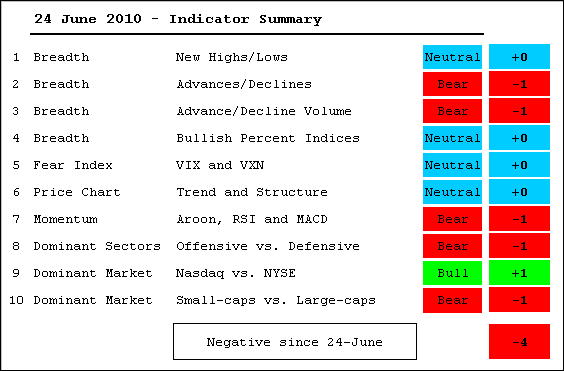
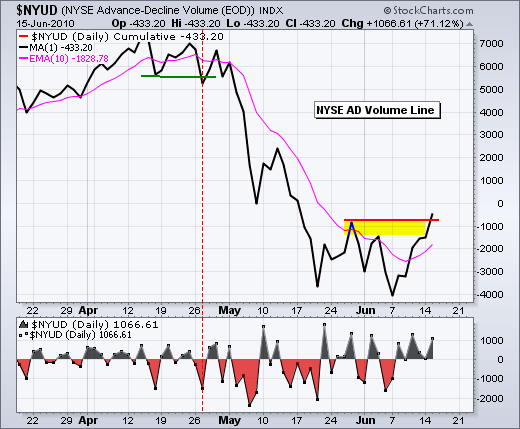
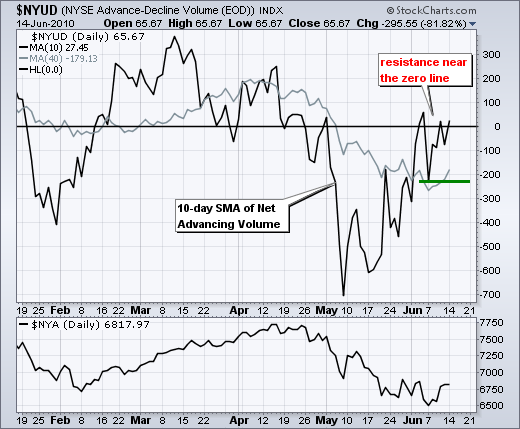
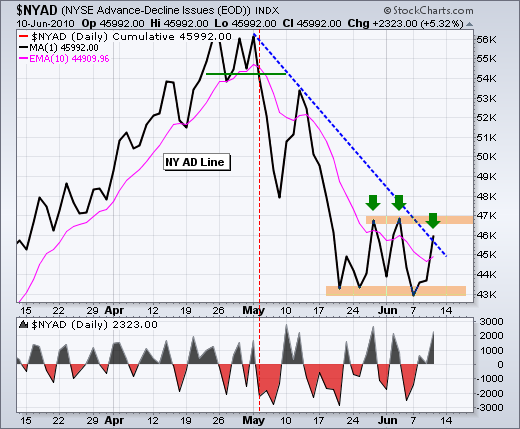
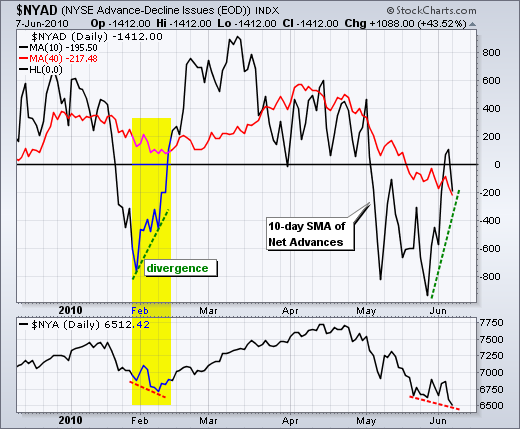
There have been three changes in the last three weeks. The summary turned negative on 11-June, positive on 18-June and negative again on 24-June. Interpretation of these indicators is somewhat subjective. For instance, the NYSE AD Line appears to be forming a lower high with this week&...
READ MORE
MEMBERS ONLY
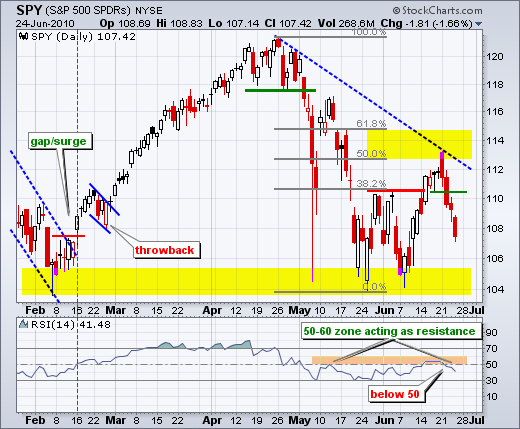
SPY extends short-term downtrend
by Arthur Hill,
Chief Technical Strategist, TrendInvestorPro.com
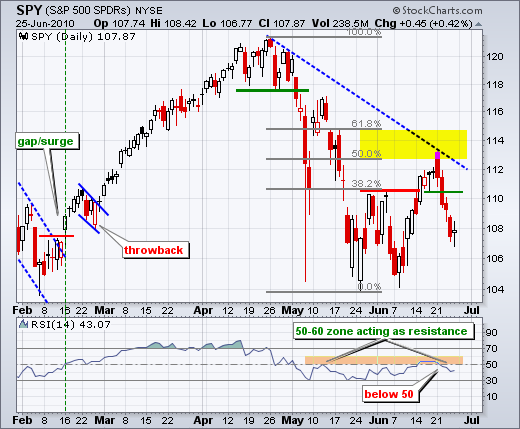
The daily chart is looking rather ugly. It all started with Monday's reversal day near the 50% retracement. Selling pressure continued on Tuesday with a move below the resistance breakout. A little uncertainty surrounding the Fed announcement made for indecisive trading on Wednesday, but no gains were to...
READ MORE
MEMBERS ONLY
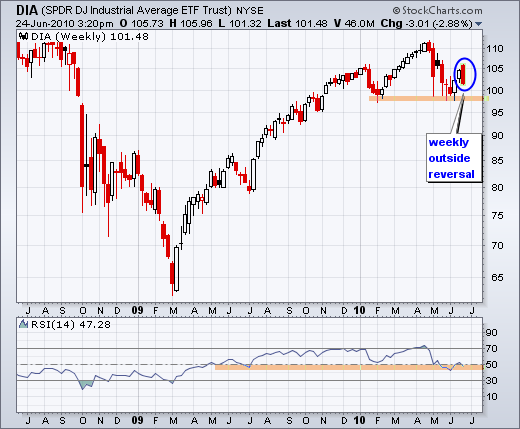
A weekly outside reversal working for $DIA
by Arthur Hill,
Chief Technical Strategist, TrendInvestorPro.com
As of late Thursday afternoon, the Dow SPDR (DIA) was forming a weekly outside reversal. Notice how Monday's trading started above last week's close and is now below last week's open. This week's reversal has completely engulfed the prior white candlestick.
Click...
READ MORE
MEMBERS ONLY
SPY consolidates below support break
by Arthur Hill,
Chief Technical Strategist, TrendInvestorPro.com
On the daily chart, SPY failed to hold the breakout at 110.5 and remains below support from broken resistance. Is this just a pullback or the start of a bigger decline? Ideally, a pullback should be a little tamer. The sharp Monday-Tuesday reversal day is dominating the picture...
READ MORE
MEMBERS ONLY
Markets turn defensive ahead of Fed
by Arthur Hill,
Chief Technical Strategist, TrendInvestorPro.com
The PerfChart below shows the performance for five intermarket related ETFs over the last two days. Stocks and the oil are down as money moved out of risk ahead of Wednesday's FOMC policy statement. Conversely, bonds, gold and the Dollar are up as money moved into relative safety....
READ MORE
MEMBERS ONLY
SPY breaks support ahead of FOMC
by Arthur Hill,
Chief Technical Strategist, TrendInvestorPro.com
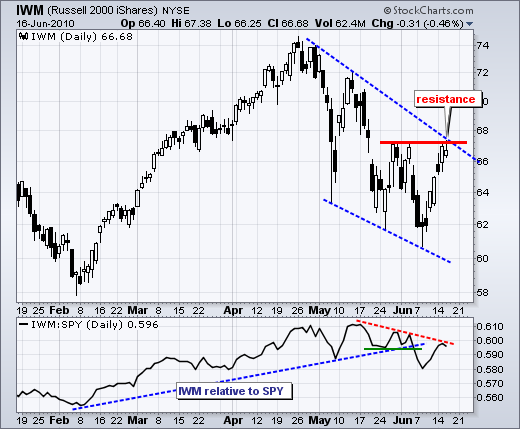
Stocks took it on the chin Tuesday with big losses in the major index ETFs. The Russell 2000 ETF (IWM) and S&P 400 MidCap ETF (MDY) led the way lower with losses greater than 2%. All sectors were down with energy, materials, utilities, industrials and consumer discretionary losing...
READ MORE
MEMBERS ONLY
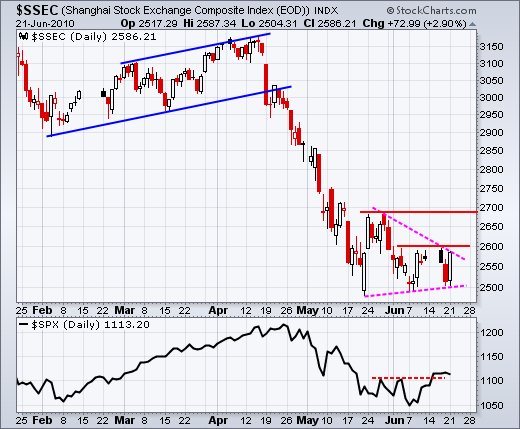
Shanghai Composite remains relatively weak
by Arthur Hill,
Chief Technical Strategist, TrendInvestorPro.com
Despite a big bounce on Monday's currency news, the Shanghai Composite ($SSEC) remains within a trading range and continues to show relative weakness. After a sharp decline in April-May, the index formed a triangle consolidation around 2550. Watch these boundaries for the next directional clue. Also notice...
READ MORE
MEMBERS ONLY
A wild day in the market
by Arthur Hill,
Chief Technical Strategist, TrendInvestorPro.com
It was a pretty crazy day on Wall Street - and in the rest of the markets. Stocks surged in early trading on news that China would allow the Yuan to strengthen for the first time since July 2005. Obviously, China is not in any hurry to let its currency rise....
READ MORE
MEMBERS ONLY
Yuan Fund surges to long-term moving average
by Arthur Hill,
Chief Technical Strategist, TrendInvestorPro.com
News that China adjusted its currency's peg to the Dollar sent the Chinese Yuan Fund (CYB) surging back above 25. While the three week move may seem impressive, the ETF is really just making it back to its 52-week average. In fact, the ETF spent most of...
READ MORE
MEMBERS ONLY
SPY holds its breakout
by Arthur Hill,
Chief Technical Strategist, TrendInvestorPro.com
Stocks held their ground on Friday and most major indices ended with small gains, very small gains. Sectors were mixed with three down, five up and one unchanged (tech). Over the last two weeks, industrials and technology have been leading the market higher, but consumer discretionary and finance have been...
READ MORE
MEMBERS ONLY
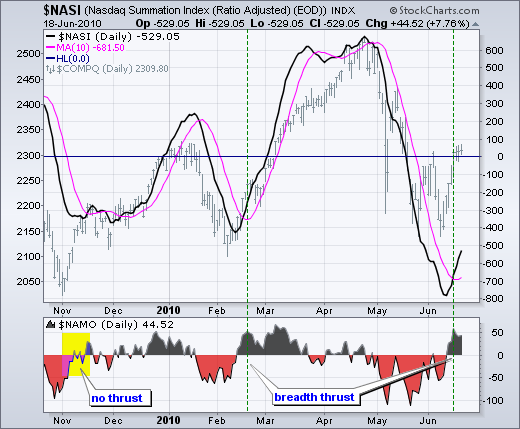
A BREADTH THRUST FOR THE MCCLELLAN OSCILLATOR
by Arthur Hill,
Chief Technical Strategist, TrendInvestorPro.com
Before getting into this breadth thrust, let's review the McClellan Oscillator and McClellan Summation Index. Basically, the McClellan Oscillator is the 19-day EMA of Net Advances less the 39-day EMA of Net Advances (advances less declines). Like MACD, it is a momentum oscillator for Net Advances....
READ MORE
MEMBERS ONLY
Staples forms bearish engulfing
by Arthur Hill,
Chief Technical Strategist, TrendInvestorPro.com
Staples surged with the rest of the market over the prior seven days, but hit resistance from broken support with a bearish engulfing candlestick on Thursday. Also notice that the falling 200-day EMA and the 50% retracement mark.
Click this image for details...
READ MORE
MEMBERS ONLY
Indicator Summary flips positive
by Arthur Hill,
Chief Technical Strategist, TrendInvestorPro.com
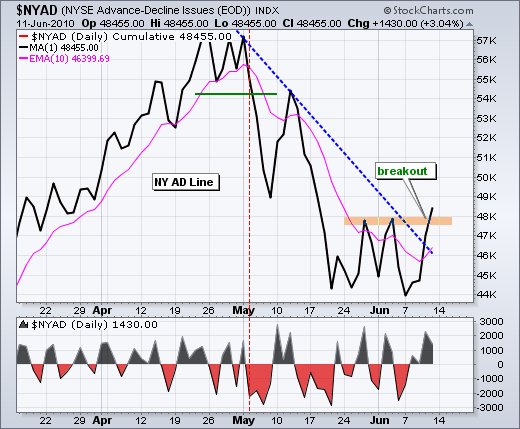
After one week in negative territory, the indicator summary flipped back into positive territory on Friday, 18-June. The surge over the last eight days was strong enough to trigger a breakout in the NYSE AD Volume Line and pushed the 10-day SMA for NYSE Net New Highs into...
READ MORE
MEMBERS ONLY
Stocks eke out another gain
by Arthur Hill,
Chief Technical Strategist, TrendInvestorPro.com
Stocks traded mixed most of the day, but a late rally pushed the S&P 500, Nasdaq and Dow into positive territory for the close. The final gain was small though. In addition, the Russell 2000 and S&P 600 SmallCap Index both finished with small losses. Once...
READ MORE
MEMBERS ONLY
GE forms rising flag near support
by Arthur Hill,
Chief Technical Strategist, TrendInvestorPro.com
GE is trying to bounce off its February low, but the bounce look feeble so far and the stock shows relative weakness. The stock shows relative weakness because the S&P 500 broke above resistance and GE remains below corresponding resistance. The support zone around 15-15.5 is...
READ MORE
MEMBERS ONLY
Market turns mixed after big advance
by Arthur Hill,
Chief Technical Strategist, TrendInvestorPro.com
After a big advance the prior six days, trading turned mixed as the market consolidated its gains. Over the last seven days, IWM is up 7.74%, MDY is up 7.2%, QQQQ is up 6.13%, SPY is up 5.01% and DIA is up 4.88%. Even though...
READ MORE
MEMBERS ONLY
Apple challenges resistance
by Arthur Hill,
Chief Technical Strategist, TrendInvestorPro.com
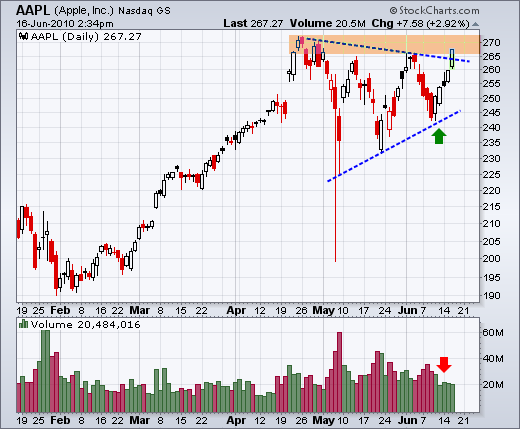
Apple (AAPL) remains one of the strongest stocks as it surges to resistance from the April-June highs. The stock formed a triangle over the last 2-3 months and broke the upper trendline today. Volume was light though. QQQQ traders should note that Apple accounts for 18.84% of...
READ MORE
MEMBERS ONLY
Breakouts and resistance challenges
by Arthur Hill,
Chief Technical Strategist, TrendInvestorPro.com
Stocks surged on Tuesday with the major index ETFs gaining over 2%. The gains were rather uniform with a range from 2.27% in the S&P 100 to 2.82% in the Nasdaq 100. Even though the Nasdaq and Russell 2000 gained more than the S&P...
READ MORE
MEMBERS ONLY
Airline Index closes in on 52-week high
by Arthur Hill,
Chief Technical Strategist, TrendInvestorPro.com
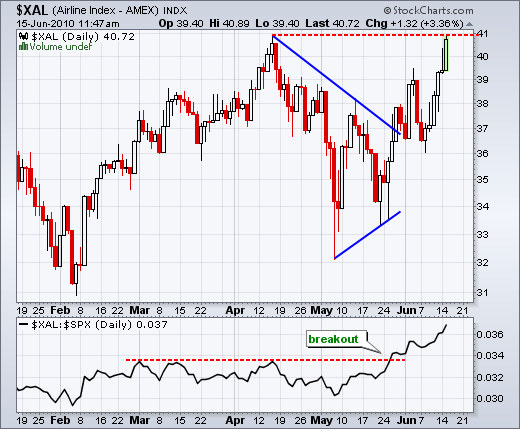
Airlines continue to show relative strength and upside leadership. First, the Airline Index ($XAL) is challenging its April high with a big move on Tuesday. A break would forge a new 52-week high. Second, the price relative broke out in late May and recorded a new high this week....
READ MORE
MEMBERS ONLY
Selling pressure at resistance
by Arthur Hill,
Chief Technical Strategist, TrendInvestorPro.com
Trading turned mixed as the Dow and S&P 500 tested important resistance levels. The S&P 500 and Nasdaq finished with small gains, but the Dow and Nasdaq 100 finished with small losses. The Russell 2000 and S&P 400 Midcap Index closed with modest gains...
READ MORE
MEMBERS ONLY
Commodities follow stocks
by Arthur Hill,
Chief Technical Strategist, TrendInvestorPro.com
With the exception of precious metals, commodity indices have gone the way of the stock market over the last eight weeks. The PerfChart below shows the S&P 500 six commodity related indices. Only the GSCI Precious Metals Index ($GPX) shows a gain since mid April.
Click this image...
READ MORE
MEMBERS ONLY
SPY surges off support
by Arthur Hill,
Chief Technical Strategist, TrendInvestorPro.com
The surge over the last two days did not occur on the strongest breadth or volume, but support from the February low held and the bigger uptrend remains in place. As long as the bigger trend is up, the odds favor the bulls as SPY surges off support. Selling pressure...
READ MORE
MEMBERS ONLY
A lot of fill black candlesticks
by Arthur Hill,
Chief Technical Strategist, TrendInvestorPro.com
Looking through the pre-defined scans page, it was surprising to see a high number of filled black candlesticks on Thursday. These candlesticks form when the close is below the open and the close is above the prior close. Even though the stock closed up for the day, the stock...
READ MORE
MEMBERS ONLY
Indicator Summary turns negative
by Arthur Hill,
Chief Technical Strategist, TrendInvestorPro.com
Small-caps broke down this week and the Bullish Percent Index indicator turned bearish. These two were enough to turn the indicator summary negative for the first time since March 5th. Techs were also hit hard this week, but the $COMPQ:$NYA ratio remains in an uptrend. In addition, the...
READ MORE
MEMBERS ONLY
SPY gaps and closes strong
by Arthur Hill,
Chief Technical Strategist, TrendInvestorPro.com
Stocks surged with a broad rally that lifted most boats. All major indices were up 3% or so. The Russell 2000 (+3.48%) slightly outperformed the S&P 500 (+2.95%). The Russell 2000 should have been up 5% on a day like today (damper number 1). All sectors...
READ MORE
MEMBERS ONLY
Bullish Percent Indices below 50%
by Arthur Hill,
Chief Technical Strategist, TrendInvestorPro.com
Stockcharts.com tracks the Bullish Percent Indices (BPI) for six major indices and 10 sectors. The BPIs for the major indices are below 50% and eight of the ten sectors have BPIs below 50%. Only telecom and utilities have BPIs above 50%. These numbers can be found at the bottom...
READ MORE
MEMBERS ONLY
Stocks give back their gains
by Arthur Hill,
Chief Technical Strategist, TrendInvestorPro.com
Stocks surged in early trading with SPY moving above 108 in the morning, but gave back these gains, and more, with an afternoon plunge. There it is again: another late round of selling pressure. A lack of buying pressure and a small increase in selling pressure is all it takes...
READ MORE
MEMBERS ONLY
Dow breaks Ichimoku cloud
by Arthur Hill,
Chief Technical Strategist, TrendInvestorPro.com
Ichimoku Clouds, a form of Japanese technical analysis, show a trend reversal in the Dow Industrials. The senior average broke below the cloud formation and the "Standard Line" moved below the cloud formation. This is the red line, which is a moving average of the 26-day high-...
READ MORE
MEMBERS ONLY
A lopsided bounce
by Arthur Hill,
Chief Technical Strategist, TrendInvestorPro.com
The stock market rebounded on Tuesday, but the bounce was rather lopsided as techs lagged significantly. The S&P 500 and the Dow gained over 1%, but the Nasdaq and Russell 2000 finished slightly negative. Small-caps and techs are starting to show relative weakness and this is not...
READ MORE
MEMBERS ONLY
VIX bounces off support
by Arthur Hill,
Chief Technical Strategist, TrendInvestorPro.com
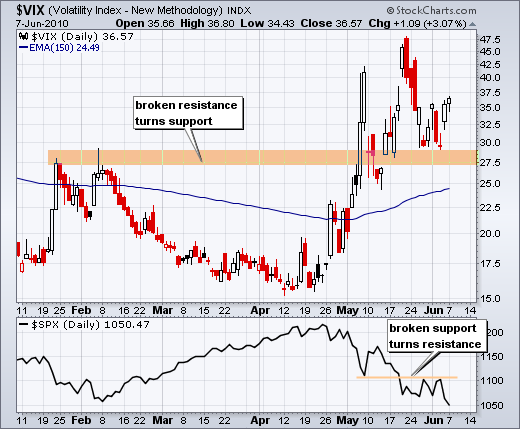
The S&P 500 Volatility Index ($VIX) surged in May and broke above its January-February high. After a pullback, the index found support near broken resistance and bounced the last few days. Also notice that the S&P 500 hit resistance near broken support.
Click this image...
READ MORE
MEMBERS ONLY
Oversold and near the Feb low
by Arthur Hill,
Chief Technical Strategist, TrendInvestorPro.com
It was another day of heavy selling pressure, but not as heavy as Friday. The AD Lines and AD Volume Lines for the Nasdaq and NYSE all moved to new lows for the move. Even with these new lows, selling pressure is less than it was in May. The first...
READ MORE
MEMBERS ONLY
An evening star for IBM
by Arthur Hill,
Chief Technical Strategist, TrendInvestorPro.com
With a short-term reversal in stocks over the last three days, the evening star scan was about as full as it's been in a long time. IBM formed an evening star with a long white candlestick on Wednesday, a gap-stall on Thursday and a gap-decline...
READ MORE
MEMBERS ONLY
SPY fails at resistance
by Arthur Hill,
Chief Technical Strategist, TrendInvestorPro.com
Stocks were hit hard on Friday with the major indices losing 3-5%. The Dow held up the best with a 3.15% loss, while the Russell 2000 fared the worst with a 5% loss. Stocks started with a sharp gap down and continued lower throughout the day. Buyers were...
READ MORE
MEMBERS ONLY
RSI remains bearish for SPY
by Arthur Hill,
Chief Technical Strategist, TrendInvestorPro.com
The Relative Strength Index remains below 50 and bearish for the S&P 500 ETF (SPY). Bounded momentum oscillators trade within a defined range. RSI trades between zero and one hundred with fifty as the centerline. Think of this level as the 50 yard line in a football game....
READ MORE
MEMBERS ONLY
XLY and XLK show relative strength
by Arthur Hill,
Chief Technical Strategist, TrendInvestorPro.com
The sector perfchart provides an easy means to identify the leaders and laggards. Even though all sectors are down over the last three weeks (since May 13), some are down more than the S&P 500 (laggards) and some are down less (leaders). It is positive to see the...
READ MORE