MEMBERS ONLY
Micron Fails at Break Zone
by Arthur Hill,
Chief Technical Strategist, TrendInvestorPro.com
A basic concept of technical analysis is that broken support turns into future resistance. This concept is proving true for Micron (MU) as it returned to broken support in April and backed off the last two weeks.
The chart shows MU breaking down with a support break in September and...
READ MORE
MEMBERS ONLY
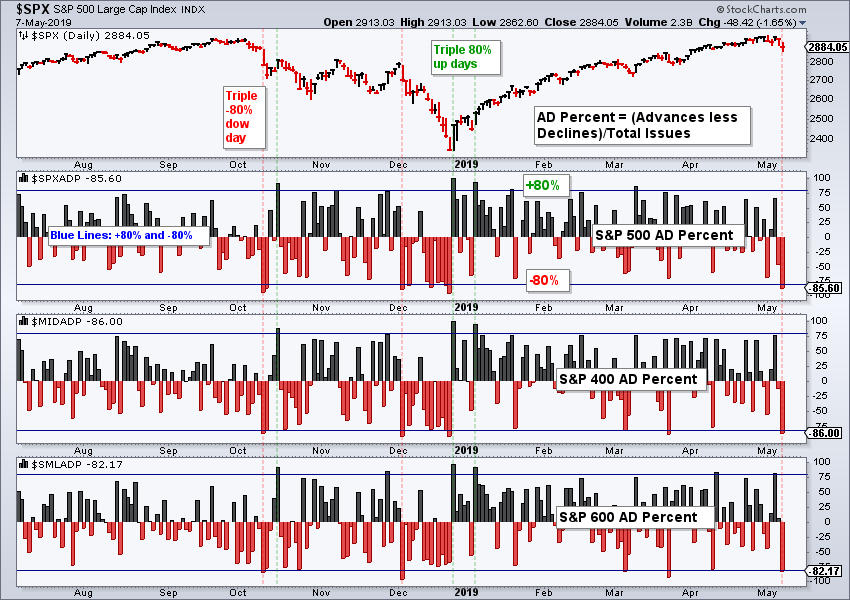
A Shot Across the Bow with a Triple 90% Down Day - What to Watch Next
by Arthur Hill,
Chief Technical Strategist, TrendInvestorPro.com
Triple 90% Down Day
It is way too early to call for a major top, but we do have a short-term breadth signal that points to further downside. The chart below shows AD Percent for the S&P 500, S&P Mid-Cap 400 and S&P Small-Cap...
READ MORE
MEMBERS ONLY
Ebay Holds the Gap and the Break
by Arthur Hill,
Chief Technical Strategist, TrendInvestorPro.com
Ebay (EBAY) reversed its downtrend with a reversal pattern and break above the 200-day SMA in late January and early February. After digesting its gains with a corrective pattern in March-April the stock broke out again with a gap and appears headed higher.
The stock formed a rare island reversal...
READ MORE
MEMBERS ONLY
Improving the Best Six Months Strategy by Adding Months and Timing
by Arthur Hill,
Chief Technical Strategist, TrendInvestorPro.com
The "Best Six Months" strategy suggests that the best time to own stocks is from November to April, and the worst time is from May to October. Testing over the last 25 years confirms the performance differences between these two periods, but this strategy still leaves money on...
READ MORE
MEMBERS ONLY
Docusign Breaks from Consolidation Pattern
by Arthur Hill,
Chief Technical Strategist, TrendInvestorPro.com
Docusign (DOCU), a company that provides e-signature solutions, started trading on August 27th and surged over 30% on its IPO. The stock advanced another 65% after this initial gain and then fell back to the IPO price in October. Notice that the six month lockup period ended on October 24th...
READ MORE
MEMBERS ONLY
Palo Alto Readies for its Next Move
by Arthur Hill,
Chief Technical Strategist, TrendInvestorPro.com
Palo Alto Networks (PANW) is a leading cyber-security stock that fits into the technology sector. Needless to say, the Technology SPDR (XLK) and the EW Technology ETF (RYT) are the leading sectors here in 2019. PANW took a break with a consolidation over the last eight weeks, and this could...
READ MORE
MEMBERS ONLY
Weekly Market Review & Outlook - 3000 and then What?
by Arthur Hill,
Chief Technical Strategist, TrendInvestorPro.com
* S&P 500 Reaches 2018 Highs.
* Watch the Immediate Uptrend.
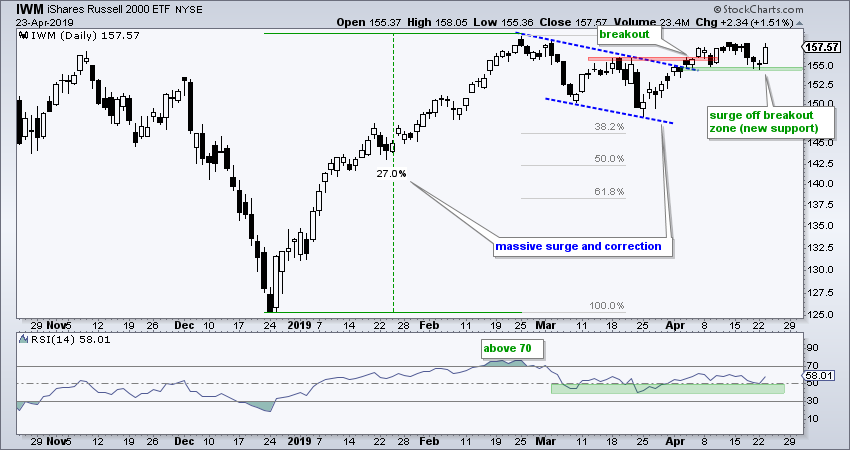
* IWM Holds Flag Breakout.
* Small-caps Breadth Indicators Net Bearish.
* %Above 200-day EMA Hits Milestone for XLF.
* Utilities Correct within Bigger Uptrend.
* Stock Performance During Earnings Season.
* ChartList Updates.
* About the Art's Charts ChartList.
... S&P 500...
READ MORE
MEMBERS ONLY
Can IWM Follow Through on Bounce? - ChartList Update
by Arthur Hill,
Chief Technical Strategist, TrendInvestorPro.com
* Cup-with-handle Taking Shape in IWM.
* Bond ETFs Reach Potential Reversal Zone.
* Art's Charts ChartList Update (SMTC added).
Art's Charts featured IWM on Monday with a bullish chart and a lagging price. Even though IWM remains well below its September highs, the ETF broke out of a...
READ MORE
MEMBERS ONLY
COUP Flies the Flag after Big Gain
by Arthur Hill,
Chief Technical Strategist, TrendInvestorPro.com
Coupa Software is one of the best performing stocks in 2019 with a 50% advance year-to-date. In addition, the stock is up over 80% from its late December low. Too far too fast you might say? Perhaps, but the stock digested its gains with a consolidation the last two months...
READ MORE
MEMBERS ONLY
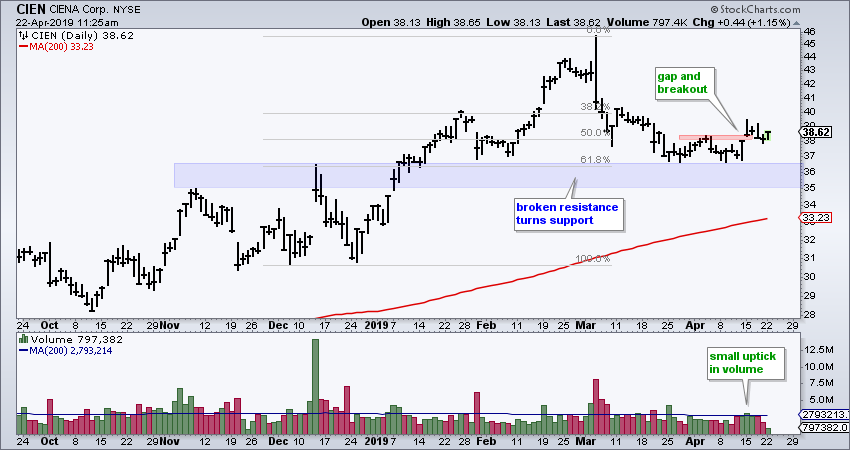
Ciena Hits Potential Reversal Zone
by Arthur Hill,
Chief Technical Strategist, TrendInvestorPro.com
The ideal scenario for traders is to buy after a pullback for a good reward-to-risk ratio. When the long-term trend is up, I look for indications of support and signs that an upturn is in the making. The chart for Ciena sports a classic setup with a confluence of indicators...
READ MORE
MEMBERS ONLY
Small-caps Lag, but Large-caps Keep Market Bullish - ChartList Update
by Arthur Hill,
Chief Technical Strategist, TrendInvestorPro.com
* Small-caps Continue to Lag.
* S&P 500 Nears All Time High.
* IWM Tests Breakout Zone.
* Index Breadth Table Update.
* Industrials and Finance Come to Life.
* Art's Charts ChartList Update.
Back in the Saddle
After a vacation and market hiatus, today's commentary will review the broader...
READ MORE
MEMBERS ONLY
Using Breadth Indicators to Weigh the Evidence
by Arthur Hill,
Chief Technical Strategist, TrendInvestorPro.com
This article will provide links and symbols for some of the charts used in the On Trend episode focusing on breadth indicators (Using Breadth Indicators to Weigh the Evidence). Episode details are shown below and you can watch a recording on our Youtube channel. The idea behind these indicators is...
READ MORE
MEMBERS ONLY
Finding, Tracking and Analyzing Growth Stocks
by Arthur Hill,
Chief Technical Strategist, TrendInvestorPro.com
Learning about and tracking growth stocks in unique industry groups is an ongoing process that can help traders and investors outperform the broader market. This article will provide links to some of the resources from the On Trend episode focusing on growth stocks (Finding, Tracking and Analyzing Growth Stocks). A...
READ MORE
MEMBERS ONLY
RSI for Trend-Momentum Strategies
by Arthur Hill,
Chief Technical Strategist, TrendInvestorPro.com
This post will provide a resource link and scan code from the On Trend episodes focusing on RSI for trend-following and momentum strategies. This is a two-part series that goes from RSI basics to a twenty year backtest on stocks in the S&P 500. These episodes will show...
READ MORE
MEMBERS ONLY
RSI Shifts from Bearish to Bullish for EEM
by Arthur Hill,
Chief Technical Strategist, TrendInvestorPro.com
The Emerging Markets ETF (EEM) experienced a trend-momentum shift over the last few months as RSI moved from its bear range to its bull range. In addition, RSI came close to 70 (69.5) twice and EEM broke above its 200-day SMA. The downtrend reversed and I expect higher prices...
READ MORE
MEMBERS ONLY
Is there a Biotech Breakout in the Making?
by Arthur Hill,
Chief Technical Strategist, TrendInvestorPro.com
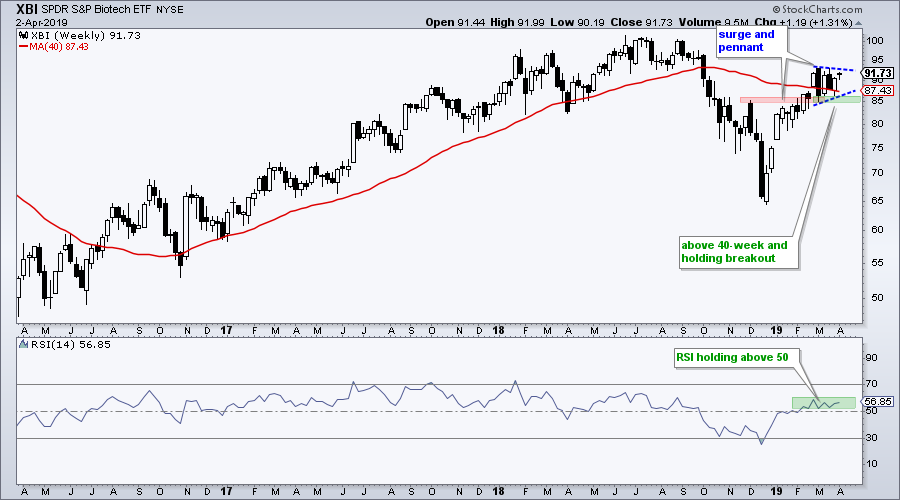
The Biotech SPDR (XBI) is trading at a make-or-break point as it consolidates near the 40-week SMA. Traders should watch for the resolution of this consolidation because it will dictate the next directional move.
The chart below shows XBI surging from the mid 60s to the lower 90s and then...
READ MORE
MEMBERS ONLY
AT&T Makes a Break for It
by Arthur Hill,
Chief Technical Strategist, TrendInvestorPro.com
AT&T (T) was one of the worst performing stocks in 2018 with a 20% decline and 52-week low in late December. 2019 is starting out much better with a double-digit gain and a break above the November-February highs, which also mark neckline resistance of an inverse head-and-shoulders pattern....
READ MORE
MEMBERS ONLY
Weekly Market Review & Outlook - It is What it Is
by Arthur Hill,
Chief Technical Strategist, TrendInvestorPro.com
* S&P 500 Stalls within Uptrend.
* Upswing Dominates Weekly SPX Chart.
* Index Breadth Table Remains Bullish.
* IJR: Failure at 200-day or Mere Correction?
* Sector Table - Staples Get a Lift.
* XLI Hits Make-or-break Zone.
* UTX Consolidates around the 200-day.
* MMM Consolidates above 200-day.
* Palladium Takes a Tumble.
* ChartList Updates....
READ MORE
MEMBERS ONLY
Bull, Bear or Neither? - Plus ChartList Update
by Arthur Hill,
Chief Technical Strategist, TrendInvestorPro.com
* S&P 500 Holds as Russell Rolls Over.
* Plenty of New Highs in $SPX.
* ChartList Updates - 3 Additions.
Are we in a bull market, a bear market or neither? At this point, the evidence is still more bullish than bearish, but there are clearly some pockets of weakness...
READ MORE
MEMBERS ONLY
TJX Bucks the Selling Pressure
by Arthur Hill,
Chief Technical Strategist, TrendInvestorPro.com
TJX Companies (TJX) is part of the S&P 500 and the Consumer Discretionary SPDR (XLY). It is also part of two growth ETFs (PWB and PXLG). Even though TJX is part of an economically sensitive sector, I would put them in a different category because they are known...
READ MORE
MEMBERS ONLY
RSI Bear Ranges for S&P 500 and Russell 2000 - ChartList Update
by Arthur Hill,
Chief Technical Strategist, TrendInvestorPro.com
* RSI Holds Bear Range for S&P 500
* A Classical Reversal Area for Russell 2000
* Small-cap Breadth Indicators Flip
* Selling Pressure in Key Groups
* ChartList Updates
RSI Holds Bear Range for S&P 500
The S&P 500 remains above its slightly rising 40-week SMA, but this...
READ MORE
MEMBERS ONLY
Weekly Market Review & Outlook - Crosscurrents, Undercurrents and Weight of the Evidence
by Arthur Hill,
Chief Technical Strategist, TrendInvestorPro.com
* Bigger Downtrends or Simply Resting?
* Bank ETFs Fail at 200-day SMAs.
* Small-cap Indexes Fail near Retracements.
* Oil Nears Potential Reversal Zone.
* Focus on the True Leaders.
* S&P 500 Maintains Uptrend.
* Index Breadth Table Remains Bullish.
* Sector Breadth Table is More Mixed.
* Staples, Utilities, REITs and Tech.
* Bonds Extend...
READ MORE
MEMBERS ONLY
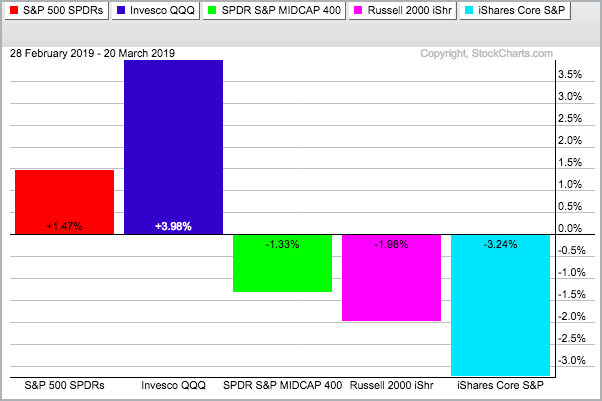
March Turns Rough for Small and Mid Caps
by Arthur Hill,
Chief Technical Strategist, TrendInvestorPro.com
The Russell 2000 iShares (IWM) is not only lagging the S&P 500 SPDR (SPY) and the Nasdaq 100 ETF (QQQ) in March, but it is also under selling pressure and down month-to-date. Typically, I am not concerned with relative weakness in small-caps when they are simple up less...
READ MORE
MEMBERS ONLY
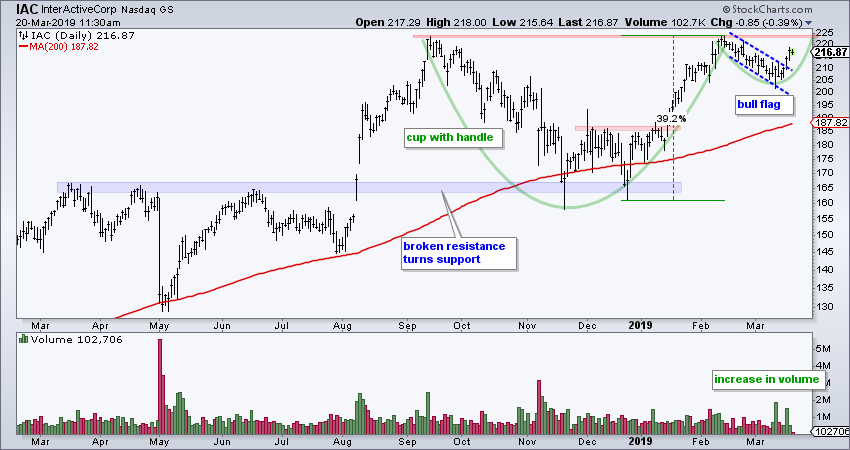
Trading the Pattern within the Pattern
by Arthur Hill,
Chief Technical Strategist, TrendInvestorPro.com
There are often smaller patterns within larger patterns and traders can get a jump on a bigger breakout by acting on the smaller pattern first. For example, a cup-with-handle is a bullish continuation pattern that typically forms over a few months. A falling flag is also a bullish continuation pattern,...
READ MORE
MEMBERS ONLY
Third Time Lucky for Advance Auto Parts?
by Arthur Hill,
Chief Technical Strategist, TrendInvestorPro.com
Advance Auto Parts (AAP) hit a new high in November and then moved into a corrective phase. Keep in mind that a correction can involve a decline or a consolidation, or even a combination of the two. AAP fell back towards the rising 200-day SMA in December and then stalled...
READ MORE
MEMBERS ONLY
Amazon Makes a Threat
by Arthur Hill,
Chief Technical Strategist, TrendInvestorPro.com
Amazon is lagging the Nasdaq 100 ETF (QQQ) and the broader market over the last two months because it has yet to clear its January high and remains below the 200-day SMA. This is part of the reason the Invesco Momentum ETF (SPMO) is underperforming the Invesco Minimum Volatility ETF...
READ MORE
MEMBERS ONLY
Party Like it's 1999
by Arthur Hill,
Chief Technical Strategist, TrendInvestorPro.com
Anyone recognize these two phones? A good old indestructible Nokia candy bar was the first phone for many of us. I had a few Nokia cellphones over the years and they always worked great, back in the day. And, we all remember the Nokia ring tone, which was the most...
READ MORE
MEMBERS ONLY
Weekly Market Review & Outlook - Large-caps Take the Lead
by Arthur Hill,
Chief Technical Strategist, TrendInvestorPro.com
* 20-day Holds above 200-day for S&P 500
* Weekly RSI Holds above 50.
* Large-caps Lead Index Breadth.
* Tech, Utilities and REITs Lead Sector Breadth.
* The Dreaded Shakeout (VRTX).
* Consider Position Sizing (SCWX).
* Consider Profit Targets (PYPL).
* ChartList Updates.
... 20-day Holds above 200-day
... The S&P 500 sneezed last...
READ MORE
MEMBERS ONLY
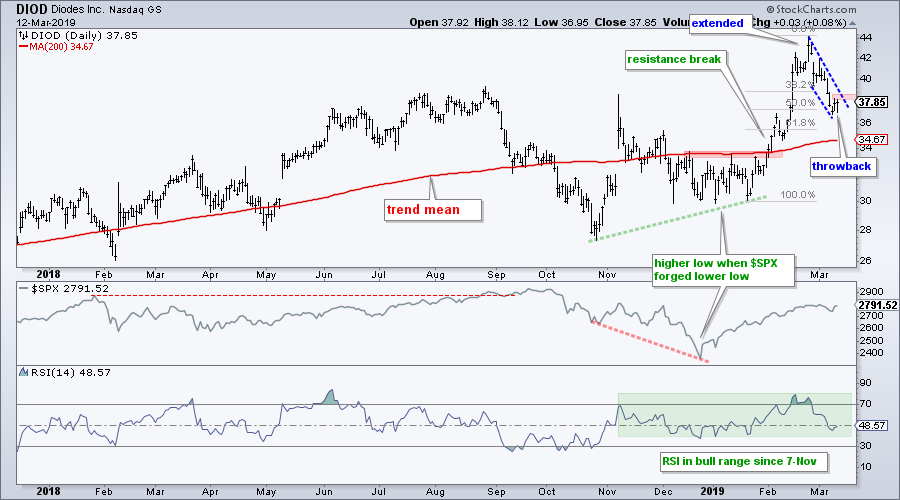
Diodes Returns to the Trend Mean
by Arthur Hill,
Chief Technical Strategist, TrendInvestorPro.com
Diodes (DIOD), a semiconductor stock, is returning to the trend mean and this could provide a bullish setup to take part in the long-term uptrend.
The chart below shows DIOD with a breakout and surge to new highs in February. Note that the stock also recorded new highs in autumn...
READ MORE
MEMBERS ONLY
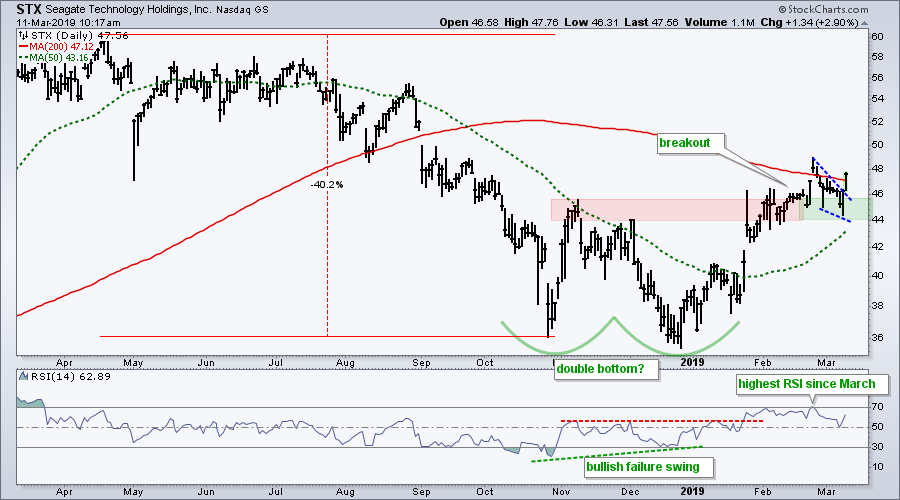
Seagate Rises from the Ashes
by Arthur Hill,
Chief Technical Strategist, TrendInvestorPro.com
Seagate Technology was one of the weakest tech stocks in 2018 as it fell around 40% from the April high to the October low. Things appear to be turning about here in 2019 as stock finds its footing and triggers two breakouts.
The chart below shows STX with two lows...
READ MORE
MEMBERS ONLY
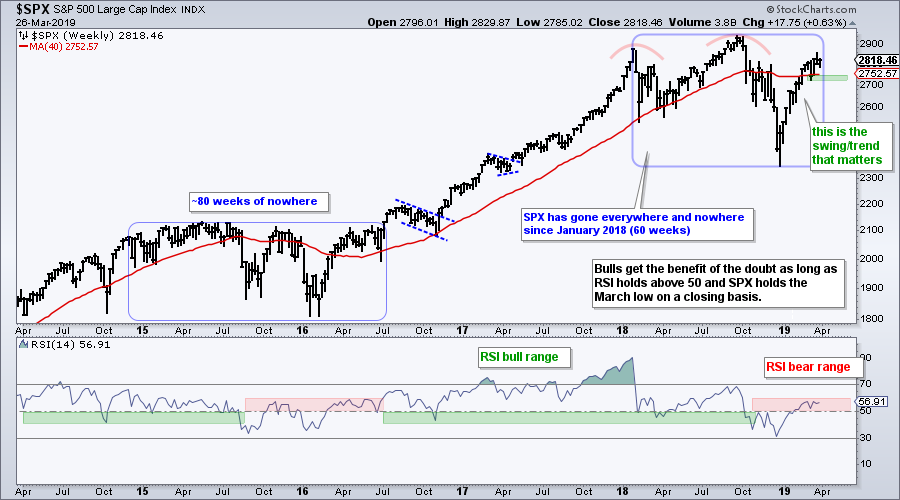
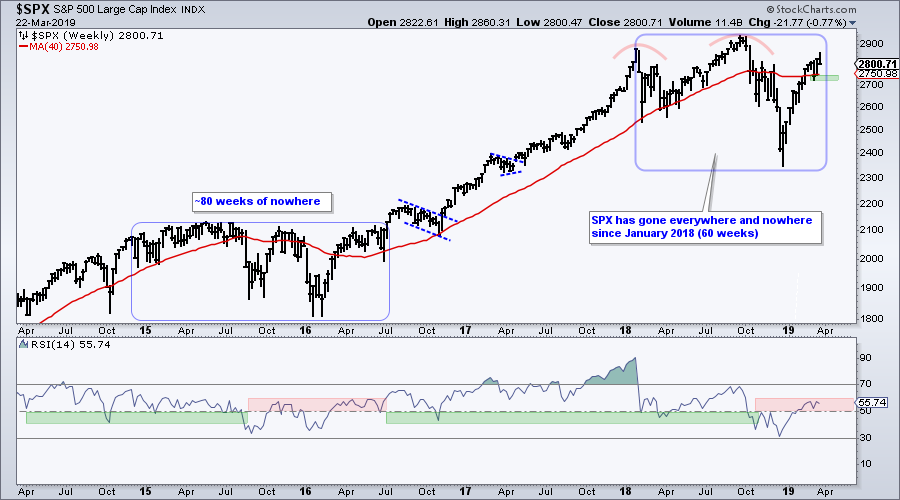
Weekly Market Review & Outlook - Everywhere and Nowhere for SPX
by Arthur Hill,
Chief Technical Strategist, TrendInvestorPro.com
* The First Pullback of the Year.
* A Big Drawn-out Range.
* Index Breadth Table Update.
* Sector Table Update.
* Finance Fails below November High.
* Retail and Banks Get Pummeled.
* A Bullish Continuation for Bonds.
* ChartList Updates.
... The First Pullback of the Year
... The S&P 500 fell the last four days...
READ MORE
MEMBERS ONLY
Tilray Goes from Most Exciting to Most Boring
by Arthur Hill,
Chief Technical Strategist, TrendInvestorPro.com
Tilray (TLRY) listed on the Nasdaq at $17 with an IPO in July and promptly surged above $300. The stock then worked its way below 100 over the next few months and managed to stabilize in the 65 to 80 zone this year.
The chart below shows the Bollinger Bands...
READ MORE
MEMBERS ONLY
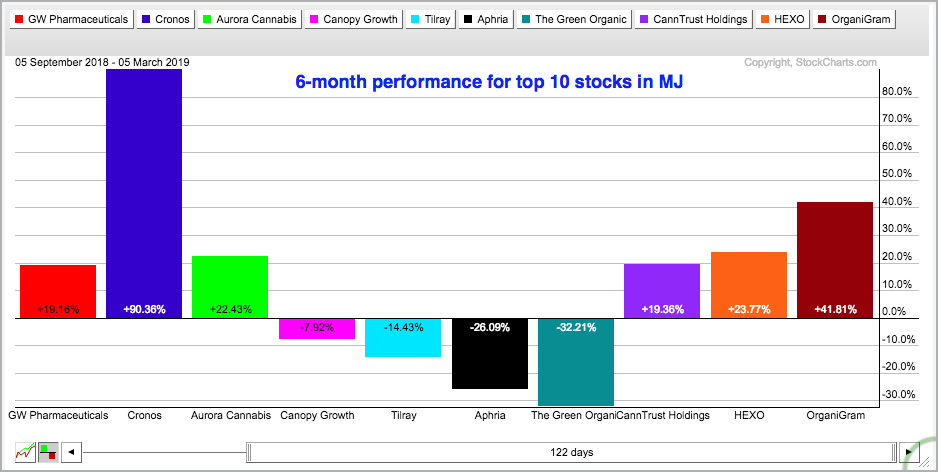
Are Cannabis Stocks Poised to Go Higher?
by Arthur Hill,
Chief Technical Strategist, TrendInvestorPro.com
Sorry, I could not resist that title. Today's commentary will focus on the Alternative Harvest ETF (MJ) and six of its components. I am sure there are other cannabis-related names out there, but I would like to focus on the purer plays. For example, the Advisor Shares Vice...
READ MORE
MEMBERS ONLY
Google Goes Gaga
by Arthur Hill,
Chief Technical Strategist, TrendInvestorPro.com
Google, or rather Alphabet, broke out of a short-term consolidation and this could have long-term implications.
The chart below shows GOOGL hitting support in the 980-1000 area from October to December. This support zone extends back to December 2017 and represents a whole lot of demand. Buyers are clearly active...
READ MORE
MEMBERS ONLY
S&P 500 Clears the 200-day. Should we Take the Bait?
by Arthur Hill,
Chief Technical Strategist, TrendInvestorPro.com
We are all well aware of the S&P 500 and the 200-day moving average, but how well does this moving average work for broad market timing? Pretty well, it turns out, but only on the long side.
I put the 200-day moving average to the test for the...
READ MORE
MEMBERS ONLY
Weekly Market Review & Outlook - Resistance versus Uptrend
by Arthur Hill,
Chief Technical Strategist, TrendInvestorPro.com
* Resistance in an Uptrend?
* Bulk of the Evidence Bullish.
* Utilities, REITs and Industrials Lead in Price.
* Finance Holds Flag Breakout.
* When Bad News is Good (SQ).
* Volume Picks up in Fox Factory.
* A Classic Breakout and Throwback (SCWX).
* ChartList Updates.
... Resistance in an Uptrend?
... The S&P 500 advanced...
READ MORE
MEMBERS ONLY
Watching the Triple A Stocks for Clues on QQQ
by Arthur Hill,
Chief Technical Strategist, TrendInvestorPro.com
Apple, Amazon and Alphabet account for around 9 percent of the S&P 500 SPDR and around 27 percent of the Nasdaq 100 ETF. Thus, the next directional move in these three will clearly impact the broader market. As the charts now stand, Apple, Amazon and Alphabet are lagging...
READ MORE
MEMBERS ONLY
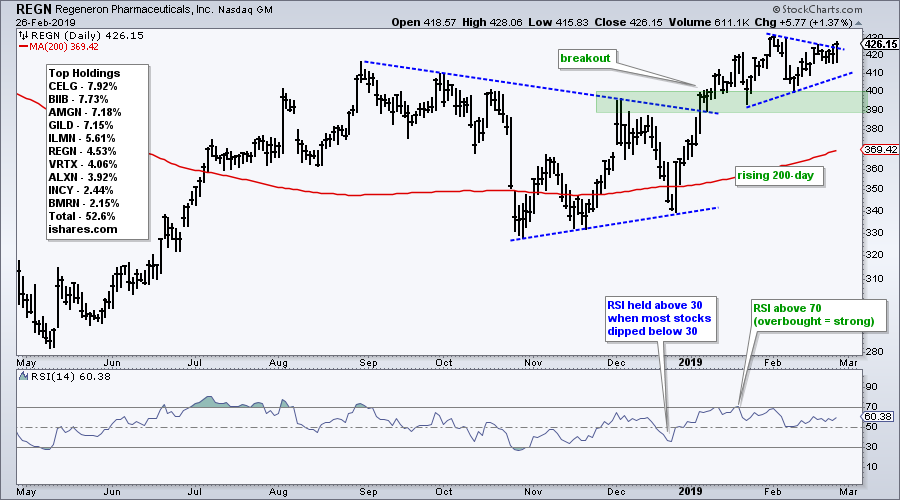
A Rejuvenated Regeneron Leads Biotech Group
by Arthur Hill,
Chief Technical Strategist, TrendInvestorPro.com
It is a mixed bag for the big biotech stocks this year. Of the top ten stocks in IBB, five are underperforming SPY and five are outperforming. Regeneron is slightly outperforming SPY this year and sports a bullish pattern on the price chart.
First and foremost, the bigger trend is...
READ MORE
MEMBERS ONLY
Third Time Lucky for Resistance?
by Arthur Hill,
Chief Technical Strategist, TrendInvestorPro.com
Another Obvious Resistance Level
If the S&P 500 declines from current levels, we will be able to look back at this level and see it as an "obvious" resistance level. Ain't hindsight great! Keep in mind, however, that this is the third "obvious&...
READ MORE