MEMBERS ONLY
Financial SPDR enters retracement zone
by Arthur Hill,
Chief Technical Strategist, TrendInvestorPro.com
With a sharp decline the last four days, the Financials SPDR (XLF) entered a key retracement zone that may offer support. The area around 14.86-15.29 marks a 50-62% of the February-April rally. XLF is also oversold after a 12% decline in four weeks.
Click this...
READ MORE
MEMBERS ONLY
Indicator table remains net positive
by Arthur Hill,
Chief Technical Strategist, TrendInvestorPro.com
As deep as this week's decline has been, it was not enough to turn the position table net negative. The AD Lines and AD Volume Line were hit, but remain in uptrends and well above their February lows. Most of the Bullish Percent Indices are still above 50%...
READ MORE
MEMBERS ONLY
SPY closes near 50% retracement
by Arthur Hill,
Chief Technical Strategist, TrendInvestorPro.com
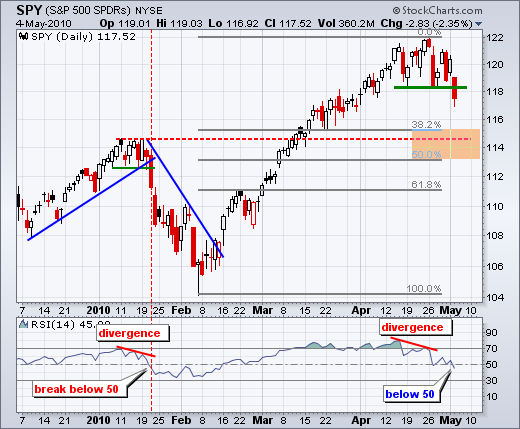
On the daily chart, the S&P 500 ETF (SPY) broke support from the mid April lows and plunged to the 50% retracement mark. I am not sure what to make of the intraday plunge below 106 - except that I would hate to have had a sell order filled...
READ MORE
MEMBERS ONLY
QQQQ returns to broken resistance
by Arthur Hill,
Chief Technical Strategist, TrendInvestorPro.com
The Nasdaq 100 ETF (QQQQ) is gearing up for the first test since the support break at 49. With a decline back to 46.70, the ETF is now back to broken resistance from the January highs. This area now becomes a possible support level to watch in the coming...
READ MORE
MEMBERS ONLY
Friday could be a big day
by Arthur Hill,
Chief Technical Strategist, TrendInvestorPro.com
I don't usually start with fundamental items, but Friday could be a real doozy. First, the German parliament is scheduled to vote on the Greek bailout. Needless to say, the German public is not too happy about subsidizing early retirement (55) and other Greek benefits. A NO vote...
READ MORE
MEMBERS ONLY
Wal-mart surges off support
by Arthur Hill,
Chief Technical Strategist, TrendInvestorPro.com
Despite a sharp decline in the stock market on Tuesday, Wal-mart managed a small gain near support and then surged on Wednesday with pretty good volume. This stock is a big part of the consumer staples sector.
Click this image for details...
READ MORE
MEMBERS ONLY
SPY breaks range support
by Arthur Hill,
Chief Technical Strategist, TrendInvestorPro.com
The S&P 500 ETF (SPY) broke range support with a gap down and long red candlestick. Selling pressure was broad based as all nine sectors were down. Healthcare held up the best with a .58% loss. On the daily chart, the next support zone stems from broken resistance...
READ MORE
MEMBERS ONLY
CandleGlance of the most active
by Arthur Hill,
Chief Technical Strategist, TrendInvestorPro.com
The most active lists for Monday show 9-1 winners-losers for the NYSE and 8-2 for the Nasdaq. This table is updated throughout the day on the Free Charts page. Users can even click the CandleGlance link to see 10 small charts of these most active stocks. The...
READ MORE
MEMBERS ONLY
SPY bounces off range support
by Arthur Hill,
Chief Technical Strategist, TrendInvestorPro.com
SPY is going everywhere and nowhere at the same time. The ETF has moved on either side of 120 nine times in the last three weeks. Overall, the ETF has been stuck in a range bound by 122 on the top and 118 on the bottom (about a 3.33%...
READ MORE
MEMBERS ONLY
An evening doji star for Home Depot
by Arthur Hill,
Chief Technical Strategist, TrendInvestorPro.com
Home Depot formed a rare evening doji star last week. Note the long white candlestick and surge above 36, the gravestone doji with the gap up and the long red candlestick last Monday. Also note the gaps on either side of the gravestone doji.
Click this image for details...
READ MORE
MEMBERS ONLY
SPY tests range support
by Arthur Hill,
Chief Technical Strategist, TrendInvestorPro.com
SPY is starting the week with a support test around 118. Also note that the Dow SPDR (DIA) and Nasdaq 100 ETF (QQQQ) are near range support today. There were a few bearish developments last week. First, SPY gapped down on Monday morning and moved sharply lower to form a...
READ MORE
MEMBERS ONLY
A SUPPORT TEST FOR THE DOW NEXT WEEK
by Arthur Hill,
Chief Technical Strategist, TrendInvestorPro.com
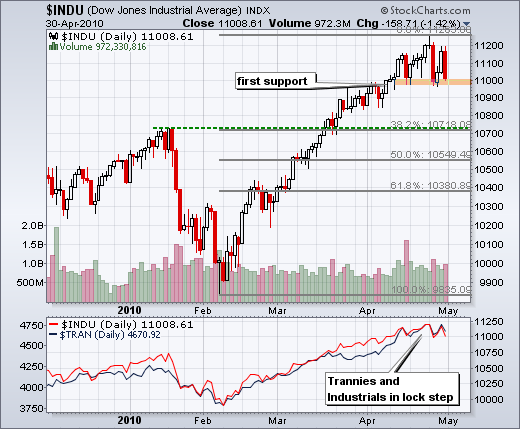
With the third long red candlestick in three weeks, the Dow Industrials is once again testing support in the 11000 area. The senior average first exceeded 11000 on April 14th and then moved into a trading range. While a support break would be short-term bearish, it would not be...
READ MORE
MEMBERS ONLY
France and China Lag
by Arthur Hill,
Chief Technical Strategist, TrendInvestorPro.com
The French CAC 40 ($CAC) and the Shanghai Composite ($SSEC) are down year-to-date and lagging other world indices. In contrast, the Nikkei 225 ($NIKK) is up 3.59% this year and the S&P 500 is leading with a 8.22% gain this year.
Click this image...
READ MORE
MEMBERS ONLY
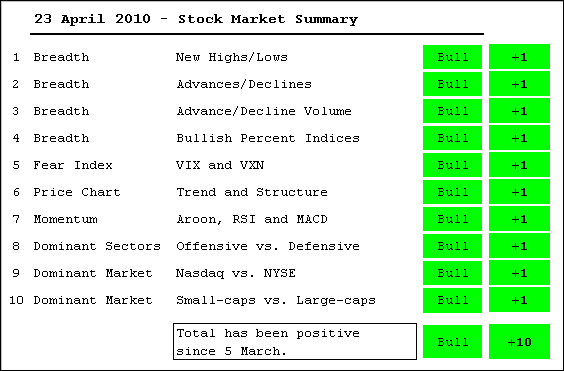
Medium-Term Evidence Remains Bullish
by Arthur Hill,
Chief Technical Strategist, TrendInvestorPro.com
There is no change in the Stock Market Summary this week. The bulk of the evidence turned bullish again on March 5th and remains bullish. All 10 indicators are in bull mode. Selling pressure hit the market hard on April 16th and April 27th, but the market rebounded the very...
READ MORE
MEMBERS ONLY
SPY moves into a trading range
by Arthur Hill,
Chief Technical Strategist, TrendInvestorPro.com
Overall, the trend on the daily chart remains up. SPY forged a higher high last week and held short-term support this week. Even a break below this week's low would not be enough to reverse the medium-term uptrend because we should allow room for a correction...
READ MORE
MEMBERS ONLY
Copper hits support zone
by Arthur Hill,
Chief Technical Strategist, TrendInvestorPro.com
Copper ($COPPER) fell with the stock market over the last two weeks. And like the stock market, copper firmed on Wednesday with a support zone around 330-340. The indicator window shows copper with the S&P 500. Notice how closely these two have been tracking over the last...
READ MORE
MEMBERS ONLY
To bounce or not to bounce
by Arthur Hill,
Chief Technical Strategist, TrendInvestorPro.com
That is the question. The S&P 500 ETF (SPY) became short-term oversold after a sharp decline on Tuesday and then firmed with an indecisive candlestick on Wednesday. Taken together, we have a harami or inside day. In addition, the ETF has support around 118.5 from last...
READ MORE
MEMBERS ONLY
Sprint goes for 8 straight
by Arthur Hill,
Chief Technical Strategist, TrendInvestorPro.com
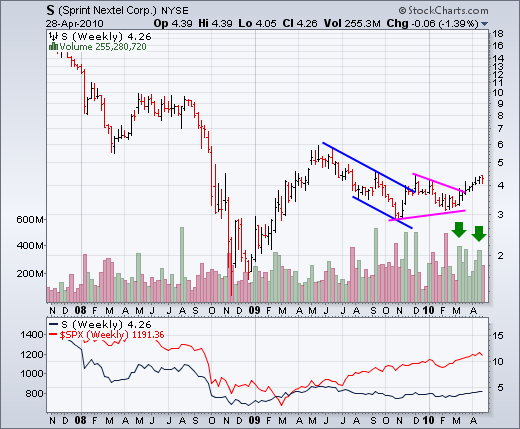
Sprint (S) advanced the last seven weeks and broke triangle resistance in the process. This is the longest weekly string in over 2 1/2 years. Volume has been pretty impressive too.
Click this image for details...
READ MORE
MEMBERS ONLY
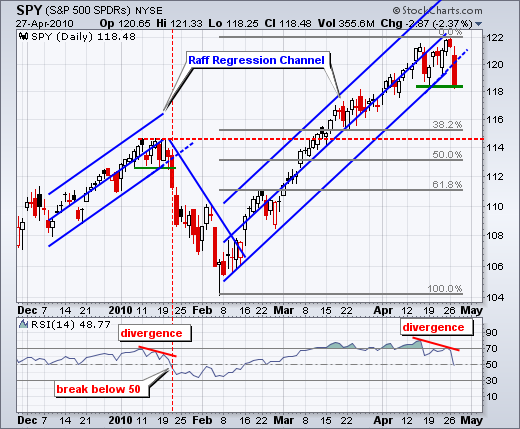
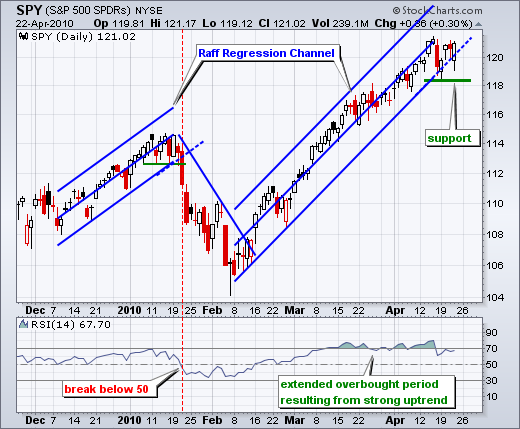
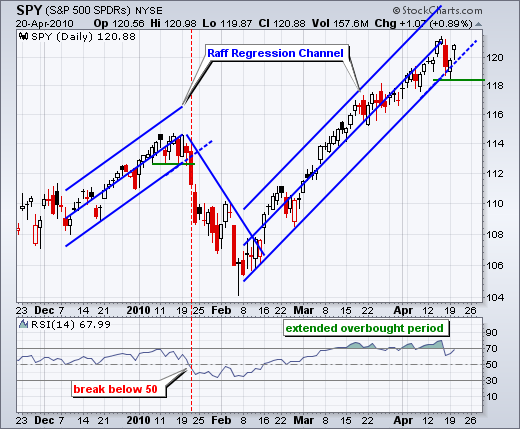
SPY breaks channel support
by Arthur Hill,
Chief Technical Strategist, TrendInvestorPro.com
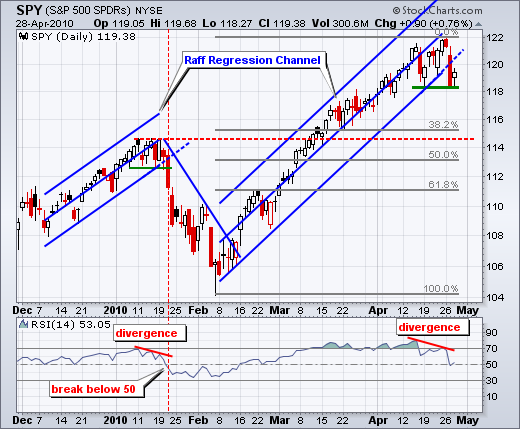
With a gap down and long red candlestick, the S&P 500 ETF (SPY) broke below the lower trendline of the Raff Regression Channel. This is the second long red candlestick (sharp decline) in two weeks. In fact, the channel break is starting to look similar to the mid...
READ MORE
MEMBERS ONLY
Elder Impulse breakout for Frontier Comm
by Arthur Hill,
Chief Technical Strategist, TrendInvestorPro.com
Frontier Communications (FTR) broke consolidation resistance with a surge above 7.6 in early April. Notice that this surge occurred with a green price bar, which indicates an upturn in the Elder Impulse System. The bars are currently blue as the stock consolidates. Look for another green bar to signal...
READ MORE
MEMBERS ONLY
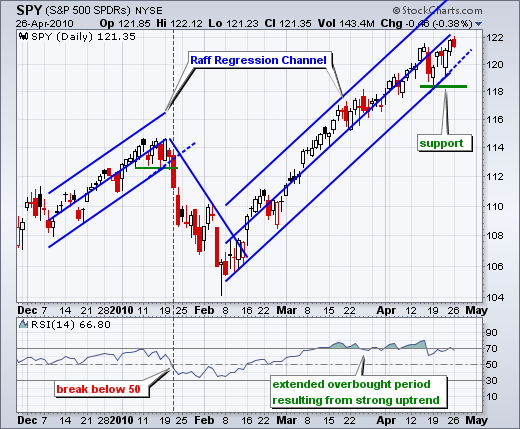
Bullish and overbought
by Arthur Hill,
Chief Technical Strategist, TrendInvestorPro.com
There is overbought and then there is OVERBOUGHT. Overbought conditions after a two week surge show early inning strength, but overbought conditions after a seven week surge show maturity in the late innings (baseball). I also noted in last night's Market Message that the CBOE Put/Call Ratio...
READ MORE
MEMBERS ONLY
Athens Index tests prior lows
by Arthur Hill,
Chief Technical Strategist, TrendInvestorPro.com
Despite a potential rescue package from the EU and IMF, the Athens General Index ($ATG) fell rather sharply over the last three days and is testing its February low. Greek equities are not impressed.
Click this image for details...
READ MORE
MEMBERS ONLY
A new high for SPY
by Arthur Hill,
Chief Technical Strategist, TrendInvestorPro.com
With another strong week, the S&P 500 ETF (SPY) surged to a new closing high for the move. The ETF was up four of five days and gained over 2%. Reaction to last week's earnings reports and news was positive overall. With the new closing high,...
READ MORE
MEMBERS ONLY
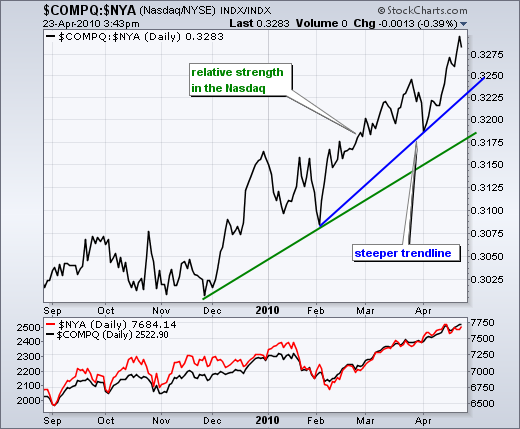
Nasdaq outperformance accelerates
by Arthur Hill,
Chief Technical Strategist, TrendInvestorPro.com
The Nasdaq has been outperforming the NY Composite since December and outperformance is accelerating. The green trendline defines the first rate of outperformance. The blue trendline, which is steeper, defines the second rate of outperformance. Also notice how the Nasdaq:NY Composite price relative shot higher in April.
Click this...
READ MORE
MEMBERS ONLY
Medium-Term Evidence Remains Bullish
by Arthur Hill,
Chief Technical Strategist, TrendInvestorPro.com
There is no change in the Stock Market Summary this week. The bulk of the evidence turned bullish again on March 5th and remains bullish. All 10 indicators are in bull mode. The only potential negative is the frothiness of the current advance. Nasdaq outperformance surged this month and small-...
READ MORE
MEMBERS ONLY
Resilience rules the day
by Arthur Hill,
Chief Technical Strategist, TrendInvestorPro.com
After a gap down and weak open, the S&P 500 ETF (SPY) firmed throughout the morning and then surged in the late afternoon to close positive. Once again, the bulls remain resilient as even the smallest dips bring out the buyers. The consumer discretionary sector and small-caps...
READ MORE
MEMBERS ONLY
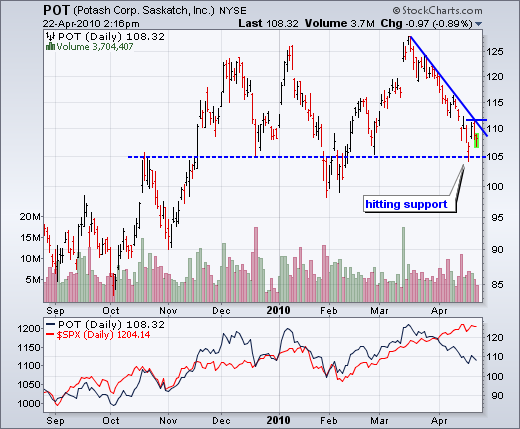
Potash hits support
by Arthur Hill,
Chief Technical Strategist, TrendInvestorPro.com
After a sharp decline the last five weeks, Potash (POT) hit support last week and bounced this week. A nice three candlestick reversal formed Thursday-Friday-Monday, but the stock fell back on Tuesday-Wednesday. Upside follow through would affirm support and trigger a short-term breakout.
Click this image...
READ MORE
MEMBERS ONLY
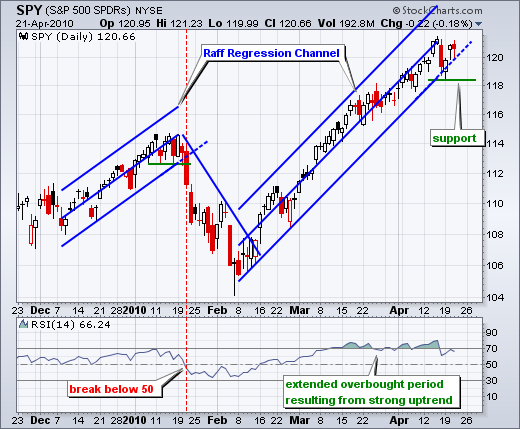
SPY stalls below prior high
by Arthur Hill,
Chief Technical Strategist, TrendInvestorPro.com
There is no change on the daily chart as SPY remains just above the Raff Regression Channel extension. SPY affirmed channel support with a reversal day on Monday and bounced on Tuesday. There was not much upside follow through after Tuesday's strong open as the ETF stalled around...
READ MORE
MEMBERS ONLY
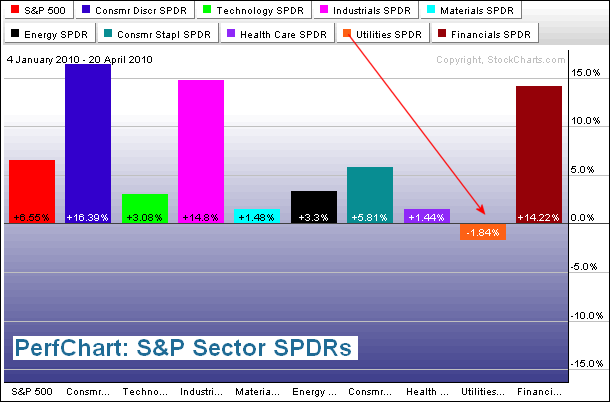
Utilities down for the year
by Arthur Hill,
Chief Technical Strategist, TrendInvestorPro.com
The Utilities SPDR (XLU) is not partaking in the 2010 market advance. While the S&P 500 is up over 6% year-to-date, the defensive oriented XLU is down almost 2%. It is the only sector sporting a loss this year. In sharp contrast, the offensive oriented consumer...
READ MORE
MEMBERS ONLY
SPY holds channel support; Charts: APA,CCI,CTXS,DISH,FTR,LIFE,QCOM,SYMC,THC
by Arthur Hill,
Chief Technical Strategist, TrendInvestorPro.com
We made it through the ash cloud and I am back at the office with my normal work setup (computers, big monitors, Nespresso, etc...). Office sweet office!
After a sharp decline on Friday, SPY recovered from early weakness on Monday and extended its gains on Tuesday. Once again, the pullback...
READ MORE
MEMBERS ONLY
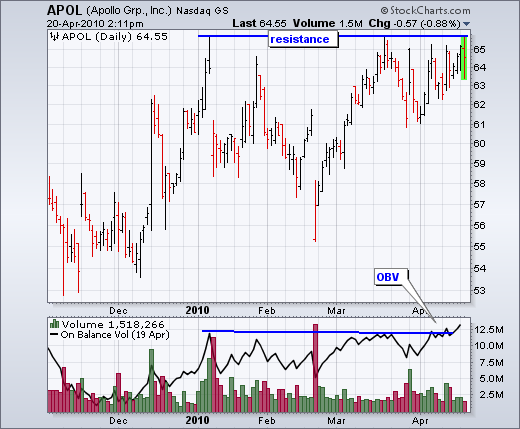
APOL consolidates near resistance
by Arthur Hill,
Chief Technical Strategist, TrendInvestorPro.com
The chart for Apollo Group (APOL) sports a consolidation pattern that looks like an inverse head-and-shoulders. Resistance in the 65-66 area stems from reaction highs in January-March as well as the consolidation in April. A break above these highs would be bullish. Notice that OBV already...
READ MORE
MEMBERS ONLY
SPY hits channel support
by Arthur Hill,
Chief Technical Strategist, TrendInvestorPro.com
After a sharp decline on Friday and further weakness early Monday, the S&P 500 ETF (SPY) recovered and managed to firm at the Raff Regression Channel. This channel defines the current advance and a break below would call for a re-evaluation of this uptrend.
Click this image...
READ MORE
MEMBERS ONLY
Breadth and intermarket charts updated
by Arthur Hill,
Chief Technical Strategist, TrendInvestorPro.com
Note that Net Advances on the Nasdaq and NYSE plunged to their lowest levels since February. Net Advancing Volume on the NYSE and Nasdaq also plunged to its lowest level since February.
Click here for breadth charts and here for intermarket charts....
READ MORE
MEMBERS ONLY
Flying through the ash
by Arthur Hill,
Chief Technical Strategist, TrendInvestorPro.com
After being stranded for a few days, we finally caught a flight home that will arrive on Tuesday. Unfortunately, I will not be able to provide an SPY update on Tuesday. Normal updates will continue on Wednesday, provided we make it through the volcanic ash!...
READ MORE
MEMBERS ONLY
SPY hits short-term support zone
by Arthur Hill,
Chief Technical Strategist, TrendInvestorPro.com
I am almost back in the saddle. Vacations are great, but it usually takes a day or two to get re-acclimated to the market environment. Stocks remained strong the last two weeks as the major index ETFs hit new highs for the move last week. The Dollar slipped as...
READ MORE
MEMBERS ONLY
SPX: now versus 1965 to 1980
by Arthur Hill,
Chief Technical Strategist, TrendInvestorPro.com
From the historical charts at Stockcharts.com, we have cutouts of two large trading ranges. The S&P 500 was largely range bound from the mid 60s to the late 70s (~15 years) and from the late 90s until the present (~13 years). The current rally looks similar to...
READ MORE
MEMBERS ONLY
Gold-Dollar relationship challenged
by Arthur Hill,
Chief Technical Strategist, TrendInvestorPro.com
The nine year chart for the US Dollar Index ($USD) and Gold-Continuous Futures ($GOLD) shows a clear inverse relationship from 2002 until 2007. Gold advanced as the Dollar declined. This inverse relationship continued with the swings of 2008 and 2009 (Dollar down/gold up and visa versa). The potential...
READ MORE
MEMBERS ONLY
Long-term support for the Euro
by Arthur Hill,
Chief Technical Strategist, TrendInvestorPro.com
The Euro Index ($XEU) appears to be in a long-term downtrend with the next support zone around 117-120. With a lower high in December, a falling channel is taking shape. The lower trendline extends to 115 and there is support around 117-120 from the 2004-2005 lows....
READ MORE
MEMBERS ONLY
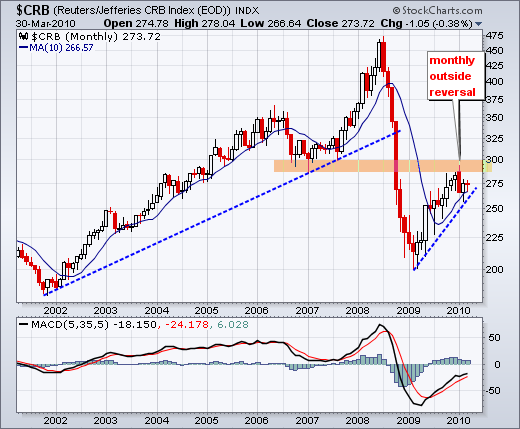
CRB forms monthly outside reversal
by Arthur Hill,
Chief Technical Strategist, TrendInvestorPro.com
The CRB Index ($CRB) advanced with the stock market in 2009, but hit resistance from broken support and formed a monthly outside reversal. This is also known as a bearish engulfing. The combination of resistance and reversal could cap this rally. A monthly close below the rising 10-month SMA...
READ MORE
MEMBERS ONLY
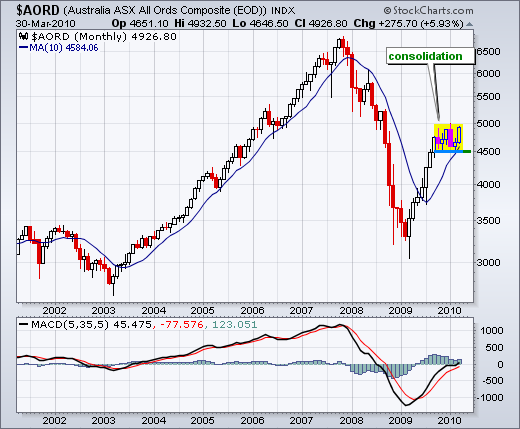
All Ords establish support
by Arthur Hill,
Chief Technical Strategist, TrendInvestorPro.com
The Australian All Ords Composite ($AORDS) has been rallying with the rest of the world over the last 14 months. With a stall around 4500-5000 the last six months, the index established support at 4500. "No worries" for the bulls as long as this support level holds....
READ MORE