MEMBERS ONLY
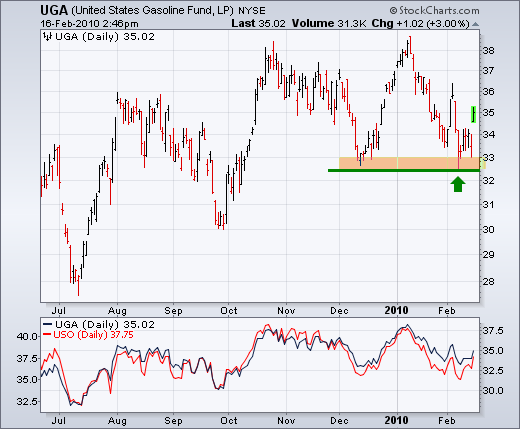
Gasoline ETF Surges off Support
by Arthur Hill,
Chief Technical Strategist, TrendInvestorPro.com
The US Gasoline ETF (UGA) surged off support with a gap and big move on Tuesday. This successful support test keeps the overall uptrend in place. A break below the Dec-Feb lows would reverse the medium-term uptrend. Notice how closely UGA and USO track.
Click this chart for...
READ MORE
MEMBERS ONLY
IWM and QQQQ Show Resilience
by Arthur Hill,
Chief Technical Strategist, TrendInvestorPro.com
Today I am starting with the Russell 2000 ETF (IWM) and Nasdaq 100 ETF (QQQQ) because both are showing resilience with pretty good advances over the last two days. Both broke above wedge trendlines and finished near the high for the week. It is positive to see small-caps and...
READ MORE
MEMBERS ONLY
Atmos Energy gets oversold bounce
by Arthur Hill,
Chief Technical Strategist, TrendInvestorPro.com
Atmos Energy came across the oversold RSI scan as 14-day RSI moved above 30 on Thursday. Also notice that the stock bounced right back to its 200-day moving average.
Click this chart for details...
READ MORE
MEMBERS ONLY
Evidence remains bearish
by Arthur Hill,
Chief Technical Strategist, TrendInvestorPro.com
On balance, the evidence still favors the bears at this stage. We are, however, still in a transition period or the early stages. The evidence favored the bulls from early September to February 5th. On February 5th, the sum total turned negative to favor the bears for the first time...
READ MORE
MEMBERS ONLY
SPY gets a bounce
by Arthur Hill,
Chief Technical Strategist, TrendInvestorPro.com
These daily SPY updates are short-term in nature and subject to change as new price data and information come to light - which is hourly. The objective of this analysis is education. It is not meant as a recommendation to buy, sell or sell short. The only advice I have...
READ MORE
MEMBERS ONLY
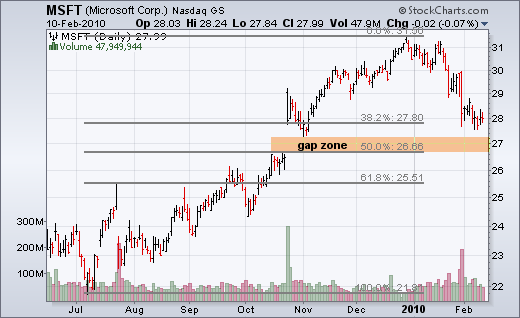
Microsoft firms near the gap zone
by Arthur Hill,
Chief Technical Strategist, TrendInvestorPro.com
After a sharp (~10%) decline this year, Microsoft (MSFT) is nearing its first support zone around 27-28. Support here stems from the October gap and the 38% retracement. MSFT firmed around 28 over last four days and yesterday's range was the narrowest of the last six days....
READ MORE
MEMBERS ONLY
Oversold and firming
by Arthur Hill,
Chief Technical Strategist, TrendInvestorPro.com
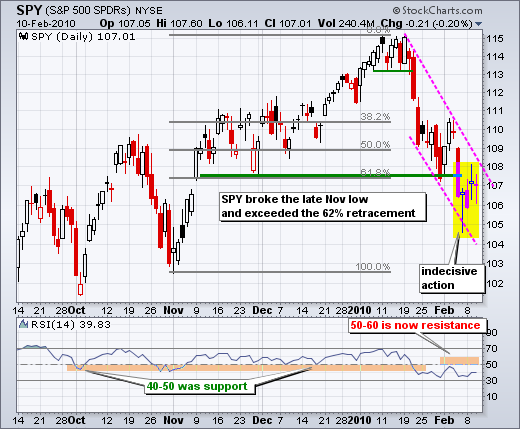
Today I am going to show four daily charts: SPY, RSP, IWM and QQQQ. This is an interesting quartet. SPY broke the late November low and exceeded the 62% retracement. The decline from 115 to 105 was the deepest since March and did enough technical damage to turn medium-term...
READ MORE
MEMBERS ONLY
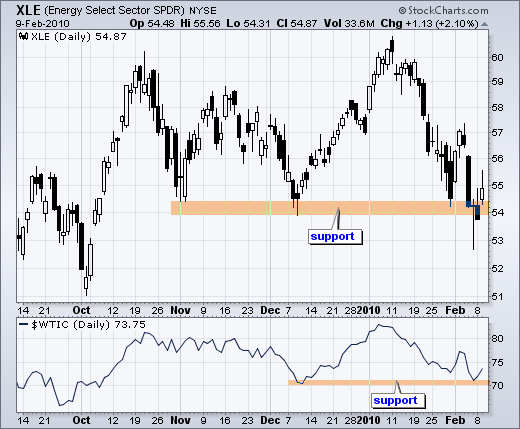
Energy SPDR and Oil Test Support
by Arthur Hill,
Chief Technical Strategist, TrendInvestorPro.com
The Energy SPDR (XLE) and West Texas Intermediate ($WTIC) are both testing support from their December lows. XLE bounced off the 54 area in early November and early December to establish support. Oil bounced off 70 in early December to establish support. Successful tests would be bullish, but breaks by...
READ MORE
MEMBERS ONLY
A hesitant bounce for SPY plus 5 stock charts
by Arthur Hill,
Chief Technical Strategist, TrendInvestorPro.com
The medium-term and short-term trends are both considered down at this point. SPY broke below its late November support zone with the biggest decline since early last year. After a selling climax of sorts on Friday, the ETF bounced back above 107 on Tuesday. This bounce was, however,...
READ MORE
MEMBERS ONLY
ORLY forms a triangle consolidation
by Arthur Hill,
Chief Technical Strategist, TrendInvestorPro.com
After a decline from mid November to mid December, O'Reilly Automotive (ORLY) formed a triangle consolidation. The stock is holding up better that the S&P 500 since January, but a triangle break is required for the next directional signal.
Click this chart for details...
READ MORE
MEMBERS ONLY
SPY analysis and charts of interest
by Arthur Hill,
Chief Technical Strategist, TrendInvestorPro.com
SPY started the day strong, but finished weak and closed with a modest loss. Even though there was no follow through on Monday, the ETF remains short-term oversold and ripe for a bounce or consolidation. Overall, the 3-4 week pattern looks like a zigzag decline with three legs...
READ MORE
MEMBERS ONLY
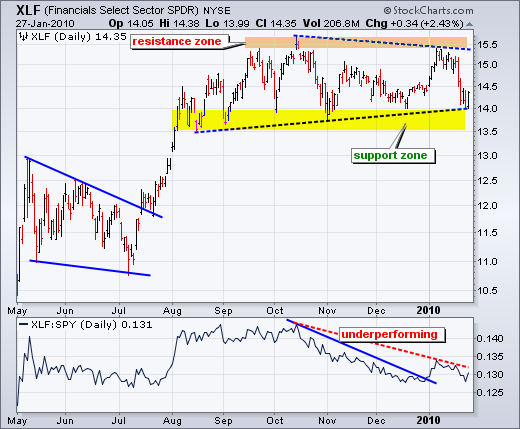
Finance leads sectors lower
by Arthur Hill,
Chief Technical Strategist, TrendInvestorPro.com
The Sector SPDR section of the Market Summary shows the Financials SPDR (XLF) and the Materials SPDR (XLB) leading the market lower today. Despite Friday's intraday reversal, there was no follow through as all sectors moved lower on Monday.
Click this chart for details...
READ MORE
MEMBERS ONLY
A reversal day for SPY
by Arthur Hill,
Chief Technical Strategist, TrendInvestorPro.com
SPY plunged below its late November low on Thursday and firmed on Friday with a reversal candlestick. Even though it is not a picture perfect hammer, the essence of the pattern is clearly there. SPY opened at 106.56, plunged below 105 intraday and recovered to close at 106.66,...
READ MORE
MEMBERS ONLY
Commodities weighed down by Dollar and stocks
by Arthur Hill,
Chief Technical Strategist, TrendInvestorPro.com
In addition to stock markets around the world, we have seen a rout in various commodity groups over the last 3-4 weeks. Strength in the Dollar is partly to blame. Weakness in global equities also bodes ill for the commodities. A downturn in global equities would imply a future...
READ MORE
MEMBERS ONLY
A MACD cross for PSA
by Arthur Hill,
Chief Technical Strategist, TrendInvestorPro.com
Public Storage (PSA) came across the Bearish MACD Crossover on the predefined scans page. The chart below shows PSA gapping down and closing weak with high volume. MACD moved from positive territory to negative territory as it crossed back below its signal line.
Click this chart for details...
READ MORE
MEMBERS ONLY
Evidence turns bearish
by Arthur Hill,
Chief Technical Strategist, TrendInvestorPro.com
I started this evidence table in September and the bulk of the evidence was net positive from September to January. Signs of weakness started appearing in the second half of January and the evidence turned net negative this week. To the model's credit, the evidence stayed net positive...
READ MORE
MEMBERS ONLY
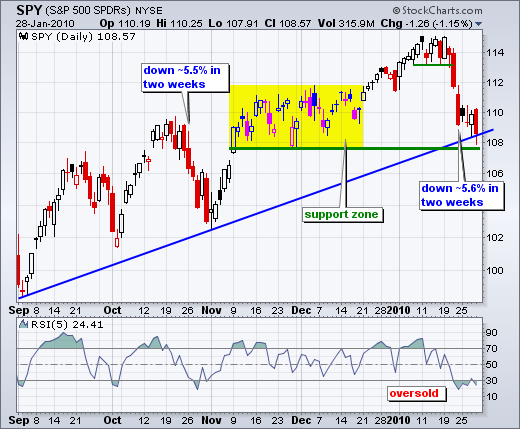
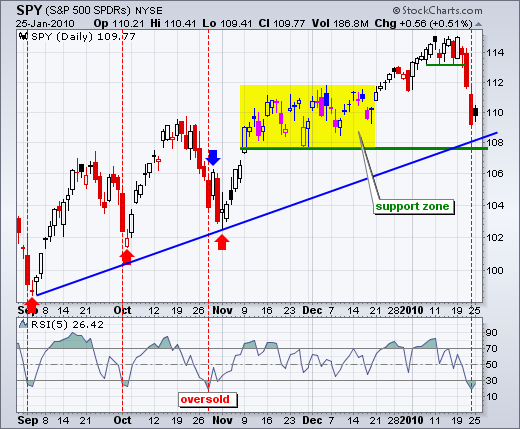
SPY gaps and breaks support
by Arthur Hill,
Chief Technical Strategist, TrendInvestorPro.com
The S&P 500 ETF (SPY) failed at short-term resistance and broke medium-term support with a sharp decline on Thursday. A support zone around 108 held up for the prior six days, but wilted with a long red candlestick yesterday. Even though SPY remains above the last...
READ MORE
MEMBERS ONLY
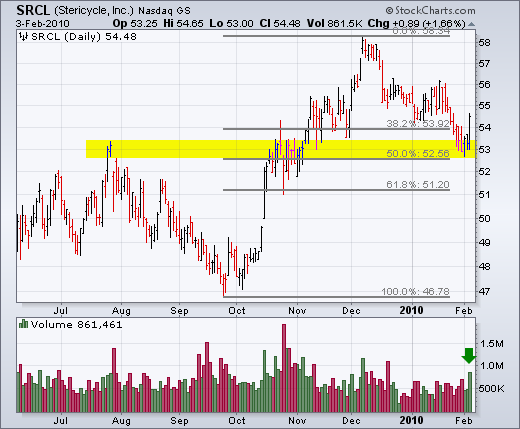
Stericycle bounces off broken resistance
by Arthur Hill,
Chief Technical Strategist, TrendInvestorPro.com
Stericycle (SRCL) broke resistance with a surge last year and returned to broken resistance this year. It looks like broken resistance is turning into support as the stock surged with good volume on Wednesday. Also notice that the Dec-Jan decline retraced 50% of the prior advance.
Click this chart...
READ MORE
MEMBERS ONLY
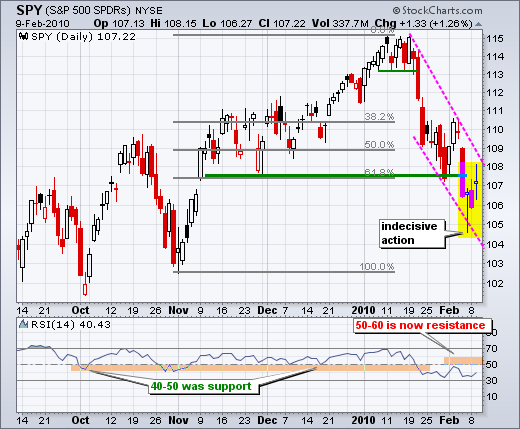
SPY stalls at short-term resistance
by Arthur Hill,
Chief Technical Strategist, TrendInvestorPro.com
SPY surged off support with two good gains on Monday-Tuesday, but ran into short-term resistance on Wednesday and stalled with a doji. The doji looks like a big plus sign (+). With little change from open to close, the horizontal portion is small or just a line. Vertical lines...
READ MORE
MEMBERS ONLY
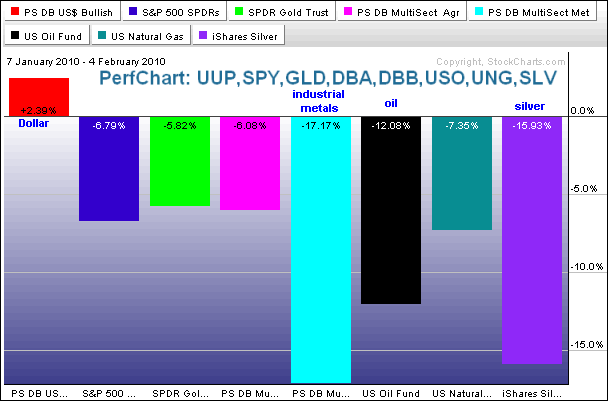
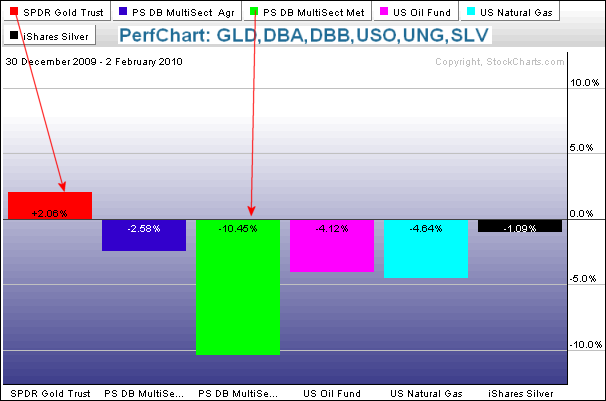
Commodity ETFs Under Pressure in 2010
by Arthur Hill,
Chief Technical Strategist, TrendInvestorPro.com
2010 has not been a good year for commodity ETFs so far. The PerfChart below shows six commodity ETFs from December 30th to February 2nd. Five of the six are down with the The DB Base Metals ETF (DBB) down over 10%. The Gold ETF (GLD) is the only gainer....
READ MORE
MEMBERS ONLY
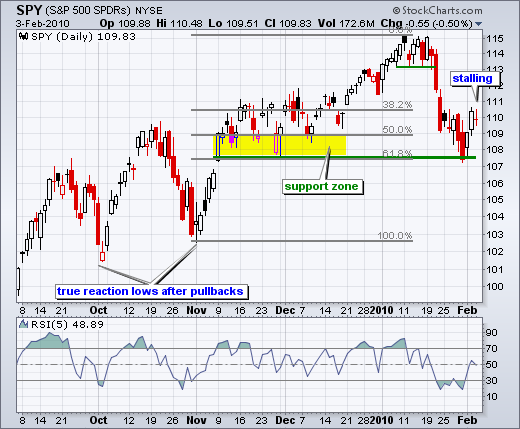
SPY surges to short-term resistance
by Arthur Hill,
Chief Technical Strategist, TrendInvestorPro.com
SPY hit the 62% retracement last week and bounced with two good moves this week. At this point, I still consider the medium-term trend up on the daily chart. SPY forged a higher high in early January and held support so far in February. Moreover, the ETF bounced at...
READ MORE
MEMBERS ONLY
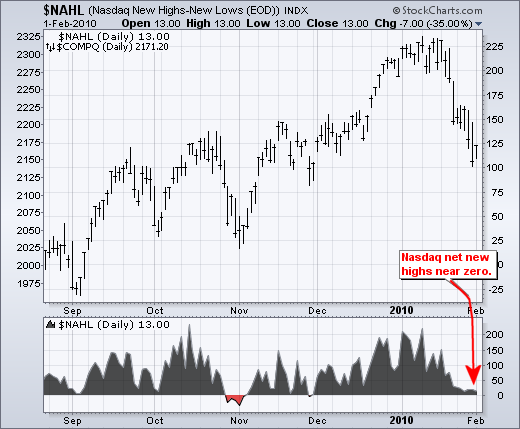
Nasdaq Net New Highs near zero
by Arthur Hill,
Chief Technical Strategist, TrendInvestorPro.com
With the decline over the last few weeks, Net New Highs on the Nasdaq moved below +50. This indicator was above +200 in early January and is now flirting with negative territory. Net New Highs equals new 52-week highs less new 52-week lows.
Click this chart for details...
READ MORE
MEMBERS ONLY
SPY firms for a day
by Arthur Hill,
Chief Technical Strategist, TrendInvestorPro.com
SPY took its decline to the brink of a support break, but manage to firm with a good bounce on Monday. This is enough to stave off a medium-term support break and keep the medium-term uptrend alive. The reasons for support around 108-109 remain unchanged. Support stems...
READ MORE
MEMBERS ONLY
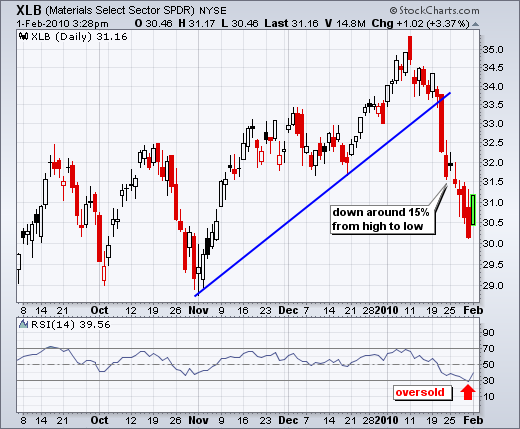
XLB leads oversold bounce
by Arthur Hill,
Chief Technical Strategist, TrendInvestorPro.com
The harder they fall, the bigger they bounce. The Materials SPDR (XLB) led the sectors lower by declining around 15% from high to low the prior three weeks. In the process, the ETF was down 11 of the last 15 days. After becoming oversold on Friday (see RSI), the ETF...
READ MORE
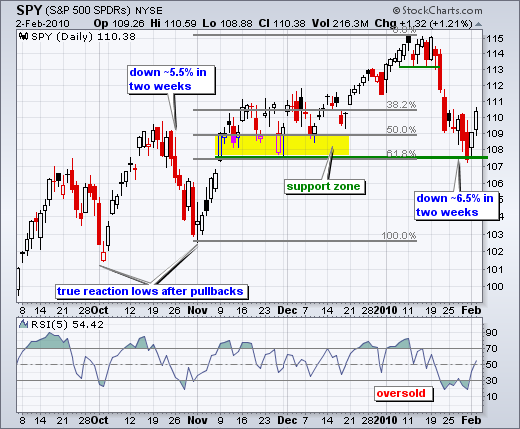
MEMBERS ONLY
SPY hits 62% retracement
by Arthur Hill,
Chief Technical Strategist, TrendInvestorPro.com
SPY opened strong and closed weak for the second time in two days. Another long red candlestick formed as the ETF closed below its late November low. Even though SPY broke support, keep in mind that the last true reaction low was in early November around 103 and SPY remains...
READ MORE
MEMBERS ONLY
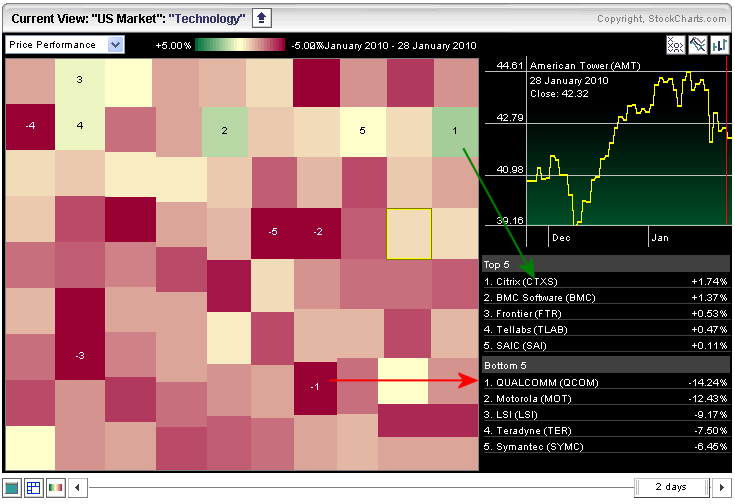
Technology sector sees red
by Arthur Hill,
Chief Technical Strategist, TrendInvestorPro.com
Within the S&P Sector Carpet, the technology sector showed a lot of red on Thursday. From the Sector Carpet, click on the technology heading to focus on this sector. Even though most stocks were down, there were still a few gainers with Citrix and BMC Software gaining more...
READ MORE
MEMBERS ONLY
Bullish evidence weakens
by Arthur Hill,
Chief Technical Strategist, TrendInvestorPro.com
With a sharp decline over the last two weeks, it is hardly surprising that the bullish evidence weakened considerably since early January. Three indicators are considered bearish. The McClellan Oscillators both plunged below -50 to signal a sharp thrust in selling pressure. Momentum is bearish as MACD for SPY moved...
READ MORE
MEMBERS ONLY
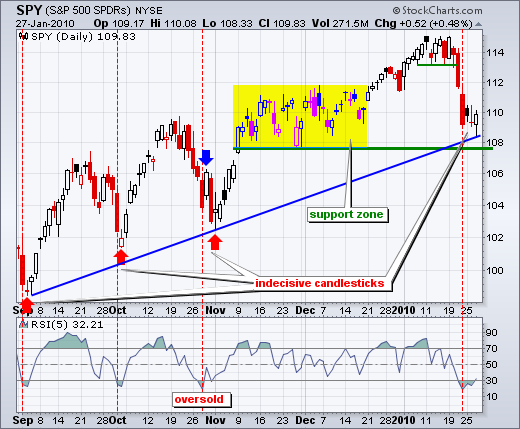
SPY continues support test
by Arthur Hill,
Chief Technical Strategist, TrendInvestorPro.com
SPY opened strong and closed weak to form a long red candlestick. After three indecisive candlesticks Monday through Wednesday, Thursday's failed rally reflects the skittishness of traders/investors. Even so, SPY remains in a support zone around 109 (plus or minus 1 point). SPY has been fluctuating above/...
READ MORE
MEMBERS ONLY
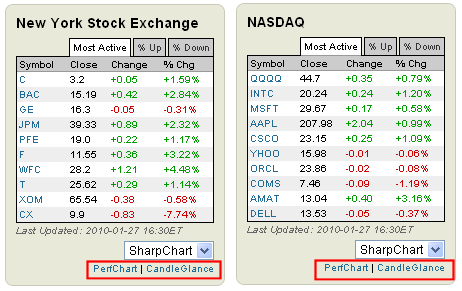
Most actives reflect bounce in finance sector
by Arthur Hill,
Chief Technical Strategist, TrendInvestorPro.com
From the Free Charts page, users can access a quick list of the 10 most active stocks for the Nasdaq and NYSE. As Wednesday's lists show, the finance sector was strong on Wednesday. Four of the ten most active were from the finance sector and these four were...
READ MORE
MEMBERS ONLY
Charts worth watching
by Arthur Hill,
Chief Technical Strategist, TrendInvestorPro.com
ETFs: XLF, XLY, GDX, XHB, SMH, TLT
Stocks: A, DVN, ERTS, KBH, LAZ, PGN, PSA, QCOM, WFC...
READ MORE
MEMBERS ONLY
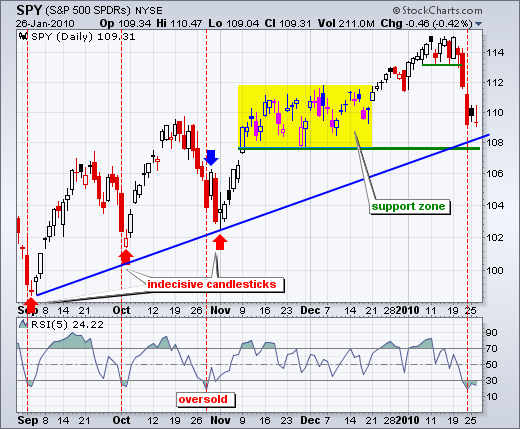
SPY continues to firm
by Arthur Hill,
Chief Technical Strategist, TrendInvestorPro.com
After becoming oversold with last week's decline, SPY firmed over the last three days and established some support around 109. There was an inside day on Monday, a failed rally candlestick on Tuesday and a strong close candlestick on Wednesday. Obviously, the strong close candlestick is the opposite...
READ MORE
MEMBERS ONLY
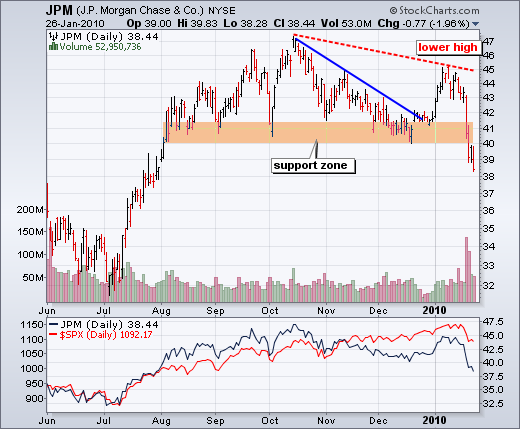
JP Morgan breaks support
by Arthur Hill,
Chief Technical Strategist, TrendInvestorPro.com
JP Morgan is leading the market and the finance sector lower with a break below its September-December lows. The stock first established support in the 40-41 zone in mid August and held this zone in September, October, November and December. January is proving different with a clear break...
READ MORE
MEMBERS ONLY
SPY remains on the canvas
by Arthur Hill,
Chief Technical Strategist, TrendInvestorPro.com
After two long red candlesticks and a sharp decline last week, the S&P 500 ETF (SPY) stalled the last two days. A small black candlestick formed on Monday and a failed rally candlestick formed on Tuesday. I call this a failed rally candlestick because the ETF hit 110....
READ MORE
MEMBERS ONLY
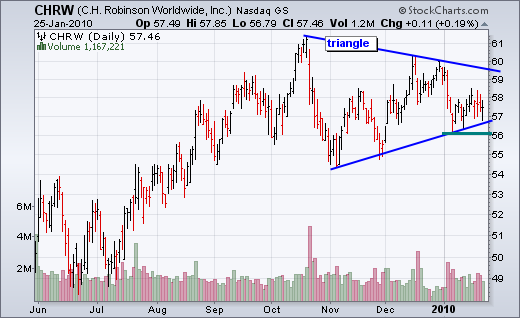
CHRW forms big triangle
by Arthur Hill,
Chief Technical Strategist, TrendInvestorPro.com
CH Robinson (CHRW), a trucking company, formed a big triangle consolidation over the last nine months. The stock has recently been consolidating near triangle support and a break below 56 would be bearish.
Click this chart for details...
READ MORE
MEMBERS ONLY
SPY stalls in support zone
by Arthur Hill,
Chief Technical Strategist, TrendInvestorPro.com
After a long red candlestick and sharp decline on Friday, the S&P 500 ETF (SPY) stalled with an inside day on Monday. Taken together, the red candlestick and smaller black candlestick form a harami, which is a potential reversal pattern. The inside day signals indecision that sometimes foreshadows...
READ MORE
MEMBERS ONLY
XHB hits resistance
by Arthur Hill,
Chief Technical Strategist, TrendInvestorPro.com
The Homebuilders SPDR (XHB) finished 2009 strong, but ran into resistance from its summer highs in 2010. The ETF first hit resistance around 16 in late July and traded in the 14-16 are the last 6-7 months. The stock has long-term support at 13.5 and a...
READ MORE
MEMBERS ONLY
Mean reversion strategies kicking in
by Arthur Hill,
Chief Technical Strategist, TrendInvestorPro.com
Last week's three-day decline in the S&P 500 ETF (SPY) was the steepest 3-day decline since March, Despite two long red candlesticks and this 3.9% decline, I still consider the medium-term trend up. As long as the medium-term trend remains up,...
READ MORE
MEMBERS ONLY
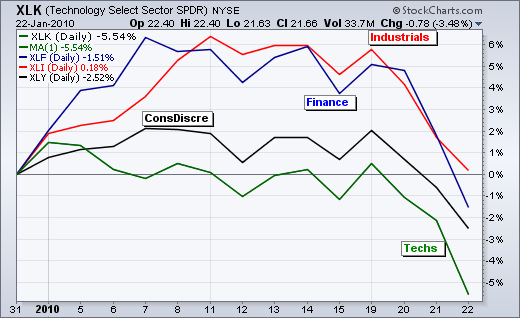
OFFENSIVE SECTORS TAKE A HIT
by Arthur Hill,
Chief Technical Strategist, TrendInvestorPro.com
Offensive sectors took a hard hit in January. Offensive sectors include technology, consumer discretionary, industrials and finance. I call them the offensive sectors because their participation is key to a bull market. Technology represents growth and the appetite for risk. Consumer discretionary is the most economically sensitive sector. Industrials represent...
READ MORE
MEMBERS ONLY
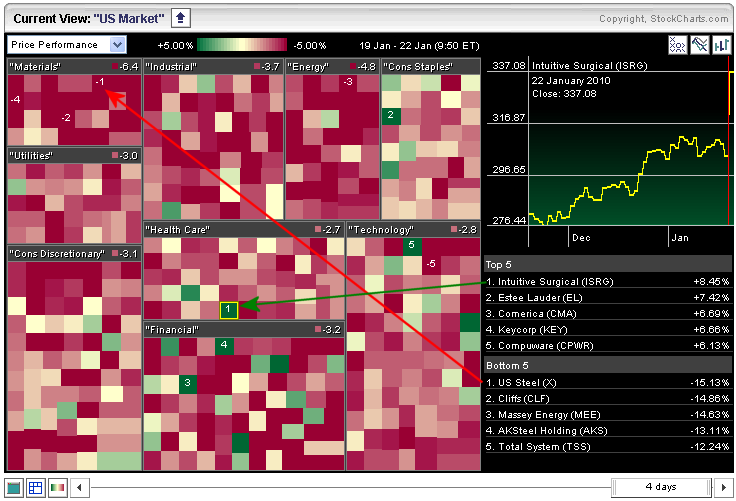
Steel stocks hit hard
by Arthur Hill,
Chief Technical Strategist, TrendInvestorPro.com
The s ector carpet over the last four days shows lots of red. Within the S&P 500, three of the five biggest losses came from steel stocks (US Steel, Cleveland Cliffs and AK Steel). There were, however, a few gainer that can be spotted with the green squares....
READ MORE
MEMBERS ONLY
Evidence remains bullish for stocks
by Arthur Hill,
Chief Technical Strategist, TrendInvestorPro.com
The bulk of the evidence remains bullish for stocks, but this week's sharp decline put a dent in the bullish case. Some brief comments are posted after the jump. I will also be posting a market message later this afternoon.
-Net New Highs remain positive for Nasdaq and...
READ MORE