MEMBERS ONLY
Correction Targets for SPY
by Arthur Hill,
Chief Technical Strategist, TrendInvestorPro.com
After consolidating around 114 for a couple weeks, SPY broke short-term support with a long red candlestick on Thursday. Even though this looks like a convincing support break, it is still just a short-term phenomenon because the medium-term trend remains up. With a medium-term uptrend still...
READ MORE
MEMBERS ONLY
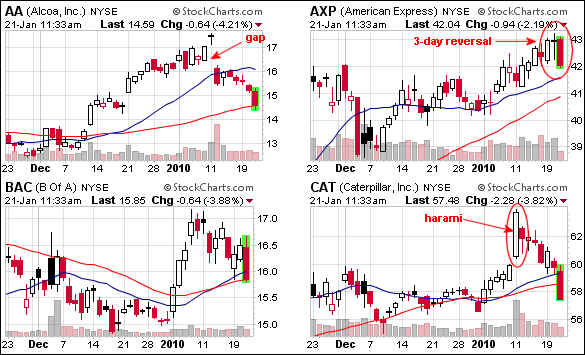
All 30 Dow Stocks Down
by Arthur Hill,
Chief Technical Strategist, TrendInvestorPro.com
The CandleGlance page for the Dow shows all 30 stocks trading in negative territory early Thursday. These mini-candlestick charts provide an quick means to see current action and candlestick setups. From the four charts below, we can see sharp declines in Alcoa, American Express, Bank of America and Caterpillar....
READ MORE
MEMBERS ONLY
SPY breaks short-term support
by Arthur Hill,
Chief Technical Strategist, TrendInvestorPro.com
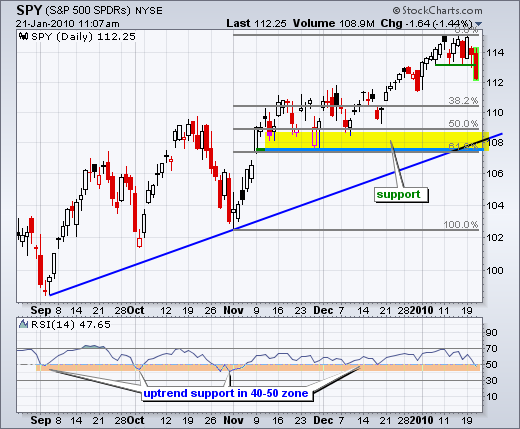
Even though the trend on the daily chart remains up, SPY broke short-term support and a correction appears to be unfolding. With the short-term support break, we can now start estimating a downside target for this correction. The last big move extends from the early November low to...
READ MORE
MEMBERS ONLY
UNH becomes overbought
by Arthur Hill,
Chief Technical Strategist, TrendInvestorPro.com
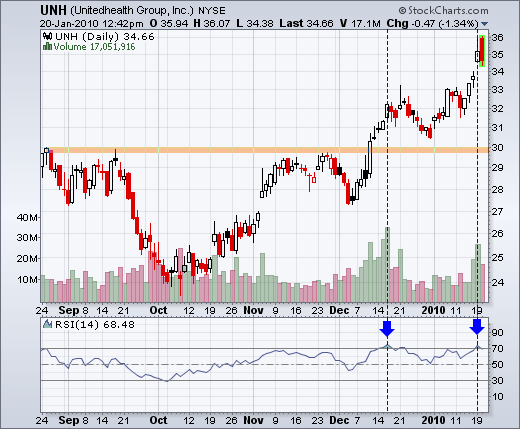
United Health (UNH) remains in a clear, and strong, uptrend, but the advance could be getting frothy as RSI becomes overbought and red candlestick takes shape on Wednesday. Notice that RSI moved above 70 for the second time in two months (blue arrows). Tuesday's gap is holding for...
READ MORE
MEMBERS ONLY
SPY Battles 114
by Arthur Hill,
Chief Technical Strategist, TrendInvestorPro.com
The medium-term uptrend is not in jeopardy at this point, but there is a clear battle raging around 114 as SPY crossed this level six times in the last eight days. Three of the downside crosses featured some intense selling pressure. Last Tuesday's decline occurred with a...
READ MORE
MEMBERS ONLY
LEAP forms bullish engulfing
by Arthur Hill,
Chief Technical Strategist, TrendInvestorPro.com
Direct from the StockScans candlestick page, Leap Wireless (LEAP) formed a bullish engulfing on big volume Friday. A bullish engulfing forms with a filled black or red candlestick and longer white candlestick. The white candlestick's open is below the prior close, but the stock rallies to close above...
READ MORE
MEMBERS ONLY
SPY bounces off support
by Arthur Hill,
Chief Technical Strategist, TrendInvestorPro.com
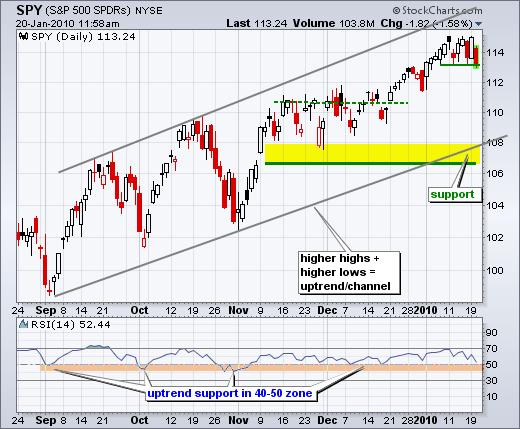
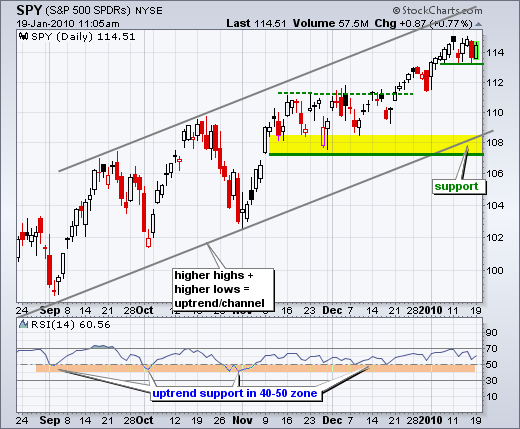
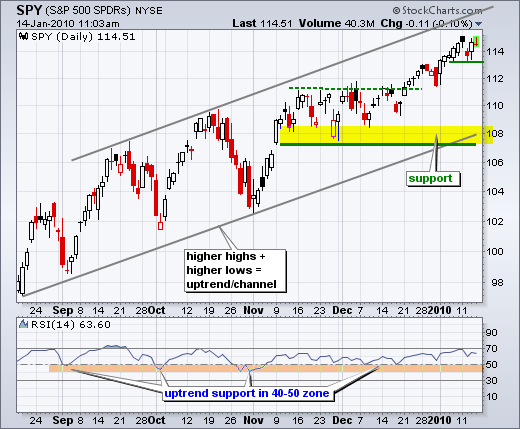
There is no change in the medium-term uptrend (daily chart). SPY is trading in the upper half of a rising price channel. Starting from around 103 in early November, the ETF broke resistance at 111 in late December and moved above 114 in early January. Even though SPY seems...
READ MORE
MEMBERS ONLY
GLD and TIP move step-for-step
by Arthur Hill,
Chief Technical Strategist, TrendInvestorPro.com
The Gold ETF (GLD) and the Inflation-Protected Bond ETF (TIP) show a positive correlation over the last few months. Both advanced from August to November, fell in December and bounced in January. Looks like gold is following the inflation outlook.
Click this chart for details...
READ MORE
MEMBERS ONLY
Evidence remains bullish
by Arthur Hill,
Chief Technical Strategist, TrendInvestorPro.com
Even though stocks seem overbought and ripe for a correction, there is still more evidence of buying pressure than selling pressure. This means that a correction would be just that - a pullback within a bigger uptrend. It is hard to say when a correction might hit because everyone seems to...
READ MORE
MEMBERS ONLY
SPY tests short-term support
by Arthur Hill,
Chief Technical Strategist, TrendInvestorPro.com
SPY is meeting resistance in the 115 area with a gap down on Monday and some weakness on Thursday. This is not enough to affect the medium-term uptrend. Short-term, the ETF is testing the lower trendline of a rising price channel. Support is marked in the 113-113....
READ MORE
MEMBERS ONLY
XLV hits another new high
by Arthur Hill,
Chief Technical Strategist, TrendInvestorPro.com
Money continues to flow into the healthcare sector as the Healthcare SPDR (XLV) recorded another 52-week high this week. XLV bounced off support in early November and surged over 12% in the last 12 weeks. Even though the advance is getting overextended, there are currently no signs of weakness...
READ MORE
MEMBERS ONLY
SPY channels higher
by Arthur Hill,
Chief Technical Strategist, TrendInvestorPro.com
Both the daily and 60-minute charts show SPY within rising channels. The daily chart captures the bigger uptrend, while the 60-minute chart captures the short-term uptrend. After an advance from 109 to 115 in 5-6 weeks, the ETF is short-term overbought and ripe for a...
READ MORE
MEMBERS ONLY
XLK gets off to rough start
by Arthur Hill,
Chief Technical Strategist, TrendInvestorPro.com
2010 has not been nice to the technology sector. The PerfChart below extends from January 4th until January 12th. Of the nine sectors SPDRs, and the S&P 500, the Technology SPDR (XLK) is down the most (over 2%). The Industrials SPDR (XLI) and Financials SPDR (XLF) are off...
READ MORE
MEMBERS ONLY
Dow Transports hit new 52-week high
by Arthur Hill,
Chief Technical Strategist, TrendInvestorPro.com
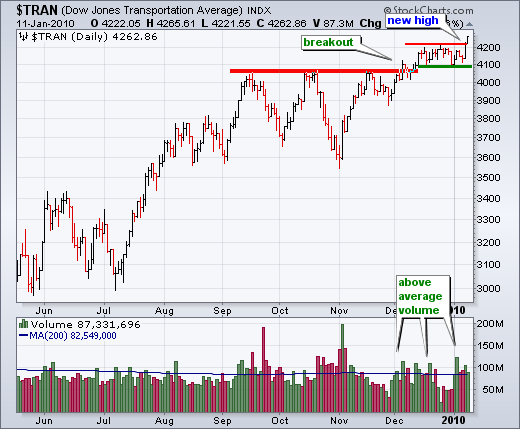
After breaking resistance in December, the Dow Transports consolidated a few weeks and then broke to a new 52-week high this week. Volume has also been strong since early December as many up days occurred with above average volume. And finally, broken resistance turned into support around 4090-4000....
READ MORE
MEMBERS ONLY
XLB hits 62% retracement
by Arthur Hill,
Chief Technical Strategist, TrendInvestorPro.com
With a huge advance since March 2009, the Materials SPDR (XLB) has retraced 62% of the prior decline, which extended from May 2008 to March 2009. There is also potential resistance from broken supports around 34-36.
Click this chart for details...
READ MORE
MEMBERS ONLY
SPY chart update
by Arthur Hill,
Chief Technical Strategist, TrendInvestorPro.com
There is no change in SPY. Both the short-term and medium-term trends remain up, but both are getting overextended and ripe for a pullback or consolidation. Even though this is not reason enough to turn bearish, it does argue for caution on the bullish side. I am off...
READ MORE
MEMBERS ONLY
New highs expand in December-January
by Arthur Hill,
Chief Technical Strategist, TrendInvestorPro.com
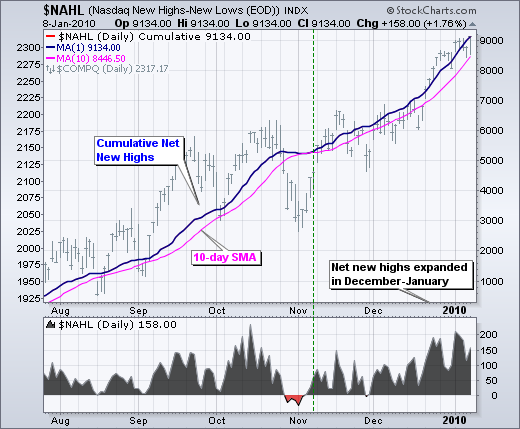
With the advance over the last 3-4 weeks, Net New Highs expanded to their highest levels since October. Net New Highs equals new 52-week highs less new 52-week lows. The bulls have a clear edge when Net New Highs are positive and rising. Conversely, the bears have...
READ MORE
MEMBERS ONLY
Evidence remains bullish
by Arthur Hill,
Chief Technical Strategist, TrendInvestorPro.com
The bulk of the medium-term evidence remains bullish for stocks. Commentary featuring some of these indicators can be found in the Market Message later today.
There is a brief run down of the 12 indicator groups after the jump. Updated breadth charts can be found on the breadth charts...
READ MORE
MEMBERS ONLY
QQQQ holds Ichimoku support
by Arthur Hill,
Chief Technical Strategist, TrendInvestorPro.com
The strength of the current rally can be seen with QQQQ and the Ichimoku cloud indicator, which marks a support zone. Notice how QQQQ bounced near the top of the cloud in July and in the middle of the cloud in early November. Cloud support is currently in the 42....
READ MORE
MEMBERS ONLY
SPY chart update
by Arthur Hill,
Chief Technical Strategist, TrendInvestorPro.com
As one may have guessed, there is no change in SPY. I am, however, providing updated daily and 60-minute charts. On the daily chart, SPY continued its January run with a close above 114 for the first time since September 2008. January is getting off to a good start...
READ MORE
MEMBERS ONLY
DELL enters gap zone
by Arthur Hill,
Chief Technical Strategist, TrendInvestorPro.com
With a pretty nice advance the last 4-5 weeks, DELL returned to the gap zone and retraced 62% of its prior decline. Resistance in this area is becoming apparent with four red candlesticks over the last eight days.
Click this chart for details...
READ MORE
MEMBERS ONLY
Waiting on the employment report
by Arthur Hill,
Chief Technical Strategist, TrendInvestorPro.com
There is no change on the daily or 60-minute charts, both of which are currently bullish. SPY has been up 14 of the last 19 trading days with the ETF moving from ~109 to ~114 over this four week period (up ~4.5% since December 9th). Even though one...
READ MORE
MEMBERS ONLY
BOOM breaks resistance with volume
by Arthur Hill,
Chief Technical Strategist, TrendInvestorPro.com
Dynamic Materials (BOOM) broke through resistance with a high volume surge over the last three days. In addition, the pattern from October to December looks like an inverse head-and-shoulders with neckline resistance around 21....
READ MORE
MEMBERS ONLY
No change in SPY
by Arthur Hill,
Chief Technical Strategist, TrendInvestorPro.com
There is no change in my SPY analysis, but I will post updated daily and 60-minute charts for your viewing pleasure. I will post a Market Message commentary later this afternoon....
READ MORE
MEMBERS ONLY
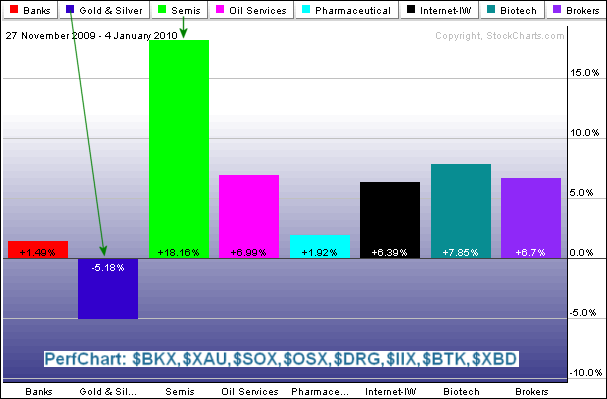
Semis lead industry groups
by Arthur Hill,
Chief Technical Strategist, TrendInvestorPro.com
The Perfchart below shows eight industry groups over the last five weeks (25 trading days). Semis ($SOX) are by far the strongest group. Gold & Silver ($XAU) represent the weakest group. It is also notable that Banks ($BKS) are lagging the other advancing groups.
Click this chart for details...
READ MORE
MEMBERS ONLY
Charts of Interest
by Arthur Hill,
Chief Technical Strategist, TrendInvestorPro.com
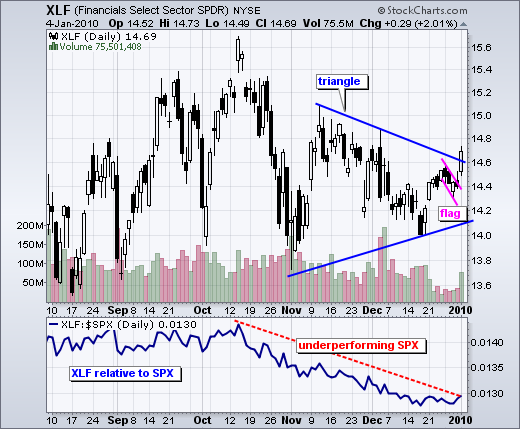
AMGN, ANF, DRYS, GERN, GT, IGT, MOT, S , SII, SVNT, XLF, XLY...
READ MORE
MEMBERS ONLY
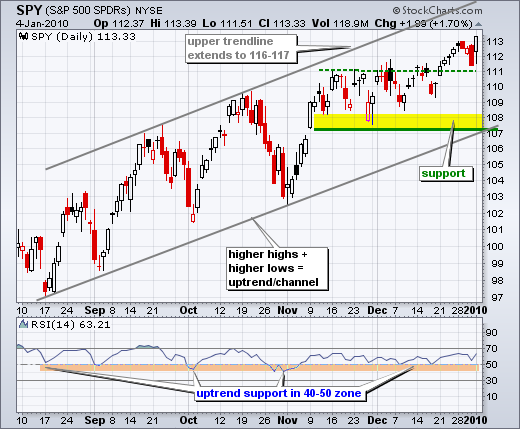
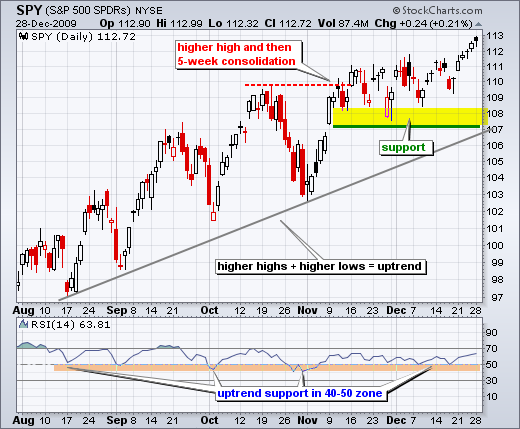
A new high for SPY
by Arthur Hill,
Chief Technical Strategist, TrendInvestorPro.com
With another new 52-week high, SPY affirmed the underlying uptrend. The ETF broke resistance around 111 in late December and this breakout held the first day of 2010. A rising price channel has taken shape over the last five months. I am using the upper trendline extension for an...
READ MORE
MEMBERS ONLY
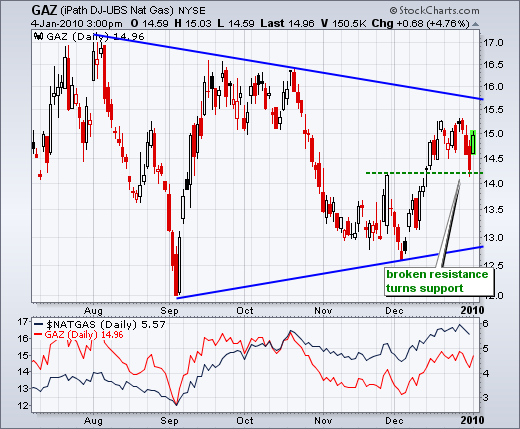
Cold weather lifts Gaz
by Arthur Hill,
Chief Technical Strategist, TrendInvestorPro.com
The iPath Natural Gas ETF ($GAZ) surged over 4% after a cold front slammed the Northeast. On the chart below, notice that GAZ broke resistance in mid December and broken resistance then turned into support.
Click this image for a live chart....
READ MORE
MEMBERS ONLY
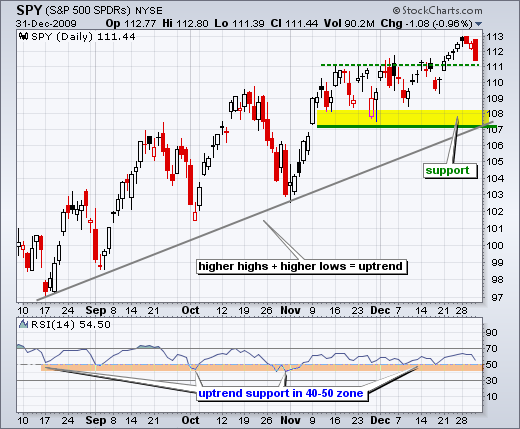
SPY hits first support zone
by Arthur Hill,
Chief Technical Strategist, TrendInvestorPro.com
SPY affirmed its uptrend with a break above consolidation resistance at 111 just before Christmas and a new 52-week high last week. The ETF was holding above 112 on New Year's Eve, but late selling pressure pushed SPY below 111.5 by the close. Even though a...
READ MORE
MEMBERS ONLY
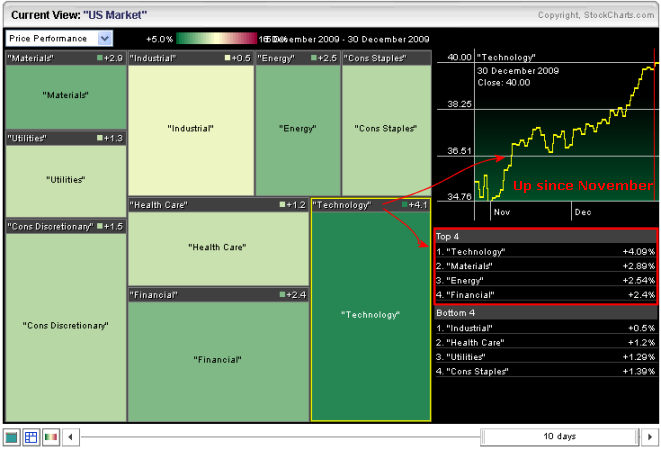
Techs lead the way
by Arthur Hill,
Chief Technical Strategist, TrendInvestorPro.com
The technology sector has led the market higher over the last 10 days. Using the slider at the bottom, the Sector Market Carpet is set to show price performance over the last 10 days. Technology is the greenest of the nine sectors - followed by materials, energy and financials.
Click this...
READ MORE
MEMBERS ONLY
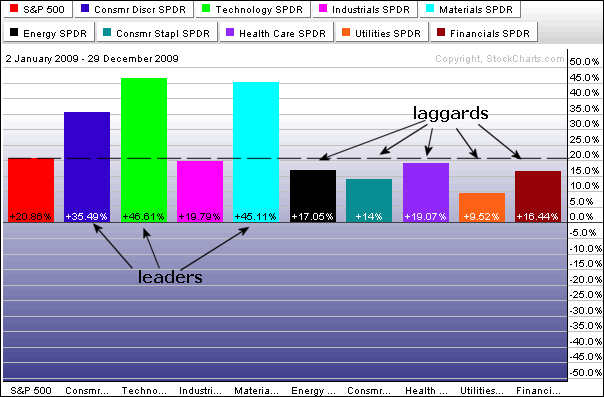
Sector winners for 2009
by Arthur Hill,
Chief Technical Strategist, TrendInvestorPro.com
All sectors were up for the year, but some were up more than others. In fact, of the nine sectors, only three outperformed the S&P 500 over the last 12 months: consumer discretionary, technology and materials. The remaining six sectors were up less than the S&P...
READ MORE
MEMBERS ONLY
SPY stalls after 5-day surge
by Arthur Hill,
Chief Technical Strategist, TrendInvestorPro.com
After a five day surge from 110 to 113, the S&P 500 ETF (SPY) took a breather on Tuesday with a small decline. SPY was trading in positive territory in the afternoon, but got hit with a late sell-off that pushed prices into negative territory. A small...
READ MORE
MEMBERS ONLY
Evidence remains bullish
by Arthur Hill,
Chief Technical Strategist, TrendInvestorPro.com
As the market summary table shows, the bulk of the evidence is firmly bullish. In fact, the Nasdaq AD Line is the only negative out there right now and the table is almost all green. The weight of the evidence has favored the bulls since inception (September). At +11, the...
READ MORE
MEMBERS ONLY
Tuesday video features...
by Arthur Hill,
Chief Technical Strategist, TrendInvestorPro.com
-Evidence remains bullish
-Net New Highs expand in December
-NYSE AD Line hits 52-week high
-Nasdaq AD Volume Line hits 52-week high
-McClellan Oscillators surge above 50
-Bullish Percent Indices move higher
-Volatility indices move to new lows
-Trend and momentum are bullish
-Offensive sectors show strength overall...
READ MORE
MEMBERS ONLY
December is for Dollars
by Arthur Hill,
Chief Technical Strategist, TrendInvestorPro.com
The Perfchart below shows the DB Dollar Bullish ETF (UUP) with nine other currency ETFs. Even though the Dollar is still down for the year, it is up around 4% for December. The Euro and Yen, which represent our two biggest trading partners, are down the most.
Click this chart...
READ MORE
MEMBERS ONLY
Not many sellers out there
by Arthur Hill,
Chief Technical Strategist, TrendInvestorPro.com
There is no change in SPY as the ETF edged higher on Monday. Trading remains thin, but there are still more buyers than sellers out there. Even though low volume levels, overbought conditions and sustainability may be a concern, there can be no turn until selling pressure overcomes buying pressure....
READ MORE
MEMBERS ONLY
Shanghai leading at yearend
by Arthur Hill,
Chief Technical Strategist, TrendInvestorPro.com
Even though year has a few days left, the Shanghai Composite ($SSEC) is one of the top performing indices in 2009. The Perfchart below compares the performance of this Chinese index against six other major indices. The Australian All Ords Index ($AORD) is a distant second and the S&...
READ MORE
MEMBERS ONLY
Intermarket Update: dollar, gold, oil, bonds
by Arthur Hill,
Chief Technical Strategist, TrendInvestorPro.com
-Bonds breakdown as stocks hit new high
-Dollar getting short-term overbought
-Gold finds support near broken resistance
-Oil recovers after early December drop
-Bonds break support with sharp decline
*****************************************************************
Dollar getting short-term overbought
After a big surge the last four weeks, the US Dollar Index ($USD) is short-...
READ MORE
MEMBERS ONLY
A 52-week high for SPY
by Arthur Hill,
Chief Technical Strategist, TrendInvestorPro.com
Stocks moved higher with a classic Santa Claus rally last week and the bulls remain in control. Techs and small-caps led the rally as QQQQ and IWM advanced around 5% in the last five trading days. Though not as strong, the S&P 500 ETF (SPY) advanced over...
READ MORE
MEMBERS ONLY
Glancing at the sectors
by Arthur Hill,
Chief Technical Strategist, TrendInvestorPro.com
The CandleGlance sector page provides an easy means to see all eight Sector SPDRs on one page. One can identify sectors hitting new highs (leading) and sector trading below their prior highs (lagging). CandleGlance groups are also good candlestick spotting.
Click this chart for details...
READ MORE