MEMBERS ONLY
SPY gaps down from resistance
by Arthur Hill,
Chief Technical Strategist, TrendInvestorPro.com
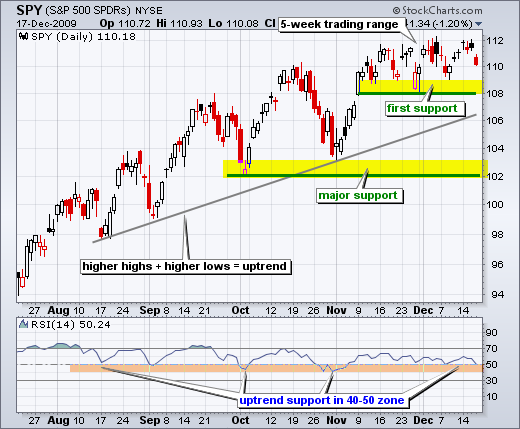
SPY gapped down from trading range resistance and is currently near the mid point of the 5-week high-low range. This area could offer short-term support. The range low is 108.12, the range high is 112.38 and the mid point is 110.25. SPY closed at 110.18 on...
READ MORE
MEMBERS ONLY
GE bucks the market
by Arthur Hill,
Chief Technical Strategist, TrendInvestorPro.com
All of the major stock indices were down Thursday afternoon, but General Electric (GE) was bucking the downdraft with a modest gain. The stock opened weak, but rallied above its prior high in the afternoon. Should current level holds, the stock would form a bullish engulfing near support.
Click this...
READ MORE
MEMBERS ONLY
SPY stalls near resistance
by Arthur Hill,
Chief Technical Strategist, TrendInvestorPro.com
As one might expect, there is no change in the short-term or medium-term trend. SPY gapped up five days ago and formed five indecisive candlesticks. There has been little movement from open to close. Post-open price action has been choppy as the ETF trades near its Nov-Dec highs. Not only...
READ MORE
MEMBERS ONLY
A tough December for energy and gold
by Arthur Hill,
Chief Technical Strategist, TrendInvestorPro.com
The Commodity Groups Perfchart shows the GS Precious Metals Index ($GPX) and the GS Energy Index ($GJX) are both down over 6% so far this month. Of the five commodity groups, the GS Industrial Metals Index ($GYX) and GS Agriculture Index ($GKX) are holding up the best with small gains....
READ MORE
MEMBERS ONLY
Waiting on the Fed
by Arthur Hill,
Chief Technical Strategist, TrendInvestorPro.com
There is no change in the short-term or medium-term trends for the S&P 500 ETF (SPY). The Fed meeting ends today with an announcement expected at 2:15 PM ET. We can expect some volatile swings just before and after the announcement with volatility subsiding around 3PM. It...
READ MORE
MEMBERS ONLY
Euro breaks November low
by Arthur Hill,
Chief Technical Strategist, TrendInvestorPro.com
The Euro ETF (FXE) extended its decline this week and broke below its November low. FXE has been under intense selling pressure since the big plunge below 150 two weeks ago. In fact, selling pressure has been so intense that it looks like a medium-term downtrend has started.
Click this...
READ MORE
MEMBERS ONLY
Tuesday video features...
by Arthur Hill,
Chief Technical Strategist, TrendInvestorPro.com
-Fed, seasonality and options
-A new closing high for SPY
-There go small-caps
-Key sectors hit new highs
-Finance sector continues to stall
-Regional Bank SPDR hits Resistance
-AAPL, AES, BWA, DELL, DFS, FWLT,
JPM, MS, PDCO, PENN, STX, XRX
-Click here for the video page...
READ MORE
MEMBERS ONLY
Stock charts of interest
by Arthur Hill,
Chief Technical Strategist, TrendInvestorPro.com
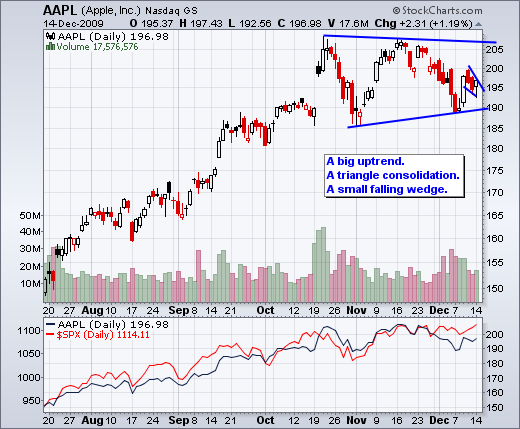
AAPL, AES, BWA, DELL, DFS, FWLT, JPM, MS, PDCO, PENN, STX, XRX...
READ MORE
MEMBERS ONLY
Fed, seasonality and options
by Arthur Hill,
Chief Technical Strategist, TrendInvestorPro.com
The Fed starts its two day meeting today with its policy statement scheduled for 2:15PM ET on Wednesday. There is usually some above average volatility just before and after the Fed announcement. With volume levels running relatively low and option expiration pending, this volatility could be exaggerated. Things usually...
READ MORE
MEMBERS ONLY
A new closing high for SPY
by Arthur Hill,
Chief Technical Strategist, TrendInvestorPro.com
Even though post-open price action has been indecisive the last three days, the S&P 500 ETF (SPY) managed to move higher and close at its highest closing level for 2009. This also means that SPY finally closed above the closing highs from the consolidation. Technically, we have a...
READ MORE
MEMBERS ONLY
There go small-caps
by Arthur Hill,
Chief Technical Strategist, TrendInvestorPro.com
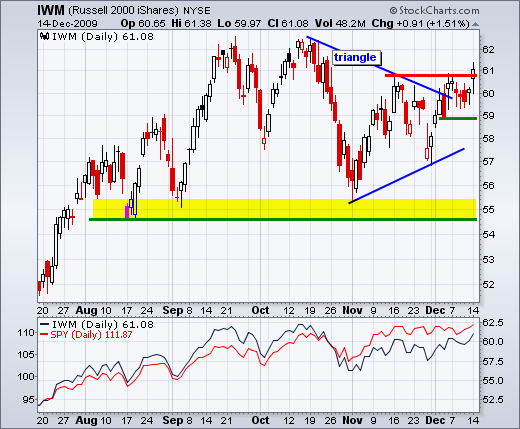
I first wrote about the Russell 2000 ETF (IWM) and the January effect on December 1st. To recap: the January effect is the historical tendency for small-caps to outperform large-caps from mid December to end January. IWM was firming in the 57-58 area on December 1st and I drew a...
READ MORE
MEMBERS ONLY
Key sectors hit new highs
by Arthur Hill,
Chief Technical Strategist, TrendInvestorPro.com
Three of the four offensive sectors moved to new reaction highs. The Industrials SPDR (XLI) led the charge on Monday with a 1.35% gain on the day. The Consumer Discretionary SPDR (XLY), which is the most economically sensitive sector, hit 30 for the first time since September 2008. The...
READ MORE
MEMBERS ONLY
Finance sector continues to stall
by Arthur Hill,
Chief Technical Strategist, TrendInvestorPro.com
The Financials SPDR (XLF) is also one of the four offensive sectors, but it continues to lag and gets is own special entry. Despite news the Bank of America and Citigroup will repay their TARP money, XLF failed to advance with the rest of the market. XLF broke below the...
READ MORE
MEMBERS ONLY
Divergences fail to deter the Dow
by Arthur Hill,
Chief Technical Strategist, TrendInvestorPro.com
Despite numerous bearish divergences in MACD since August, the Dow continues pushing to new highs. With today's close above 10500, the Dow hit another 52-week closing high today. While there will likely be a bearish divergence when the trend finally ends, it is clear that a strong uptrend...
READ MORE
MEMBERS ONLY
Intermarket chart page updated
by Arthur Hill,
Chief Technical Strategist, TrendInvestorPro.com
-A trend reversal for the greenback
-Gold hits first key retracement
-Oil gets an oversold bounce
-Bonds plunge to key support zone
- Intermarket chart page updated
-Further commentary after the jump
With its biggest eight-day surge since March, the US Dollar Index ($USD) broke resistance at 76 and RSI...
READ MORE
MEMBERS ONLY
SPY: Minding the gap
by Arthur Hill,
Chief Technical Strategist, TrendInvestorPro.com
There is no real change in the medium-term or short-term situation for SPY. First and foremost, the medium-term trend remains up as SPY recorded a new high for 2009 this month. Second, SPY is consolidating near the October high and holding its gains. Bears may point to lack of follow...
READ MORE
MEMBERS ONLY
NYSE AD Line hits new high
by Arthur Hill,
Chief Technical Strategist, TrendInvestorPro.com
Don't look now, but the NYSE AD Line hit a new 52-week high this week. The AD Line is a cumulative measure of Net Advances (advances less declines). It rises when there are more advances and falls when there are more declines. This week's new high...
READ MORE
MEMBERS ONLY
Friday video features...
by Arthur Hill,
Chief Technical Strategist, TrendInvestorPro.com
-Gap number 4 for SPY
-Uninspiring two-day breadth
-Bulk of evidence remains bullish
-Bullish% Index divergences
-NYSE AD Line hits new high
-Net New Highs remain positive
-Volatility Remains Low
-A clear uptrend for DIA
-TLT fails to hold break
-A momentum breakout for the Dollar
-Click here for the...
READ MORE
MEMBERS ONLY
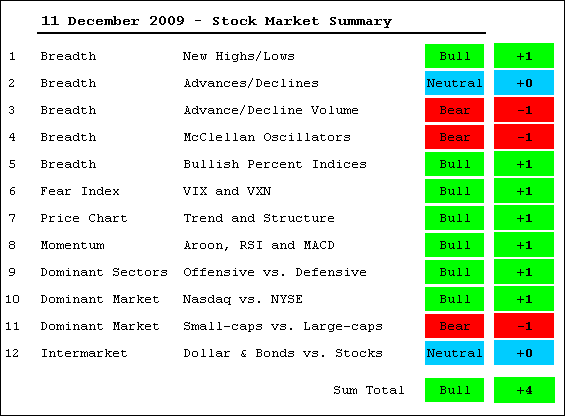
Bulk of evidence remains bullish
by Arthur Hill,
Chief Technical Strategist, TrendInvestorPro.com
With stocks trading flat over the last 4-5 weeks, not much has changed for the stock market. There are still more new 52-week highs than new 52-week lows. The NYSE AD Line recorded a new high for the year. Volatility remains subdued as the VIX and VXN test their October...
READ MORE
MEMBERS ONLY
Bullish% Index Divergences
by Arthur Hill,
Chief Technical Strategist, TrendInvestorPro.com
The Bullish Percent Indices tell us the percentage of stocks in an index that have Point & Figure buy signals. There are many ways to interpret these numbers. Analysts can look at the absolute numbers. In general, readings above 50% favors the bulls, while reading below 50% favor the bears....
READ MORE
MEMBERS ONLY
Breadth charts updated
by Arthur Hill,
Chief Technical Strategist, TrendInvestorPro.com
-Nasdaq AD Line: a serious bearish divergence
-Nasdaq AD Volume Line: approaching Sep-Oct highs
-Nasdaq McClellan Oscillator: up thrusts have been weak
-Nasdaq Net New Highs: more new 52-week highs than new 52-week lows
-NYSE AD Line: hit a new high this week
-NYSE AD Volume Line: remains below Sep-Oct...
READ MORE
MEMBERS ONLY
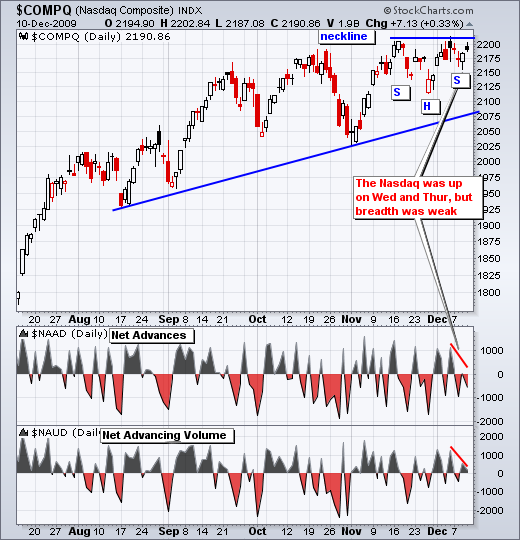
Uninspiring breadth
by Arthur Hill,
Chief Technical Strategist, TrendInvestorPro.com
The Nasdaq moved higher the last two days, but Net Advances were barely positive on Wednesday and negative on Thursday. Net Advancing Volume was barely positive on both days. Even though the gains in the Nasdaq were small, weak breadth reflected narrow participation that could undermine the advance. On the...
READ MORE
MEMBERS ONLY
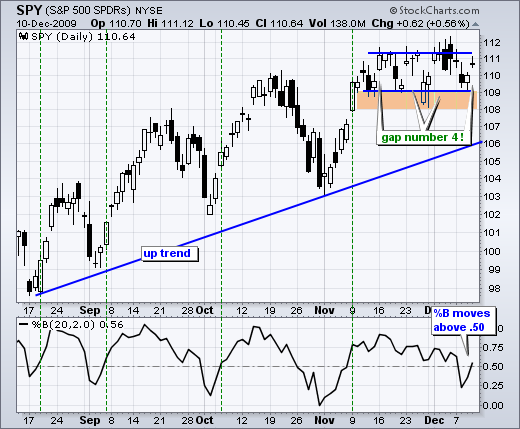
Gap number 4 for SPY
by Arthur Hill,
Chief Technical Strategist, TrendInvestorPro.com
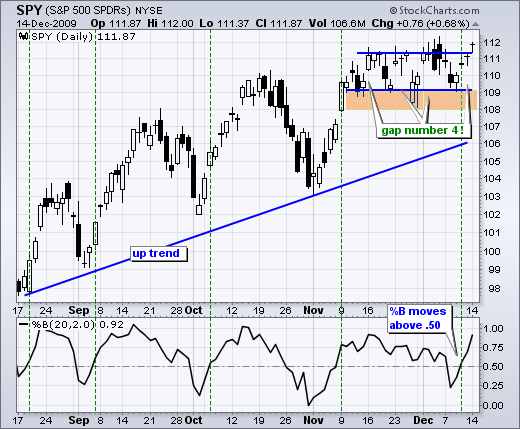
For the fourth time in five weeks, the S&P 500 ETF (SPY) held support with a gap up. Here's what we know. The medium-term trend is up, SPY is consolidating, support is holding and seasonality favors the bulls (especially from December 21st). Keep seasonality in mind,...
READ MORE
MEMBERS ONLY
Citrix finds support
by Arthur Hill,
Chief Technical Strategist, TrendInvestorPro.com
After a gap and sharp decline in October, Citrix (CTXS) found support near its resistance breakout (~37). Bounces in early November and early December confirm support in the 37-38 area. With a triangle consolidation taking shape the last six weeks, the direction of the breakout holds the key to the...
READ MORE
MEMBERS ONLY
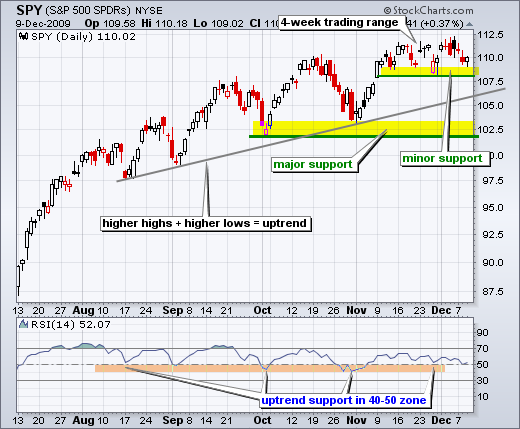
SPY firms at range support
by Arthur Hill,
Chief Technical Strategist, TrendInvestorPro.com
The major index ETFs remain in medium-term uptrends and short-term trading ranges. After a 3-4 day pullback, SPY firmed near the bottom of its four week trading range. The whole world is watching range support for a break that would be negative. Technically, a support break here would argue for...
READ MORE
MEMBERS ONLY
AOL finishes with a bang
by Arthur Hill,
Chief Technical Strategist, TrendInvestorPro.com
AOL Inc (AOL/WI) returned to the big board after a nine year hiatus. The stock was already trading "when issued" (WI) before today. AOL/WI started the day down, traded flat around 23 throughout the day and then surged with huge volume at the end of the...
READ MORE
MEMBERS ONLY
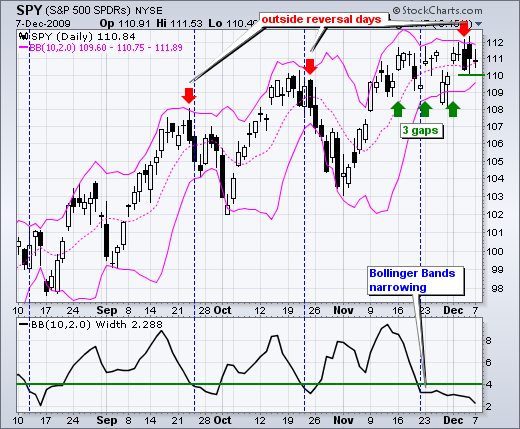
SPY fills the third gap
by Arthur Hill,
Chief Technical Strategist, TrendInvestorPro.com
SPY moved back below 110 to fill the third gap, but this is not enough to affect the medium-term uptrend. After surging to a new reaction high in mid November, the ETF has been locked in a four point trading range since November 10th. This range extends from 108 to...
READ MORE
MEMBERS ONLY
Marriott forms harami at resistance
by Arthur Hill,
Chief Technical Strategist, TrendInvestorPro.com
For the second time in four weeks, Marriott (MAR) formed a bearish harami. The first harami marked a reaction high just below 28. This second harami formed around 27 for a possible lower high. Also notice that the trendline extending down from the October high marks resistance there. You can...
READ MORE
MEMBERS ONLY
Stocks: Bearish Setups
by Arthur Hill,
Chief Technical Strategist, TrendInvestorPro.com
Comerica (CMA), Ebay (EBAY) and Joy Global (JOYG).
Comerica (CMA) fails resistance test. After breaking support with a sharp decline in October, CMA rebounded and never came close to its October high. Broken support around 29.5 turned into resistance and the stock formed a bearish engulfing pattern on Thursday....
READ MORE
MEMBERS ONLY
Stocks: Bullish Setups
by Arthur Hill,
Chief Technical Strategist, TrendInvestorPro.com
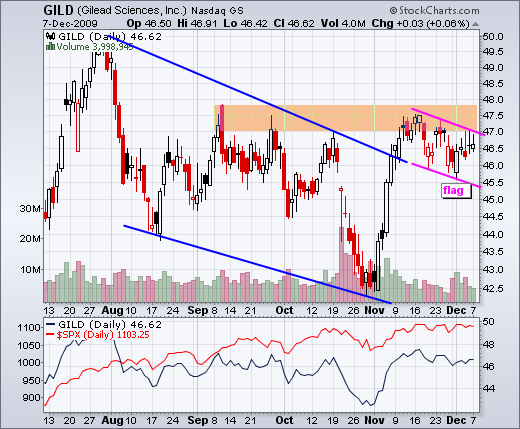
Gilead (GILD), Kroger (KR) and NY Times (NYT)
Gilead (GILD) forms a bull flag. After a big surge on good volume in early November, GILD consolidated with a falling flag over the last few weeks. There was a bullish reversal day last Monday, but no follow through with a breakout....
READ MORE
MEMBERS ONLY
XLE and XLF: the weakest sectors
by Arthur Hill,
Chief Technical Strategist, TrendInvestorPro.com
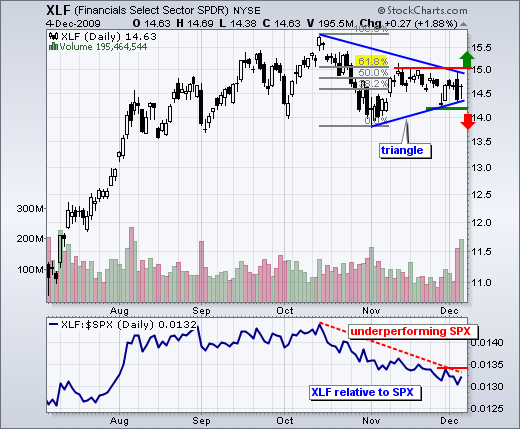
Although the energy and the finance sectors are not related, both are clearly the weakest of the nine sector SPDRs over the last two months. The Financials SPDR (XLF) is more important to the overall market. You know the drill. While SPY moved to a new reaction high in November,...
READ MORE
MEMBERS ONLY
SPY: consolidation within uptrend
by Arthur Hill,
Chief Technical Strategist, TrendInvestorPro.com
There is a difference between actual weakness and flat trading, especially within a bigger uptrend. I think we can all agree that SPY has been trending higher since early July, perhaps even since mid March. The ETF first crossed above 111 on November 16th and closed just below 111 on...
READ MORE
MEMBERS ONLY
Under-invested in an uptrend
by Arthur Hill,
Chief Technical Strategist, TrendInvestorPro.com
What makes me think under-invested portfolio managers could keep the market buoyant into yearend? The following quote comes from Jeffrey Saut, Chief Investment Strategist at Raymond James:
Net long positions at professional money management firms remain in the 50-60% range, which is well below the 70-75% level reached at the...
READ MORE
MEMBERS ONLY
XLU forges a 52-week high
by Arthur Hill,
Chief Technical Strategist, TrendInvestorPro.com
Seven of the nine sector SPDRs recorded new 52-week highs in November or December. Among those, the Utilities SPDR (XLU) broke resistance from its 2009 highs with a surge above 31 this month. The ETF is short-term overbought after a 10% advance the last six weeks, but the long-term trend...
READ MORE
MEMBERS ONLY
SPY battles 111
by Arthur Hill,
Chief Technical Strategist, TrendInvestorPro.com
Despite closing up on the day, I was not impressed with Friday's price action. A surprisingly small decline (-11K) in non-farm payrolls prompted the bulls into action as SPY opened around 111.84. These gains were fleeting as SPY declined to 110.04 in late morning. Even though...
READ MORE
MEMBERS ONLY
Dollar, gold, oil and bonds
by Arthur Hill,
Chief Technical Strategist, TrendInvestorPro.com
-Dollar surges as bonds and gold plunge
-The Dollar is on the verge of a breakout and trend reversal
-Gold moves into corrective mode
-Extended channel defines downtrend in oil
-Bonds remain in overall uptrend despite last week's plunge
-Inter-market charts updated
Dollar*********************************************************
The US Dollar Index ($USD)...
READ MORE
MEMBERS ONLY
Finance sector still lagging
by Arthur Hill,
Chief Technical Strategist, TrendInvestorPro.com
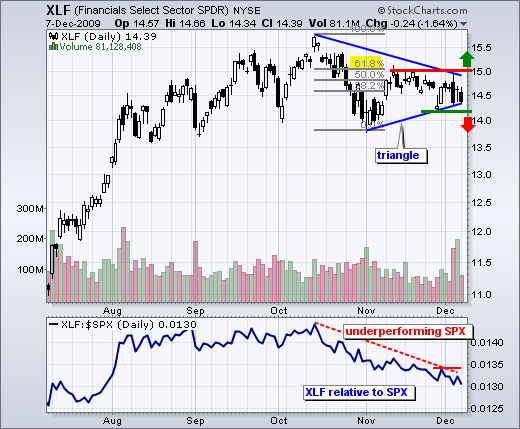
The finance sector continues to underperform the overall market. While the S&P 500 and Dow are consolidating near 52-week highs, the Financials SPDR (XLF) remains well below its October high and shows relative weakness. The bottom indicator contains the price relative, which is the XLF:$SPX ratio. XLF...
READ MORE
MEMBERS ONLY
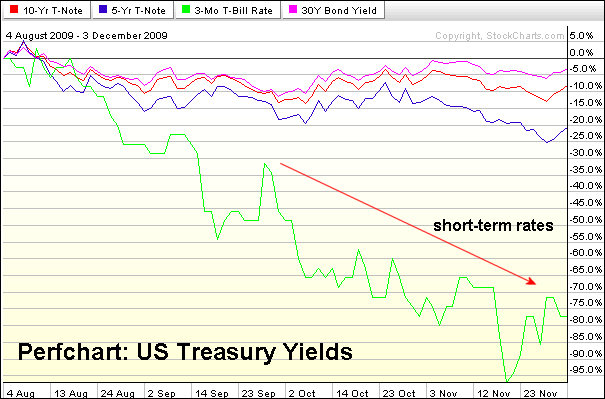
Short-term rates fall sharply
by Arthur Hill,
Chief Technical Strategist, TrendInvestorPro.com
The US Treasury Yield Perfchart shows yields falling since early August. In particular, short-term rates (green line) have fallen sharply in the last three months. Treasuries rise when rates fall so these declines suggest money moving into Treasuries.
Click this chart for details...
READ MORE
MEMBERS ONLY
MT Evidence remains bullish
by Arthur Hill,
Chief Technical Strategist, TrendInvestorPro.com
-MT Evidence remains bullish
-Net New Highs are fewer, but still positive
-Nasdaq AD Line shows weakness in small techs
-AD Volume Lines remain below October highs
-Consumer discretionary Bullish% Index declines sharply
-Volatility remains low
-DIA and SPY consolidate near highs
-Momentum indicators still bullish overall
-Finance sector continues...
READ MORE
MEMBERS ONLY
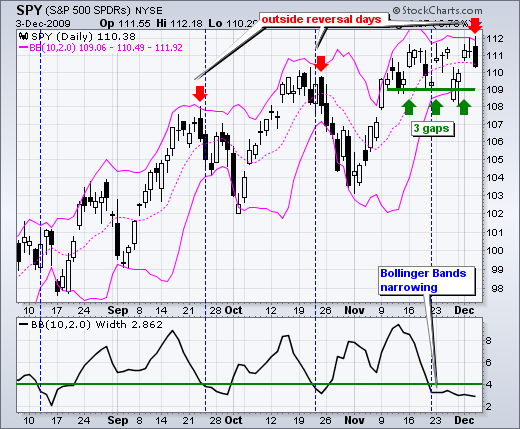
An outside reversal day for SPY
by Arthur Hill,
Chief Technical Strategist, TrendInvestorPro.com
The S&P 500 ETF (SPY) traded on either side of unchanged most of the day and then got hit with some late selling pressure in the final 20 minutes. Market participants were probably squaring positions ahead of Friday's employment report, which often produces a sizable gap...
READ MORE