MEMBERS ONLY
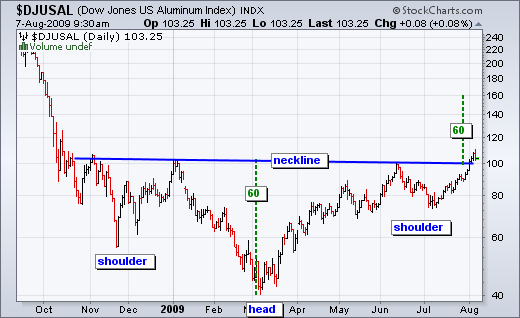
An Inverse HS for the Aluminum Index
by Arthur Hill,
Chief Technical Strategist, TrendInvestorPro.com
The DJ US Aluminum Index ($DJUSAL) traced out a massive inverse head-and-shoulders over the last nine months and broke above neckline resistance this week. With this pattern representing a large base, the breakout is bullish and targets further strength towards 140. Careful though, the index is already up over 40%...
READ MORE
MEMBERS ONLY
Financials Dominate Most Active List
by Arthur Hill,
Chief Technical Strategist, TrendInvestorPro.com
From the NYSE most active list on the stockcharts.com home page, we can see that banks take up half the list (5 of 10). Although not a bank, GE has a large financial services arm and was third on the list. Also notice that all six of these finance...
READ MORE
MEMBERS ONLY
Nasdaq Lags, But Gaps Prevail
by Arthur Hill,
Chief Technical Strategist, TrendInvestorPro.com
-Market Overview
-Stock Setups: AMZN, AZO, BA, DRI, ERTS, HAS, POT, RIMM
-Link to today's video.
-Next update will be Friday (August 7) by 7AM ET.
*****************************************************************
Market Overview
Stocks rallied on Monday with a fairly broad-based move. The major indices gained 1.5% on average and all sectors...
READ MORE
MEMBERS ONLY
Transports Near January High
by Arthur Hill,
Chief Technical Strategist, TrendInvestorPro.com
Despite rising oil prices, the Dow Transports surged on Monday with a move above 3600. This key average is now within spitting distance of its January high. Also of note, the Dow Industrials broke above its January high last month....
READ MORE
MEMBERS ONLY
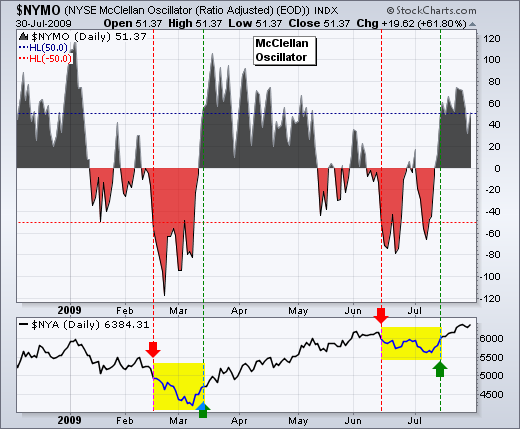
McClellan Oscillators Remain Bullish
by Arthur Hill,
Chief Technical Strategist, TrendInvestorPro.com
The McClellan Oscillators moved from bearish to bullish with the July surge in stocks. Basically, the McClellan Oscillator is the 19-day EMA of Net Advances less the 39-day EMA of Net Advances (advances less declines). As the difference of two moving averages, this indicator oscillates above/below the zero line...
READ MORE
MEMBERS ONLY
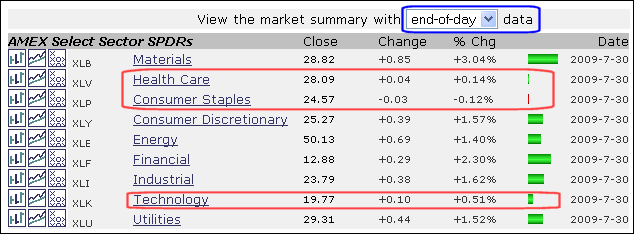
Techs Lag for a Day
by Arthur Hill,
Chief Technical Strategist, TrendInvestorPro.com
The market summary page provides an excellent overview of market performance, both end-of-day and intraday. You can change the setting at the top. Notice that materials led the market on Thursday, while healthcare, consumer staples and technology lagged. It is only one day, but relative weakness in technology should be...
READ MORE
MEMBERS ONLY
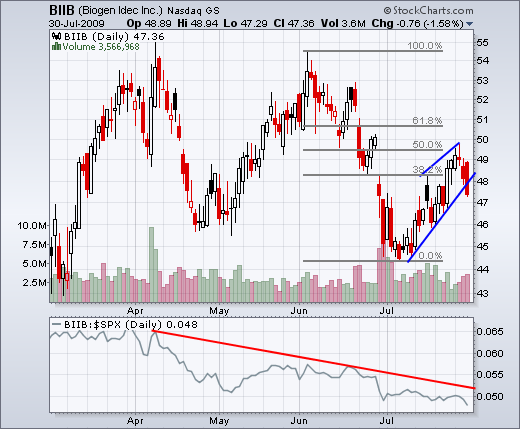
A Breakout for KEY and Weakness for ERTS
by Arthur Hill,
Chief Technical Strategist, TrendInvestorPro.com
- Charts Worth Watching: BIIB, DHR, ERTS, GPS, HAS, JBHT, KEY, LMT, LUB, MDT
- Link to today's video.
- Next update will be Tuesday (August 4) by 7AM ET.
*****************************************************************
After retracing 50% of its prior decline, Biogen Idec (BIIB) broke wedge support with a sharp decline over...
READ MORE
MEMBERS ONLY
Minding Gaps and Short-Term Momentum
by Arthur Hill,
Chief Technical Strategist, TrendInvestorPro.com
- Medium-term Outlook Remains Bullish
- Short-term Situation is Overbought
- Late Selling Pressure
- Mind the Gap
- 60-minute Momentum
- Breadth Overview
- AAII Survey Flips
- A look at Bonds and the Dollar
-Link to today's video.
- Next update will be Tuesday (August 4)...
READ MORE
MEMBERS ONLY
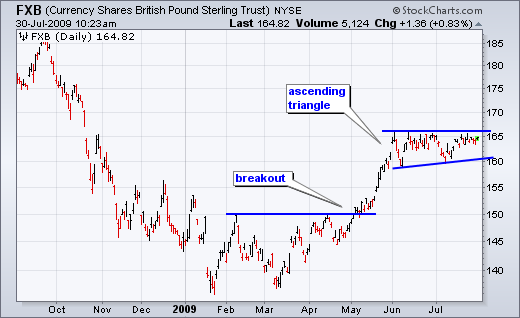
Pound ETF Forms Ascending Triangle
by Arthur Hill,
Chief Technical Strategist, TrendInvestorPro.com
After a breakout and surge from March to May, the British Pound ETF (FXB) consolidated with an ascending triangle over the last two months. Notice how FXB hit resistance at 165 a number of times since early June. Also notice that the early July reaction low is higher than the...
READ MORE
MEMBERS ONLY
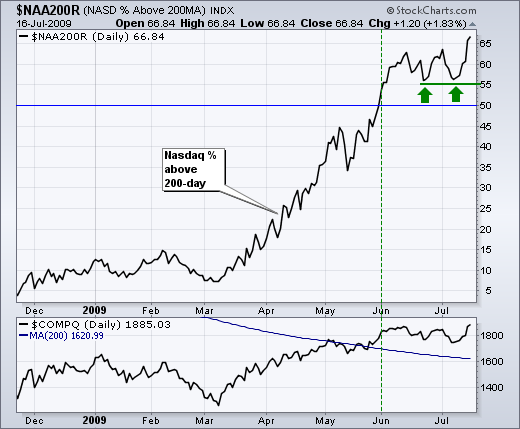
Nasdaq is 10% Above 200-day EMA
by Arthur Hill,
Chief Technical Strategist, TrendInvestorPro.com
In less than 9 months, the Nasdaq has gone from being 40% below its 200-day EMA to being 10% above its 200-day EMA. Talk about a huge swing. The percentage difference was determined using the Percentage Price Oscillator (1,200,1). This setting reflects the percentage difference between the 1-day...
READ MORE
MEMBERS ONLY
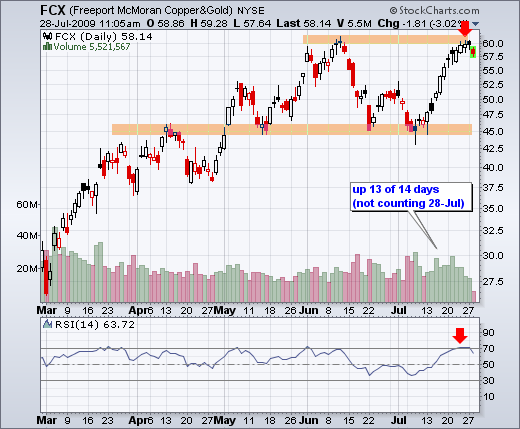
Freeport McMoran Hits the June High
by Arthur Hill,
Chief Technical Strategist, TrendInvestorPro.com
Freeport McMoran Copper & Gold (FCX) kept pace with the Nasdaq by advancing 13 of the last 14 days. In the process, the stock surged to its June high, which may offer resistance. Also notice that RSI moved above 70 to become overbought.
Click this chart to see more details....
READ MORE
MEMBERS ONLY
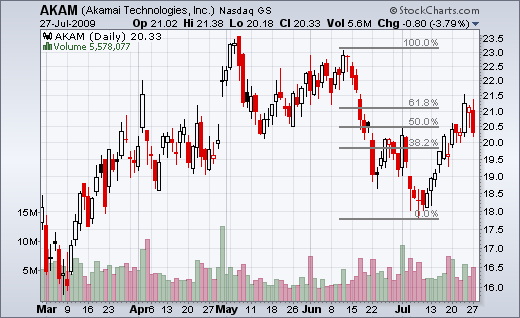
AKAM Hits Retracement - CHRW Challenges Resistance
by Arthur Hill,
Chief Technical Strategist, TrendInvestorPro.com
- Charts Worth Watching: AKAM, AZO, BA, CHRW, DHR, DRI, ERTS, FCX, KEY, PFCB, UTX
- Link to today's video.
- Next update will be Friday (July 31) by 7AM ET.
*****************************************************************
Akamai Tech (AKAM) hits key retracement with a harami. With a surge back above 21, AKAM retraced...
READ MORE
MEMBERS ONLY
Stocks Stay Bullish as Dollar Tests June Low
by Arthur Hill,
Chief Technical Strategist, TrendInvestorPro.com
- Stocks remain medium-term bullish
- Short-term overbought conditions persist
- Dollar firms near June low
- Gold stalls at retracement
- Oil forms rising wedge
- TLT forms narrow range days.
- Link to today's video.
- Charts Worth Watching will be posted around9:30AM.
- Next...
READ MORE
MEMBERS ONLY
XLF Battles Resistance
by Arthur Hill,
Chief Technical Strategist, TrendInvestorPro.com
With gains over the last few days, the Financials SPDR (XLF) is challenging an important resistance zone on the daily PnF chart. Notice that broken support (2008) around 13 turned into resistance in 2009. XLF is currently on a bullish PnF signal with a price objective around 21. A break...
READ MORE
MEMBERS ONLY
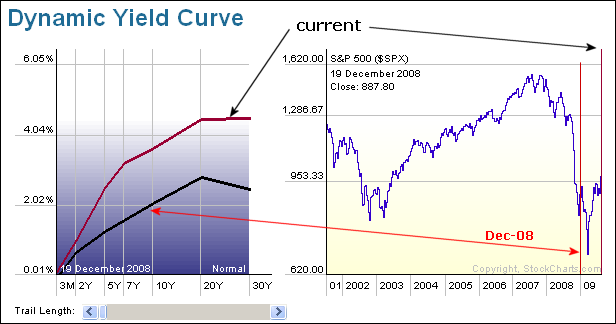
Yield Curve Remains Steep
by Arthur Hill,
Chief Technical Strategist, TrendInvestorPro.com
The Dynamic Yield Curve shows two plots over the last eight months. The black line shows the yield curve in December, while the maroon line shows the current yield curve. Today's yield curve is much steeper because 3-month rates are virtually unchanged since December, but longer rates have...
READ MORE
MEMBERS ONLY
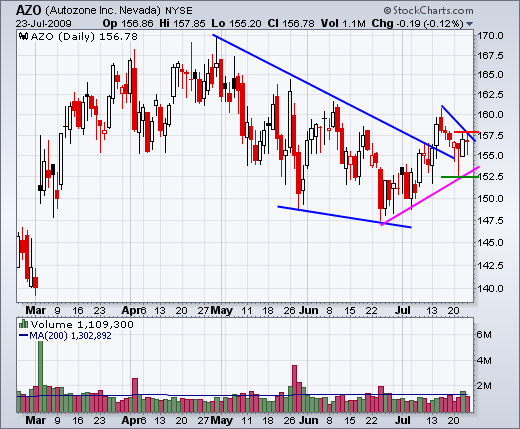
FITB and USB Break Resistance
by Arthur Hill,
Chief Technical Strategist, TrendInvestorPro.com
- Charts Worth Watching: AZO, BBT, FITB, HBAN, NEM, NKE, QLGC, QSII, S , SYK, USB, WAG
- Link to today's video.
- Next update will be Tuesday (July 28) by 7AM ET.
*****************************************************************
Autozone (AZO) broke wedge resistance with a surge in early July and then pulled back to...
READ MORE
MEMBERS ONLY
XLF Breaks Wedge & KRE Surges off July Low
by Arthur Hill,
Chief Technical Strategist, TrendInvestorPro.com
- Staying Overbought
- Earnings Driving the Advance
- XLF Breaks Flag Resistance
- KRE Surges off July Low
- Bonds Falter as Stocks Surge
- Link to today's video.
- Stock setups video around 9AM ET.
- Next update will be Tuesday (July 28) by 7AM ET....
READ MORE
MEMBERS ONLY
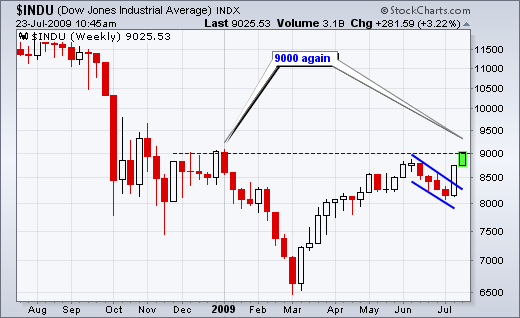
Dow Moves Above 9000
by Arthur Hill,
Chief Technical Strategist, TrendInvestorPro.com
For the first time since January, the Dow Industrials moved above the 9000 level. It took around two months to fall from 9000 to 6500 and then 4-5 months to get back above 9000 (March to July). There is potential resistance in this area, but the trend remains up....
READ MORE
MEMBERS ONLY
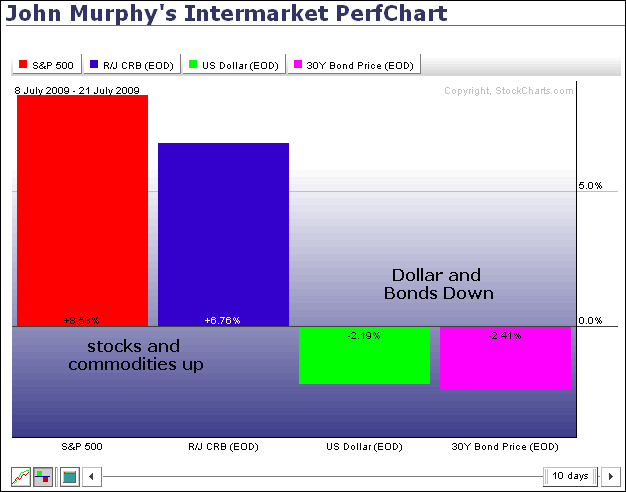
Stocks and Commodities Rise Together
by Arthur Hill,
Chief Technical Strategist, TrendInvestorPro.com
The inter-market relationship since early March remains in place. Stocks and commodities are up sharply over the last two weeks, but bonds and the Dollar are down. This relationship suggests that stock market weakness would lead to weakness in commodities, strength in bonds and strength in the Dollar....
READ MORE
MEMBERS ONLY
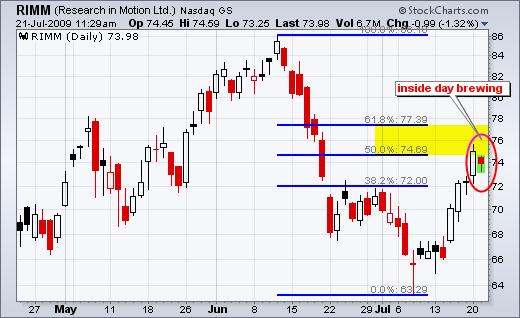
An Inside Day Brewing for RIMM
by Arthur Hill,
Chief Technical Strategist, TrendInvestorPro.com
After a long white candlestick on Monday, Research in Motion (RIMM) pulled back immediately on Tuesday with a small decline. Tuesday's trading has been within Monday's range thus far. Should this range hold, an inside day or harami would take shape. A harami is a potentially...
READ MORE
MEMBERS ONLY
XHB and IYR Break Wedge Resistance
by Arthur Hill,
Chief Technical Strategist, TrendInvestorPro.com
- Charts Worth Watching: AET, CAKE, IHF, ITB, IYR, TLT, UNH, XHB
- Link to today's video.
The next update will be Friday (July 24) by 7AM ET.
*****************************************************************
The 20+ Year Treasury ETF (TLT) is trying to firm near the 62% retracement line. TLT surged above 96 with...
READ MORE
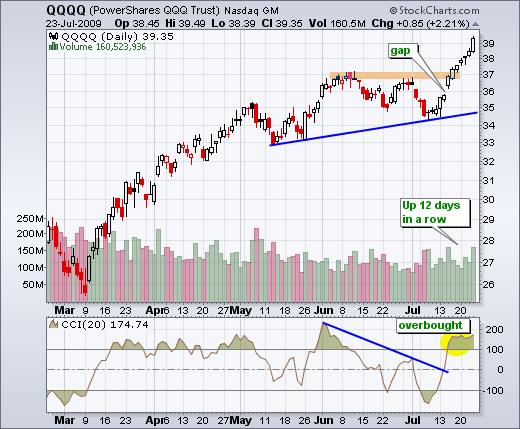
MEMBERS ONLY
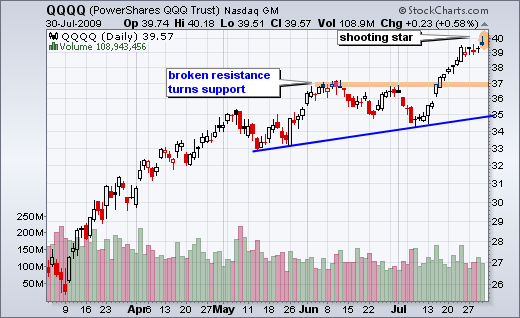
QQQQ Leads with Break above June High
by Arthur Hill,
Chief Technical Strategist, TrendInvestorPro.com
- Market Overview
- QQQQ breaks June high
- SPY hits resistance
- Stocks short-term overbought
- VIX hits new low,
- Percent above 200-day hits new high
- Net New Highs expand
- Small-caps lag large-caps.
-Link to today's video.
Chart Worth Watching will be posted around...
READ MORE
MEMBERS ONLY
NYSE AD Line Breaks June High
by Arthur Hill,
Chief Technical Strategist, TrendInvestorPro.com
The AD Line for the NYSE remains strong after a break above the June high. In fact, the AD Line is leading the NY Composite because the latter has yet to break its June high. Leadership from the AD Line is positive for the market overall. You see breadth stats...
READ MORE
MEMBERS ONLY
Majority of Stocks Still Above their 200-day SMAs
by Arthur Hill,
Chief Technical Strategist, TrendInvestorPro.com
It is hard to argue with the bulls when the vast majority of Nasdaq and NYSE stocks are trading above their 200-day SMAs. Over 66% of Nasdaq stocks are trading above their 200-day moving averages, while over 77% of NYSE stocks are trading above their 200-day moving averages. There are...
READ MORE
MEMBERS ONLY
Dow Reclaims Two Key Moving Averages
by Arthur Hill,
Chief Technical Strategist, TrendInvestorPro.com
With a surge back above 8500 this week, the Dow Industrials reclaimed the upper ground on the 50-day and 200-day moving averages. Also notice that the 50-day SMA moved above the 200-day SMA. This is also knows as a golden cross. Even though these are positive developments, keep in mind...
READ MORE
MEMBERS ONLY
Charts Worth Watching
by Arthur Hill,
Chief Technical Strategist, TrendInvestorPro.com
- Charts Worth Watching: CAKE, INTU, JCP, LEAP, MCD, PII, PSS, QSII
- Link to today's video.
- The next update will be Tuesday (July 21) by 7AM ET.
*****************************************************************
Cake edges towards resistance. With the market surge over the last four days, I would have expected bigger things...
READ MORE
MEMBERS ONLY
Market Overview
by Arthur Hill,
Chief Technical Strategist, TrendInvestorPro.com
- Market Overview: DIA, IWM, QQQQ, SPY, $VIX, $NAA200R, AAII Sentiment, AD Line and Ad Volume line
- Click here for today's video.
- The next update will be Tuesday (July 21) by 7AM ET.
*****************************************************************
Still Within Trading Ranges
Despite this week's surge, I am still...
READ MORE
MEMBERS ONLY
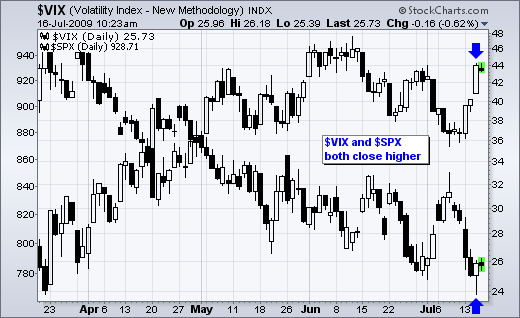
VIX and SPX Both Close Higher
by Arthur Hill,
Chief Technical Strategist, TrendInvestorPro.com
Despite a big surge in the S&P 500 on Wednesday, the S&P 500 Volatility Index ($VIX) recovered from early losses and closed higher on the day. This is unusual because the VIX normally declines during a sharp stock market advance. It is just one day though....
READ MORE
MEMBERS ONLY
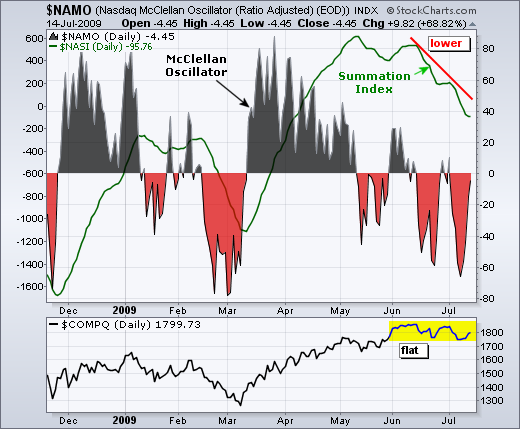
Nasdaq Summation Index Moves Lower
by Arthur Hill,
Chief Technical Strategist, TrendInvestorPro.com
Even though the Nasdaq is trading above its mid May levels, the Nasdaq Summation Index (green line) is trending lower. This breadth indicator suggests that a "stealth" correction is underway within the Nasdaq. In other words, stocks within the index are showing some weakness, but the index itself...
READ MORE
MEMBERS ONLY
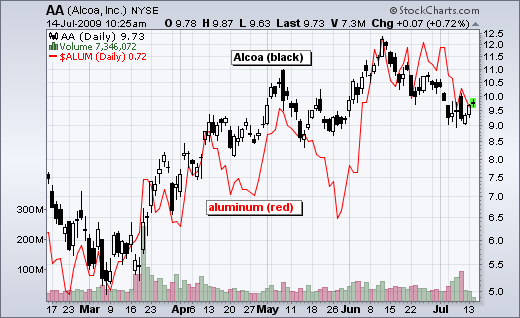
Alcoa and Aluminum
by Arthur Hill,
Chief Technical Strategist, TrendInvestorPro.com
The chart below shows Alcoa (AA) with black candlesticks and the continuous futures contract for Aluminum ($ALUM). Although not perfect, there is clearly a positive correlation between the two. Overall, both have been working their way higher since March. More recently, both peaked in early June and moved lower the...
READ MORE
MEMBERS ONLY
Charts Worth Watching
by Arthur Hill,
Chief Technical Strategist, TrendInvestorPro.com
- Charts Worth Watching: AMAT, BMY, BRK.A, CB, HOG, NBR, NSM, PII, PTEN
- Link to today's video.
- The next update will be Friday (July 17) by 7AM ET.
*****************************************************************
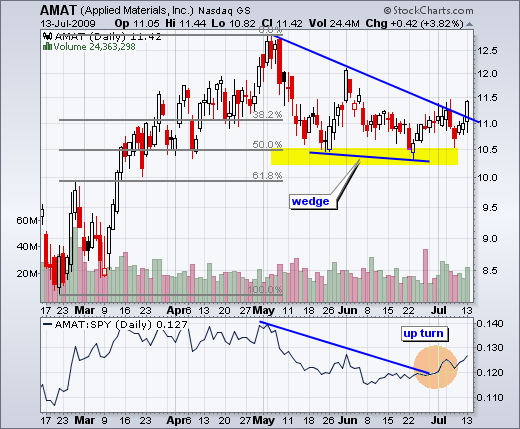
Applied Materials (AMAT) broke trendline resistance with good volume.
*****************************************************************
Bristol Meyers (BMY) firms near key retracement. Volume...
READ MORE
MEMBERS ONLY
Charts Worth Watching
by Arthur Hill,
Chief Technical Strategist, TrendInvestorPro.com
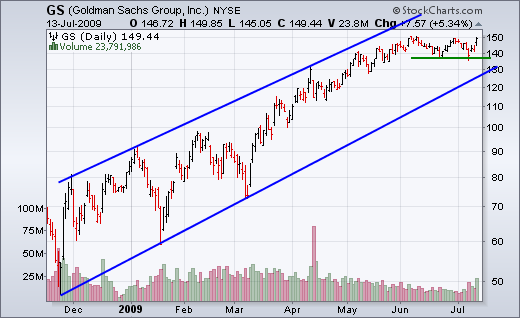
- Market Overview: SPY, GS, XLF, KRE, VIX, VXN, $NYA200R, $NAA200R
- Link to today's video.
A stock setups commentary and video will be posted around 9AM. The next update will be Friday (July 17) by 9AM ET.
*****************************************************************
As most of us know, an upgrade of Goldman Sach...
READ MORE
MEMBERS ONLY
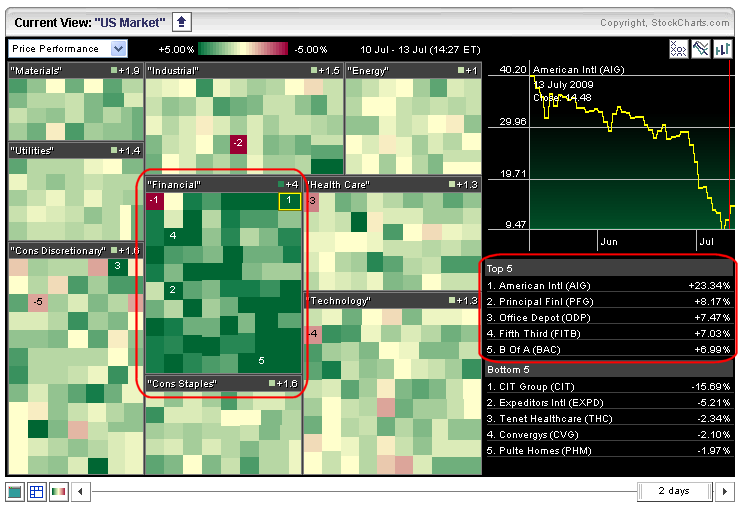
Finance Leads the Market
by Arthur Hill,
Chief Technical Strategist, TrendInvestorPro.com
A look at the market carpet for Monday reveals strength in the finance sector. All sectors are up today, but the finance sector shows the most, and the darkest, green on the carpet. From the table on the right, you can also see that four of the five biggest gainers...
READ MORE
MEMBERS ONLY
Nikkei Makes it 7 Straight
by Arthur Hill,
Chief Technical Strategist, TrendInvestorPro.com
With another down day on Thursday, the Nikkei 225 ($NIKK) has now declined seven days in a row. Even though it is getting short-term oversold, it looks like a medium-term downtrend is taking shape. The index could eventually retraced 50% of the March-June advance....
READ MORE
MEMBERS ONLY
Charts Worth Watching
by Arthur Hill,
Chief Technical Strategist, TrendInvestorPro.com
Charts Worth Watching: AAPL, AMAT, AMZN, ARO, BMS, BMY, CAKE, CHRW, FDX, GR, IWM, JBL, JCP, LLY, NKE, OMC, PFE, PRSP, QQQQ, SPY, WPO
- Link to today's video.
- Next update will be Tuesday (July 14) by 9AM ET.
*****************************************************************
After a gap down and sharp decline last...
READ MORE
MEMBERS ONLY
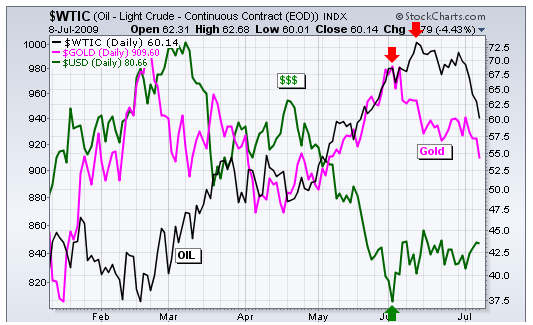
Dollar Firms as Oil and Gold Slip
by Arthur Hill,
Chief Technical Strategist, TrendInvestorPro.com
June witnessed a change in inter-market dynamics. The US Dollar Index ($USD) bounced at the beginning of June while the Gold-Continuous Futures ($GOLD) and West Texas Intermediate ($WTIC) declined in June. Gold started down first with a move lower in early June. Oil followed by moving lower the second week...
READ MORE
MEMBERS ONLY
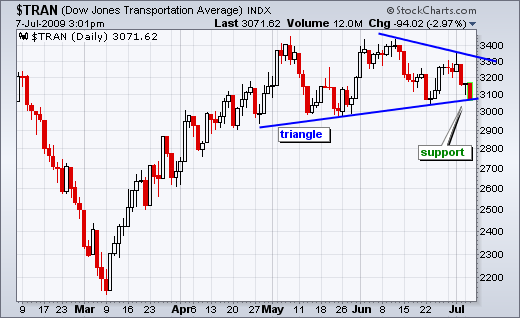
Transports Test Triangle Support
by Arthur Hill,
Chief Technical Strategist, TrendInvestorPro.com
After forming a lower high last week, the Dow Transports declined to triangle support with a sharp move lower the last three days. As of 3PM ET on Tuesday, the Average was down over 8% from last week's high. A triangle break would be bearish and call for...
READ MORE
MEMBERS ONLY
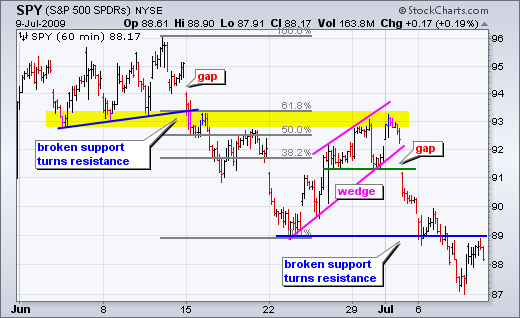
Charts Worth Watching
by Arthur Hill,
Chief Technical Strategist, TrendInvestorPro.com
- Charts Worth Watching: AMAT, APH, ARO, BWA, DIA, HCN, IWM, JWN, KSS, MCD, OLN, PSA, QQQQ, SPY
- Link to today's video.
- Next update will be Friday (July 10) by 9AM ET.
*****************************************************************
Short-term Gaps and Support Breaks
Last Tuesday I led off with the 60-minute charts...
READ MORE
MEMBERS ONLY
RTH Breaks May Low
by Arthur Hill,
Chief Technical Strategist, TrendInvestorPro.com
The Retail HOLDRS (RTH) broke below the May low with a sharp decline last week. Overall, it appears that a double top formed in May-June. The support break confirms the pattern and this ETF could retrace around 50% of its prior advance.
Sharpcharts users can click this chart to see...
READ MORE
MEMBERS ONLY
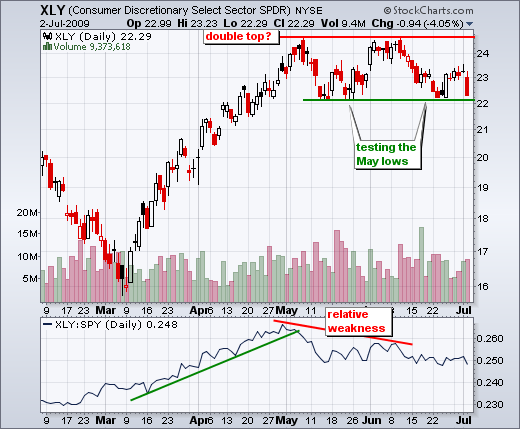
Consumer Discretionary Stocks Get Rocked
by Arthur Hill,
Chief Technical Strategist, TrendInvestorPro.com
Non-farm payrolls declined 467,000 for June, which was worse than expected. Stocks took the news hard with a broad based decline on Thursday. The major indices were down 2-4% on the day, while all sector ETFs were down over 2% with the Consumer Discretionary SPDR (XLY) leading the way...
READ MORE