MEMBERS ONLY
Bullish Engulfing Reinforces Support
by Arthur Hill,
Chief Technical Strategist, TrendInvestorPro.com
There are bullish engulfing patterns and then there are BULLISH ENGULFING patterns. Kohls (KSS) successfully tested support from its May lows with a bullish engulfing on high volume. Three items came together for this bullish signal: support, a bullish candlestick reversal and high upside volume. The more, the merrier. Note:...
READ MORE
MEMBERS ONLY
Bearish Engulfing Marks Resistance
by Arthur Hill,
Chief Technical Strategist, TrendInvestorPro.com
The bearish engulfing pattern is a short-term candlestick reversal, but it can also mark future resistance. Jabil Circuit (JBL) formed a bearish engulfing in early May and this area marked resistance a month later. The stock formed a rising wedge that peaked just below the early May high and...
READ MORE
MEMBERS ONLY
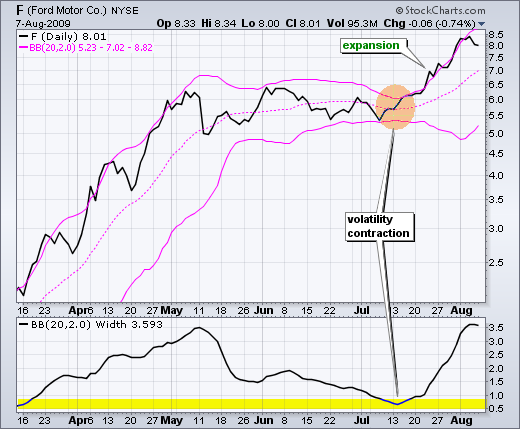
Looking for Volatility Contractions
by Arthur Hill,
Chief Technical Strategist, TrendInvestorPro.com
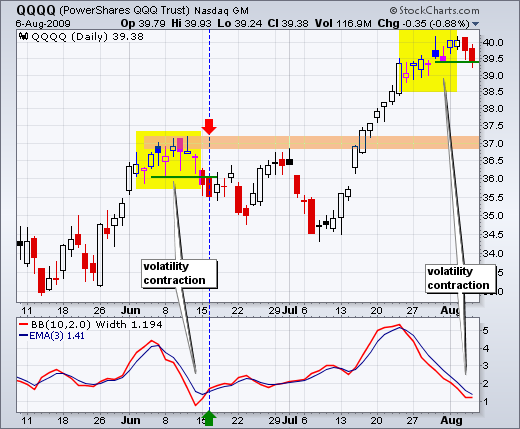
Volatility contractions often precede volatility expansions. This is the rational behind Bollinger Bands. After surging above 5.5, Ford (F) formed a long consolidation and Bollinger Bands contracted as the range narrowed. The subsequent move above resistance and the upper Bollinger Band triggered the volatility expansion (breakout). Note: This is...
READ MORE
MEMBERS ONLY
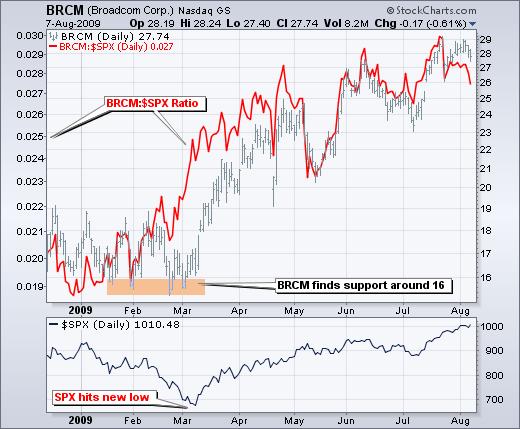
Using the Price Relative
by Arthur Hill,
Chief Technical Strategist, TrendInvestorPro.com
The price relative can be used to show relative strength or relative weakness. While the S&P 500 moved to new lows in March, Broadcom (BRCM) held support around 16 from mid January to early March. As a result of relative strength, the price relative (BRCM:$SPX ratio) surged...
READ MORE
MEMBERS ONLY
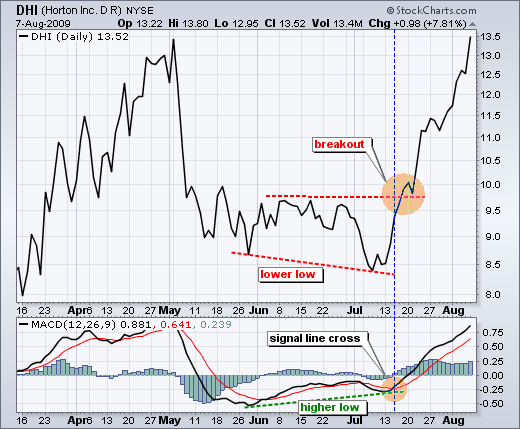
Detecting a Fade in Downside Momentum
by Arthur Hill,
Chief Technical Strategist, TrendInvestorPro.com
Positive divergences in MACD show waning downside momentum that can lead to a breakout. DR Horton (DHI) forged a lower low in early July, but MACD held above its June low for a positive divergence. Despite a lower low in the stock, downside momentum was fading. MACD's subsequent...
READ MORE
MEMBERS ONLY
Volume By Price Confirms Support
by Arthur Hill,
Chief Technical Strategist, TrendInvestorPro.com
The volume-by-price bars for Bank of America were the longest between 11 and 13. Even though the red and green portions were relatively equal, it is clear that many positions were established in this range. Remember, there is a buyer for every seller. With so much volume, the...
READ MORE
MEMBERS ONLY
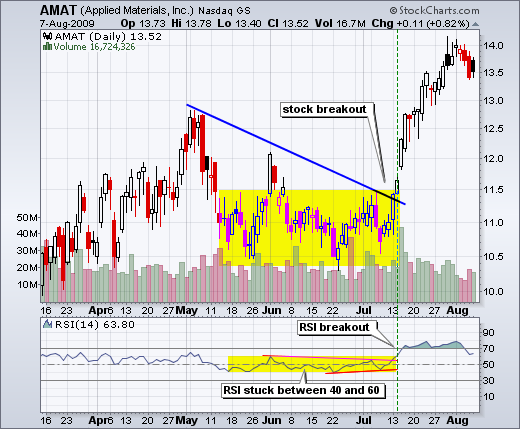
RSI Breakouts
by Arthur Hill,
Chief Technical Strategist, TrendInvestorPro.com
Momentum indicators like RSI can be used to define periods when there isn't much momentum, such as a consolidation. Applied Materials (AMAT) was largely range bound from mid May to mid July (yellow area). So was RSI. The breakout in the stock corresponded with a range breakout in...
READ MORE
MEMBERS ONLY
Volume By Price Confirms Support
by Arthur Hill,
Chief Technical Strategist, TrendInvestorPro.com
The volume-by-price bars for Bank of America were the longest between 11 and 13. Even though the red and green portions were relatively equal, it is clear that many positions were established in this range. Remember, there is a buyer for every seller. With so much volume, the...
READ MORE
MEMBERS ONLY
Envelope Surges Show Strength
by Arthur Hill,
Chief Technical Strategist, TrendInvestorPro.com
The chart below shows DIA with a 20-day SMA and an envelope set 4% above/below the 20-day SMA. Notice how the January plunge below the lower envelope triggered an extended decline. Conversely, the March surge above the upper envelope kicked off the current rally. Not all signals...
READ MORE
MEMBERS ONLY
Keeping an Eye on Bullish Percent
by Arthur Hill,
Chief Technical Strategist, TrendInvestorPro.com
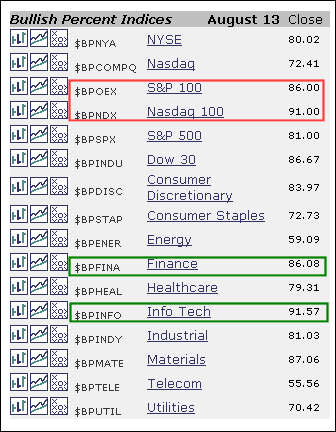
The Bullish Percent Indices measure the percentage of stocks on a Point&Figure buy signal for a given index. In general, an index has a bullish bias when its Bullish Percent is above 50% and a bearish bias when below 50%. Stockcharts.com users can easily keep an eye...
READ MORE
MEMBERS ONLY
Gamestop Moves above Upper Band
by Arthur Hill,
Chief Technical Strategist, TrendInvestorPro.com
Gamestop (GME) came across the Bollinger Band screen with a move above the upper band on Thursday. Such moves show underlying strength. Notice how GME plunged below the lower band in early May and then worked its way lower until July with the 20-day SMA acting as a short-...
READ MORE
MEMBERS ONLY
Dollar Hits Resistance as Gold Hits Support
by Arthur Hill,
Chief Technical Strategist, TrendInvestorPro.com
-Bulls Still Dominate
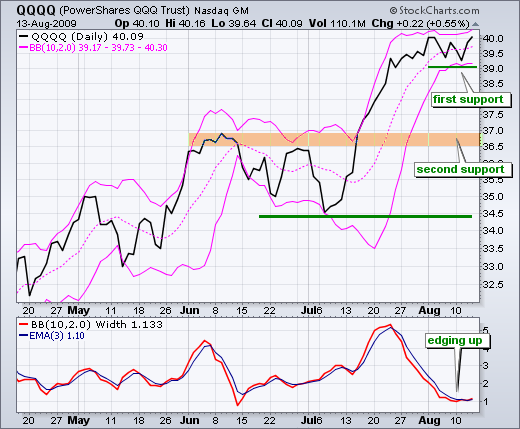
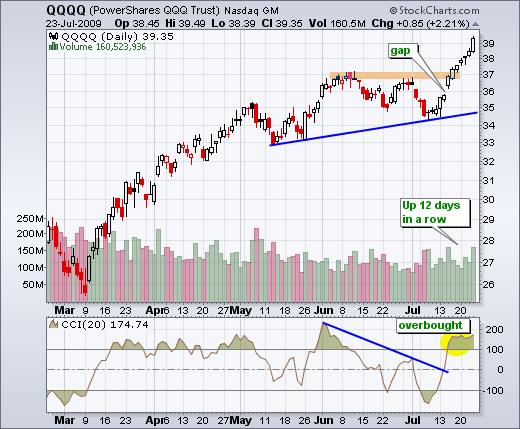
-A Close-Only View of QQQQ
-SPY Stalls around 100
-Short-term Momentum Deteriorates
-Breadth Remains Bullish Overall
-VIX Shows Short-term Abnormality
-Dollar Reinforces Resistance
-Gold Holds Support and Dollar Falls
-Bonds Bounce off Support After Fed
-Stocks: LMT, PFCB, RIMM
-Click here for today'...
READ MORE
MEMBERS ONLY
NDX Consolidates After the Fed
by Arthur Hill,
Chief Technical Strategist, TrendInvestorPro.com
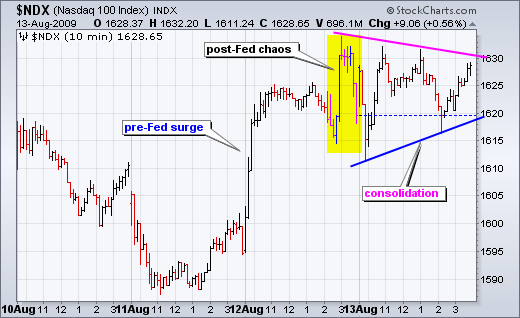
There are three distinct periods over the last two days. First, stocks surged as the Nasdaq 100 advanced above 1620 before the Fed meeting. Second, stocks gyrated rather wildly as NDX moved above and below 1620 after the announcement. Third, stocks consolidated as the market digested the Fed statement. Watch...
READ MORE
MEMBERS ONLY
Oil and Base Metals Keep Pace With Stocks
by Arthur Hill,
Chief Technical Strategist, TrendInvestorPro.com
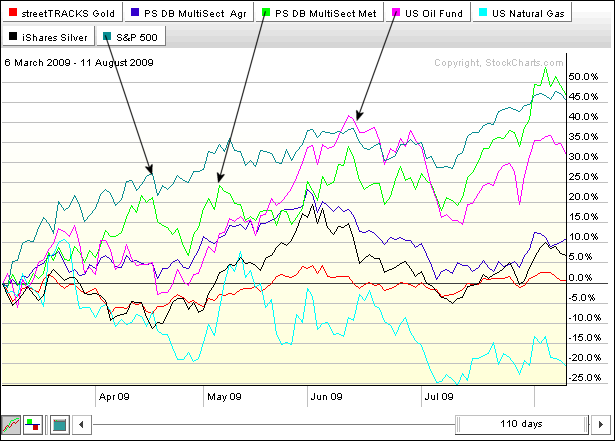
The PerfChart below shows the key commodity related ETFs and the S&P 500 since early March. As the stock market surged, the US Oil Fund ETF (USO) and the Base Metals ETF (DBB) were the only two commodity ETFs able to keep pace. The Natural Gas ETF (UNG)...
READ MORE
MEMBERS ONLY
Steel ETF Hits Resistance
by Arthur Hill,
Chief Technical Strategist, TrendInvestorPro.com
After surging to the June high, the Steel Vectors (SLX) met resistance and pulled back over the last two days. Notice that the August 3rd gap did not hold and the price relative formed a lower high. SLX is starting to show relative weakness.
Users can click on this chart...
READ MORE
MEMBERS ONLY
A Trend in Motion Stays in Motion
by Arthur Hill,
Chief Technical Strategist, TrendInvestorPro.com
-A Trend in Motion Stays in Motion
-High/Low Range Narrows for SPY
-QQQQ Volatility Contracts Further
-Short-term Uptrends Remain In Place
-XLY Forms Inside Day
-OIH Forges Island Reversal
-IGN Stalls at Resistance
-SMH Declines Five Days Straight
-Stocks Covered: AAPL, ARO, AVY, CHRW, DYN
-Click here for...
READ MORE
MEMBERS ONLY
Bullish Percent Index Shows Strength
by Arthur Hill,
Chief Technical Strategist, TrendInvestorPro.com
The S&P 500 Bullish Percent Index stands at 80%, its highest level since February 2007. Above 70% is generally regarded as overbought because this indicator spends most of its time fluctuating between 30% and 70%. However, 80% testifies to underlying strength within the index and this indicator favors...
READ MORE
MEMBERS ONLY
Sunoco Surges to Broken Support
by Arthur Hill,
Chief Technical Strategist, TrendInvestorPro.com
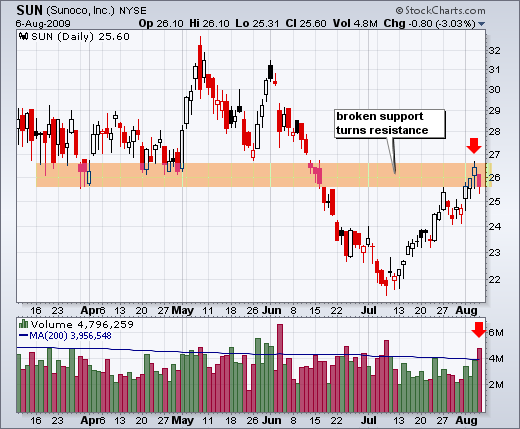
Sunoco (SUN) broke support around 26 with a sharp decline in June. After reversing course in early July, the stock surged back to broken support, which now turns into resistance. Notice how the stock pulled back with high volume on Thursday. This is a big resistance test.
Users can click...
READ MORE
MEMBERS ONLY
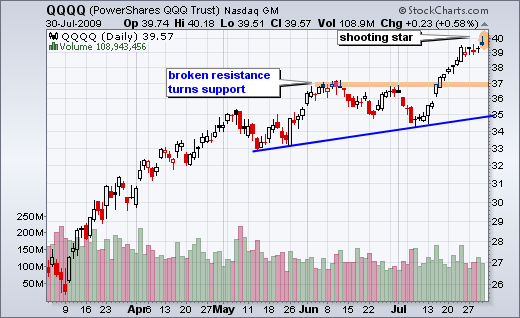
A Volatility Contraction for QQQQ
by Arthur Hill,
Chief Technical Strategist, TrendInvestorPro.com
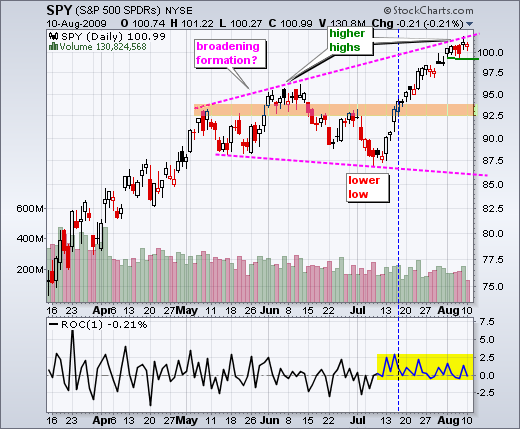
-QQQQ Extends Volatility Contraction
-SPY Hits Broadening Resistance
-Short-term Momentum Turns Bearish
-AAII Bulls Hit 50%
-Breadth Remains Bullish Overall
-Nasdaq Lags NY Composite
-Finance Sector Pushes Small-caps Higher
-VIX and VXN Diverge
-Intermarket Correlations
-Link to today's video
-Next update will be Tuesday (August 11)...
READ MORE
MEMBERS ONLY
An Inverse HS for the Aluminum Index
by Arthur Hill,
Chief Technical Strategist, TrendInvestorPro.com
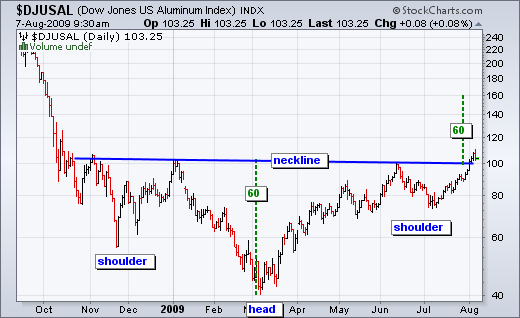
The DJ US Aluminum Index ($DJUSAL) traced out a massive inverse head-and-shoulders over the last nine months and broke above neckline resistance this week. With this pattern representing a large base, the breakout is bullish and targets further strength towards 140. Careful though, the index is already up...
READ MORE
MEMBERS ONLY
Financials Dominate Most Active List
by Arthur Hill,
Chief Technical Strategist, TrendInvestorPro.com
From the NYSE most active list on the stockcharts.com home page, we can see that banks take up half the list (5 of 10). Although not a bank, GE has a large financial services arm and was third on the list. Also notice that all six of these finance...
READ MORE
MEMBERS ONLY
Nasdaq Lags, But Gaps Prevail
by Arthur Hill,
Chief Technical Strategist, TrendInvestorPro.com
-Market Overview
-Stock Setups: AMZN, AZO, BA, DRI, ERTS, HAS, POT, RIMM
-Link to today's video.
-Next update will be Friday (August 7) by 7AM ET.
*****************************************************************
Market Overview
Stocks rallied on Monday with a fairly broad-based move. The major indices gained 1.5% on average and all...
READ MORE
MEMBERS ONLY
Transports Near January High
by Arthur Hill,
Chief Technical Strategist, TrendInvestorPro.com
Despite rising oil prices, the Dow Transports surged on Monday with a move above 3600. This key average is now within spitting distance of its January high. Also of note, the Dow Industrials broke above its January high last month....
READ MORE
MEMBERS ONLY
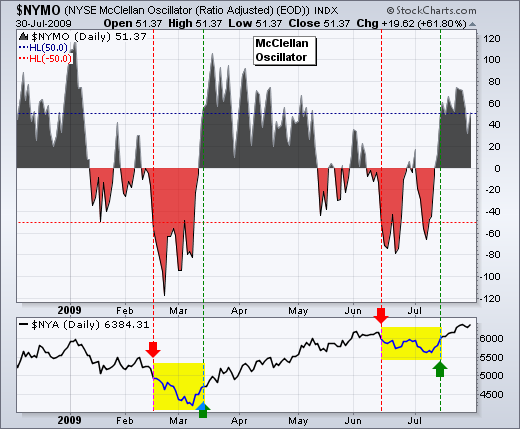
McClellan Oscillators Remain Bullish
by Arthur Hill,
Chief Technical Strategist, TrendInvestorPro.com
The McClellan Oscillators moved from bearish to bullish with the July surge in stocks. Basically, the McClellan Oscillator is the 19-day EMA of Net Advances less the 39-day EMA of Net Advances (advances less declines). As the difference of two moving averages, this indicator oscillates above/below the...
READ MORE
MEMBERS ONLY
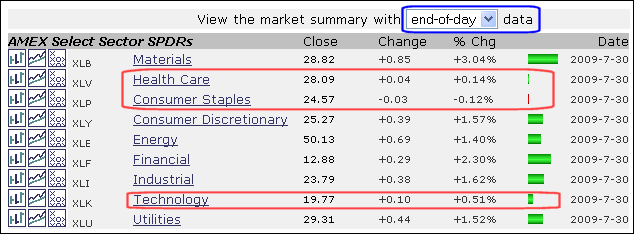
Techs Lag for a Day
by Arthur Hill,
Chief Technical Strategist, TrendInvestorPro.com
The market summary page provides an excellent overview of market performance, both end-of-day and intraday. You can change the setting at the top. Notice that materials led the market on Thursday, while healthcare, consumer staples and technology lagged. It is only one day, but relative weakness in technology...
READ MORE
MEMBERS ONLY
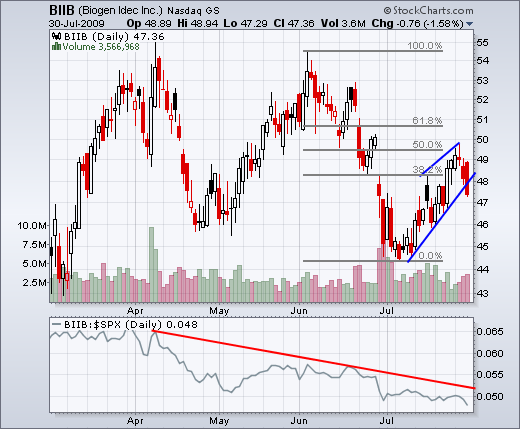
A Breakout for KEY and Weakness for ERTS
by Arthur Hill,
Chief Technical Strategist, TrendInvestorPro.com
- Charts Worth Watching: BIIB, DHR, ERTS, GPS, HAS, JBHT, KEY, LMT, LUB, MDT
- Link to today's video.
- Next update will be Tuesday (August 4) by 7AM ET.
*****************************************************************
After retracing 50% of its prior decline, Biogen Idec (BIIB) broke wedge support with a sharp decline over the last two...
READ MORE
MEMBERS ONLY
Minding Gaps and Short-Term Momentum
by Arthur Hill,
Chief Technical Strategist, TrendInvestorPro.com
- Medium-term Outlook Remains Bullish
- Short-term Situation is Overbought
- Late Selling Pressure
- Mind the Gap
- 60-minute Momentum
- Breadth Overview
- AAII Survey Flips
- A look at Bonds and the Dollar
-Link to today's video.
- Next update will be Tuesday (August 4) by 7AM ET.
*****************************************************************
Stock Market Overview...
READ MORE
MEMBERS ONLY
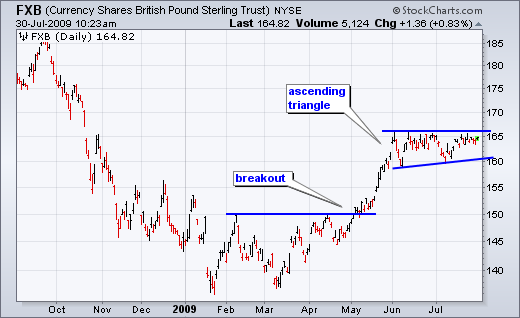
Pound ETF Forms Ascending Triangle
by Arthur Hill,
Chief Technical Strategist, TrendInvestorPro.com
After a breakout and surge from March to May, the British Pound ETF (FXB) consolidated with an ascending triangle over the last two months. Notice how FXB hit resistance at 165 a number of times since early June. Also notice that the early July reaction low is higher than the...
READ MORE
MEMBERS ONLY
Nasdaq is 10% Above 200-day EMA
by Arthur Hill,
Chief Technical Strategist, TrendInvestorPro.com
In less than 9 months, the Nasdaq has gone from being 40% below its 200-day EMA to being 10% above its 200-day EMA. Talk about a huge swing. The percentage difference was determined using the Percentage Price Oscillator (1,200,1). This setting reflects the percentage difference between...
READ MORE
MEMBERS ONLY
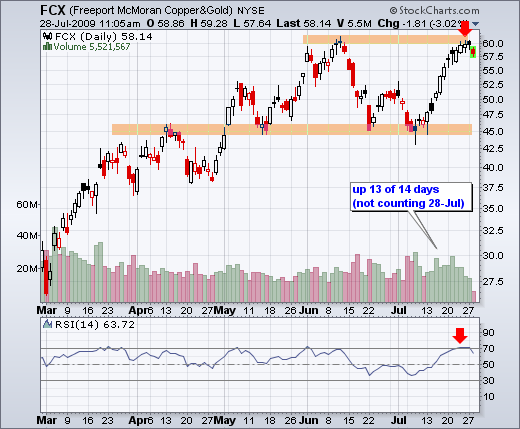
Freeport McMoran Hits the June High
by Arthur Hill,
Chief Technical Strategist, TrendInvestorPro.com
Freeport McMoran Copper & Gold (FCX) kept pace with the Nasdaq by advancing 13 of the last 14 days. In the process, the stock surged to its June high, which may offer resistance. Also notice that RSI moved above 70 to become overbought.
Click this chart to see more details....
READ MORE
MEMBERS ONLY
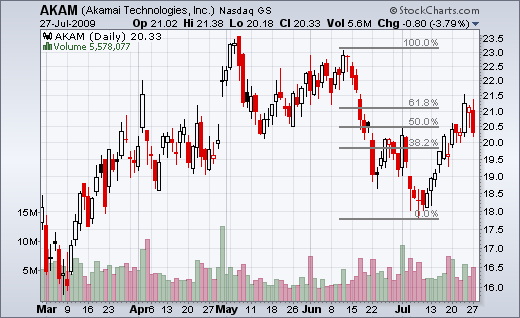
AKAM Hits Retracement - CHRW Challenges Resistance
by Arthur Hill,
Chief Technical Strategist, TrendInvestorPro.com
- Charts Worth Watching: AKAM, AZO, BA, CHRW, DHR, DRI, ERTS, FCX, KEY, PFCB, UTX
- Link to today's video.
- Next update will be Friday (July 31) by 7AM ET.
*****************************************************************
Akamai Tech (AKAM) hits key retracement with a harami. With a surge back above 21, AKAM retraced around 62% of...
READ MORE
MEMBERS ONLY
Stocks Stay Bullish as Dollar Tests June Low
by Arthur Hill,
Chief Technical Strategist, TrendInvestorPro.com
- Stocks remain medium-term bullish
- Short-term overbought conditions persist
- Dollar firms near June low
- Gold stalls at retracement
- Oil forms rising wedge
- TLT forms narrow range days.
- Link to today's video.
- Charts Worth Watching will be posted around9:30AM.
- Next update will be Friday (July 31) by...
READ MORE
MEMBERS ONLY
XLF Battles Resistance
by Arthur Hill,
Chief Technical Strategist, TrendInvestorPro.com
With gains over the last few days, the Financials SPDR (XLF) is challenging an important resistance zone on the daily PnF chart. Notice that broken support (2008) around 13 turned into resistance in 2009. XLF is currently on a bullish PnF signal with a price objective around 21. A break...
READ MORE
MEMBERS ONLY
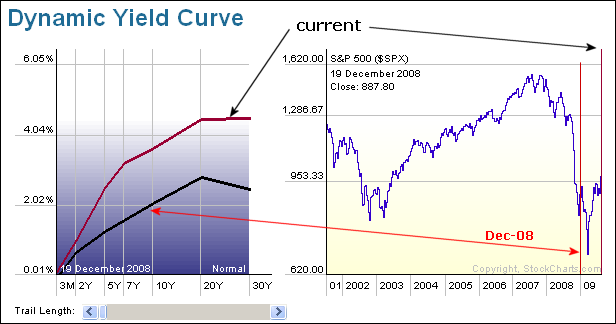
Yield Curve Remains Steep
by Arthur Hill,
Chief Technical Strategist, TrendInvestorPro.com
The Dynamic Yield Curve shows two plots over the last eight months. The black line shows the yield curve in December, while the maroon line shows the current yield curve. Today's yield curve is much steeper because 3-month rates are virtually unchanged since December, but longer rates...
READ MORE
MEMBERS ONLY
FITB and USB Break Resistance
by Arthur Hill,
Chief Technical Strategist, TrendInvestorPro.com
- Charts Worth Watching: AZO, BBT, FITB, HBAN, NEM, NKE, QLGC, QSII, S , SYK, USB, WAG
- Link to today's video.
- Next update will be Tuesday (July 28) by 7AM ET.
*****************************************************************
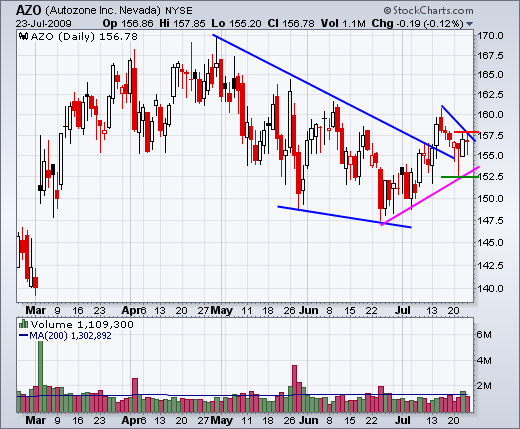
Autozone (AZO) broke wedge resistance with a surge in early July and then pulled back to this breakout area...
READ MORE
MEMBERS ONLY
XLF Breaks Wedge & KRE Surges off July Low
by Arthur Hill,
Chief Technical Strategist, TrendInvestorPro.com
- Staying Overbought
- Earnings Driving the Advance
- XLF Breaks Flag Resistance
- KRE Surges off July Low
- Bonds Falter as Stocks Surge
- Link to today's video.
- Stock setups video around 9AM ET.
- Next update will be Tuesday (July 28) by 7AM ET.
*****************************************************************
Staying Overbought
You got to know when to...
READ MORE
MEMBERS ONLY
Dow Moves Above 9000
by Arthur Hill,
Chief Technical Strategist, TrendInvestorPro.com
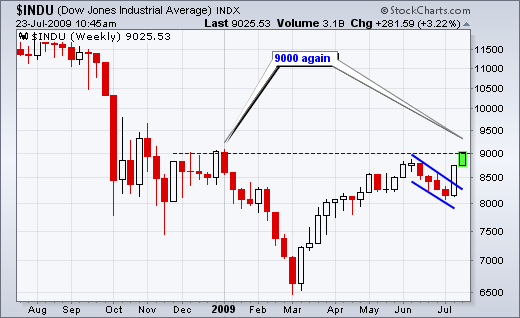
For the first time since January, the Dow Industrials moved above the 9000 level. It took around two months to fall from 9000 to 6500 and then 4-5 months to get back above 9000 (March to July). There is potential resistance in this area, but the trend remains up....
READ MORE
MEMBERS ONLY
Stocks and Commodities Rise Together
by Arthur Hill,
Chief Technical Strategist, TrendInvestorPro.com
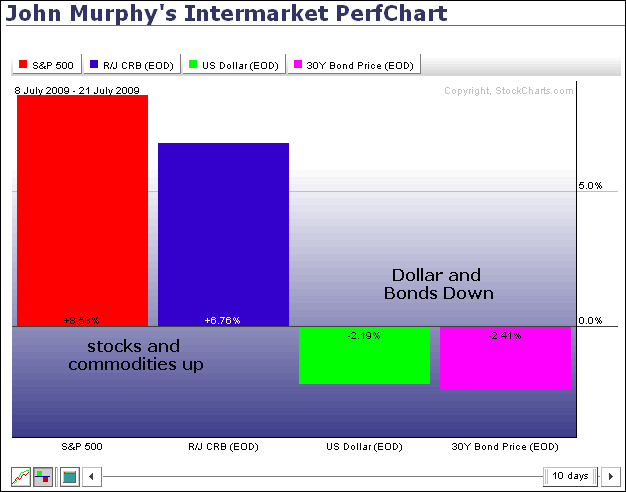
The inter-market relationship since early March remains in place. Stocks and commodities are up sharply over the last two weeks, but bonds and the Dollar are down. This relationship suggests that stock market weakness would lead to weakness in commodities, strength in bonds and strength in the Dollar....
READ MORE
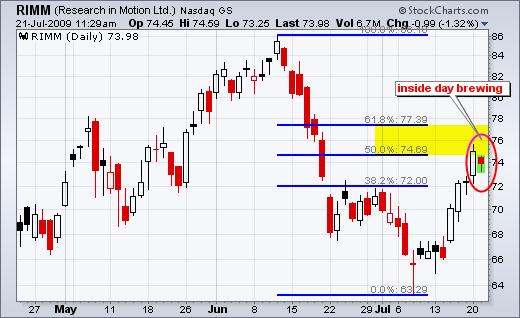
MEMBERS ONLY
An Inside Day Brewing for RIMM
by Arthur Hill,
Chief Technical Strategist, TrendInvestorPro.com
After a long white candlestick on Monday, Research in Motion (RIMM) pulled back immediately on Tuesday with a small decline. Tuesday's trading has been within Monday's range thus far. Should this range hold, an inside day or harami would take shape. A harami is a potentially...
READ MORE
MEMBERS ONLY
XHB and IYR Break Wedge Resistance
by Arthur Hill,
Chief Technical Strategist, TrendInvestorPro.com
- Charts Worth Watching: AET, CAKE, IHF, ITB, IYR, TLT, UNH, XHB
- Link to today's video.
The next update will be Friday (July 24) by 7AM ET.
*****************************************************************
The 20+ Year Treasury ETF (TLT) is trying to firm near the 62% retracement line. TLT surged above 96 with its biggest...
READ MORE