MEMBERS ONLY
Understanding and Adapting to the Broad Market Environment
by Arthur Hill,
Chief Technical Strategist, TrendInvestorPro.com
The broad market environment is perhaps the single most important factor to consider when selecting a trading or investing strategy for stocks. As with the weather, the broad market environment is subject to change and we need to adapt to current conditions. We should take extra precautions when it is...
READ MORE
MEMBERS ONLY
Weekly Market Review & Outlook (with Video) - Until Proven Otherwise
by Arthur Hill,
Chief Technical Strategist, TrendInvestorPro.com
* It is What it Is
* Breadth Indicator Review
* High-Low Percent Rebounds
* Vast Majority in Long-term Downtrends
* Volatility is Increasing, Not Decreasing
* Absolute Performance vs Relative Performance
* Risk-Off Environment
* Suggestions for Art's Charts ChartList
... It is What it Is
... There is no forecast to start 2019 because the signals...
READ MORE
MEMBERS ONLY
The Relationship between Trend Direction and Risk
by Arthur Hill,
Chief Technical Strategist, TrendInvestorPro.com
With December complete, chartists can now examine monthly close-only charts for an assessment of the long-term trend and stock market risk. Spoiler: it is not a pretty picture.
Before looking at the chart, let's review the concept behind Price Channels. Chartists can use Price Channels to mark the...
READ MORE
MEMBERS ONLY
Sector SPDRs Firm with a Few Piercing Patterns
by Arthur Hill,
Chief Technical Strategist, TrendInvestorPro.com
Stocks rebounded last week and recovered part of their losses from the prior week. Long black candlesticks formed the week before Christmas and most sector SPDRs recovered with long white candlesticks the following week. A black candlestick forms when the close is below the open, while a white candlestick forms...
READ MORE
MEMBERS ONLY
A Long-term Breadth Signal Triggers
by Arthur Hill,
Chief Technical Strategist, TrendInvestorPro.com
AD Percent for the S&P 500 dipped below -90% on Monday and this was the sixth reading below -90% this year. AD Percent equals advances less declines divided by total issues. Thus, if 25 stocks advance (5%) and 475 stocks decline (95%), AD Percent equals -90% ((25 -...
READ MORE
MEMBERS ONLY
A Rare Extreme for the Russell 2000
by Arthur Hill,
Chief Technical Strategist, TrendInvestorPro.com
The Russell 2000 peaked at 1740 in mid August and fell below 1300 over the last 15 weeks. The index is now down 11 of the last 15 weeks and extremely oversold. Even though the long-term trend is clearly down, this extreme oversold condition could give way to a counter-trend...
READ MORE
MEMBERS ONLY
Weekly Market Review & Outlook (with video) - Oversold is a Double-Edged Sword
by Arthur Hill,
Chief Technical Strategist, TrendInvestorPro.com
* A Clear Signal on the Monthly Chart.
* Oversold is a Double-Edged Sword.
* Getting to Washout Levels (High-Low Percent).
* Quarterly Rate-of-Change Signals a Shift.
* VIX has Yet to Spike.
* Futuristic Food for Thought.
* Notes from the Art's Charts ChartList.
... A Clear Signal on the Monthly Chart ...
Even though we...
READ MORE
MEMBERS ONLY
A Monster Momentum Shift in the 30-yr Yield
by Arthur Hill,
Chief Technical Strategist, TrendInvestorPro.com
It was not long ago that the 30-yr T-Yield ($TYX) was breaking above a three year resistance line and the outlook for yields was bullish (bearish for bonds). Admittedly, I was in that camp. The tables have turned as the 30-yr Yield failed to hold the breakout and sliced below...
READ MORE
MEMBERS ONLY
SystemTrader - Aggregating Trends and Oversold Conditions - Finance Sector is Most Oversold
by Arthur Hill,
Chief Technical Strategist, TrendInvestorPro.com
* Setting the Stage.
* Defining Trend and Condition.
* Running the Scan.
* Uptrends versus Downtrends.
* Overbought versus Oversold.
* Uptrend and Oversold.
* Uptrend and Mildly Oversold.
* Scanning for RSI Ranges.
* Conclusions.
... Setting the Stage
... Instead of testing an actual system, this System Trader article will show scatter plots for S&P 500...
READ MORE
MEMBERS ONLY
Global Overview of 2018 with Seven PerfCharts - On Trend Preview
by Arthur Hill,
Chief Technical Strategist, TrendInvestorPro.com
... Today's show, On Trend, provides a review of 2018, which is the year of few winners (so far). With less than two weeks before yearend, I would not expect too much to change. The show starts with seven PerfCharts to focus on seven different groups around the globe....
READ MORE
MEMBERS ONLY
Momentum Turns for Big Blue
by Arthur Hill,
Chief Technical Strategist, TrendInvestorPro.com
IBM is one of the worst performing stocks in the S&P 500 this year with an 18% decline year-to-date - and it could get worse.
First and foremost, the long-term trend is down because the stock recorded a 52-week low in late October, the 50-day moving average is...
READ MORE
MEMBERS ONLY
Support Levels in Downtrends? Fuggedaboutit!
by Arthur Hill,
Chief Technical Strategist, TrendInvestorPro.com
As obvious as it seems, lower lows and lower highs are the order of the day in a downtrend. Thus, prices are expected to break prior lows and continue lower when the trend is down. Taking this downtrend concept one step further, one could also assume that support levels within...
READ MORE
MEMBERS ONLY
Weekly Market Review & Outlook (with video) - Beware of the Next Dubious Support Level
by Arthur Hill,
Chief Technical Strategist, TrendInvestorPro.com
* Support Levels are Dubious in Downtrends.
* Continuation Patterns after Breakdowns.
* Mid-caps and Small-caps Lead Lower.
* Bonds Catch Bid as Stocks Fall.
* 10-yr Yield and Oil Fall Together.
* Gold Ignores Dollar Strength.
* Is it Really Worth It?
* XLU Hits New High.
* XLP Corrects within Uptrend.
* XLV Consolidates after New High.
* Notes...
READ MORE
MEMBERS ONLY
Breadth Remains Weak on Reversal Attempt
by Arthur Hill,
Chief Technical Strategist, TrendInvestorPro.com
* An Attempt at a Candlestick Reversal.
* Breadth Fails to Impress.
* More Stocks Breaking 50-day EMA.
* On Trend on StockCharts TV.
... An Attempted Candlestick Reversal
... The S&P 500 firmed over the last few days, but breadth remains weak overall. The first chart shows candlesticks over the last few months...
READ MORE
MEMBERS ONLY
Mind the Gaps in L Brands
by Arthur Hill,
Chief Technical Strategist, TrendInvestorPro.com
A long-term downtrend, two gaps down and a move back below the falling 200-day could spell trouble for L Brands.
The stock has been quite volatile since summer, but the overall trend remains down. LB hit a 52-week low in early September, the 50-day SMA (not shown) is below the...
READ MORE
MEMBERS ONLY
Bearish Patterns Taking Shape in EW Sectors and Semiconductor ETFs/Stocks
by Arthur Hill,
Chief Technical Strategist, TrendInvestorPro.com
* Bearish Patterns in Big EW Sectors.
* Internal Weakness Hits Consumer Staples.
* Semiconductor ETFs Bounce after Breakdowns.
* Intel Fails at 200-day as Broadcom Breaks Out.
* Four more Wedge Breaks.
* On Trend on Youtube.
... Bearish Patterns in Big EW Sectors
... While the sector SPDRs capture what is happening with large-cap stocks, the...
READ MORE
MEMBERS ONLY
Southwest Airlines Reverses with a Gap
by Arthur Hill,
Chief Technical Strategist, TrendInvestorPro.com
Southwest Airlines (LUV) is in a long-term downtrend and the recent failure near the death cross points to further downside.
First and foremost, the long-term trend is down because LUV hit a new 52-week low in late October and price is below the 200-day SMA. In addition, the 50-day SMA...
READ MORE
MEMBERS ONLY
SystemTrader - The Real Value of the Death Cross and Broad Market Signals
by Arthur Hill,
Chief Technical Strategist, TrendInvestorPro.com
* Setting the Stage.
* Defining the Death Cross.
* 9 of the Last 2 Bear Markets.
* Comparing Different Crossover Signals.
* SMAs versus EMAs.
* SPY with Dividends vs $SPX Without.
* The Moving Average Sweet Spot.
* Conclusions (Adjusting Exposure).
... Setting the Stage ...
The financial media is awash with reports on the "death cross&...
READ MORE
MEMBERS ONLY
Weekly Market Review & Outlook (with video) - Going Nowhere Fast
by Arthur Hill,
Chief Technical Strategist, TrendInvestorPro.com
* A Bull Market in Noise.
* New Lows Expand.
* Another Week and Another Big Swing..
* NDX Holds Up Better.
* Stocks Holding the 200-day.
* SKYY, HACK and IGV Trace Out Wedges.
* Healthcare Remains the Leader.
* REM, IHI and IHF Hold Up.
* Notes from the Art's Charts ChartList.
... A Bull Market...
READ MORE
MEMBERS ONLY
An Emerging Market Trading above its 200-day
by Arthur Hill,
Chief Technical Strategist, TrendInvestorPro.com
The S&P 500 is below its 200-day moving average and most country indexes are also below their 200-day moving averages. Two emerging countries, however, stand out in this crowd: Indonesia and the Philippines.
The first chart shows the Indonesia iShares (EIDO) and the DJ Indonesia Index ($IDDOW) with...
READ MORE
MEMBERS ONLY
Unimpressive Breadth - Finance and Industrials Weigh - Strange Happenings in the Bond Market
by Arthur Hill,
Chief Technical Strategist, TrendInvestorPro.com
* Three Gaps in the Same Place for SPY.
* What's Up with Bonds and Utes?
* Strange Happenings on the Yield Curve.
* Finance and Industrials are Still Laggards.
* On Trend on Youtube.
... Internal Strength on Big Bounces ...
Monday's surge was impressive when looking at the change from Friday&...
READ MORE
MEMBERS ONLY
Cisco Holds Up Well and Maintains Uptrend
by Arthur Hill,
Chief Technical Strategist, TrendInvestorPro.com
Relative strength, an uptrend and a bullish continuation pattern point to higher prices for Cisco (CSCO). First and foremost, Cisco is in a long-term uptrend. The stock recorded a 52-week high in early October, the 50-day SMA is above the 200-day SMA and price is above the 200-day.
Second, Cisco...
READ MORE
MEMBERS ONLY
Confirming Moving Average Signals in the S&P 500
by Arthur Hill,
Chief Technical Strategist, TrendInvestorPro.com
The S&P 500 is the most widely used benchmark for U.S. stocks and the 200-day SMA is the most widely used moving average. Together, chartists can use the S&P 500 and the 200-day SMA to determine the broad trend for the stock market.
The S&...
READ MORE
MEMBERS ONLY
Weekly Market Review & Outlook (with video) - Bucking Bulls Create Volatile Ranges
by Arthur Hill,
Chief Technical Strategist, TrendInvestorPro.com
* Checking and Balancing the S&P 500.
* Rodeo Range for the S&P 500.
* Small and Mid Caps Range after Breakdown.
* Confirmation and the Big Six Sectors.
* Retail is Not Hot.
* Credit Conditions Tightening.
* Palladium Continues Strong.
* Platinum Breaks Down.
* Gold Fights Downtrend and Strong Dollar.
* Notes from...
READ MORE
MEMBERS ONLY
Benchmarking Chart Levels - Why Healthcare is the Strongest Sector - Stocks to Watch
by Arthur Hill,
Chief Technical Strategist, TrendInvestorPro.com
* Setting Benchmark Lows and Highs.
* Healthcare is the Clear Leader.
* Ranking Sectors with CandleGlance Charts.
* Other Performance Metrics for the 11 Sector SPDRs.
* SPY Range and MDY Resistance.
* XLF and XLI Break Out.
* Forget Fed Speak and Watch the Action.
* Stocks to Watch (ADI, COO, INTC, MDT, SYMC...).
... Setting Benchmark...
READ MORE
MEMBERS ONLY
Varian Medical Successfully Tests Breakout Zone
by Arthur Hill,
Chief Technical Strategist, TrendInvestorPro.com
Healthcare stocks are leading the market and many were featured in Tuesday's show, On Trend. See below for details. Today I am highlighting Varian Medical (VAR) because it seems to be in the early stages of an uptrend.
Normally, I do not highlight stocks that trended lower for...
READ MORE
MEMBERS ONLY
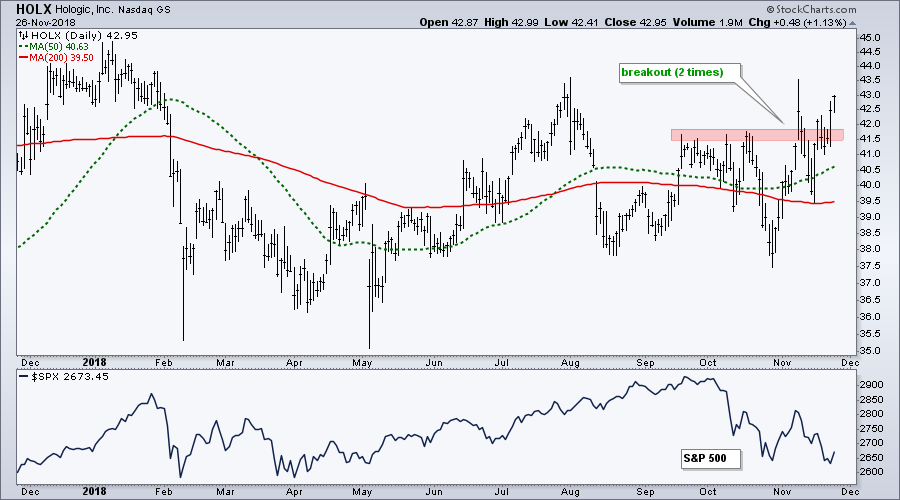
Hologic Doubles Down on Breakout
by Arthur Hill,
Chief Technical Strategist, TrendInvestorPro.com
While the S&P 500 toys with its October low, Hologic its flirting with its summer highs and showing strength over the last few months.
The chart below shows Hologic (HOLX), which his part of the Medical Devices ETF (IHI), with its 50-day SMA above the 200-day SMA and...
READ MORE
MEMBERS ONLY
A Global Logistics Player Hits Resistance
by Arthur Hill,
Chief Technical Strategist, TrendInvestorPro.com
United Parcel Service (UPS) is a global player in logistics and package delivery. The outlook for the global economy is surely dimming with the Shanghai Composite ($SSEC) falling all year, the German DAX Index ($DAX) and French CAC Index ($CAC) hitting new lows, and the S&P 500 turning...
READ MORE
MEMBERS ONLY
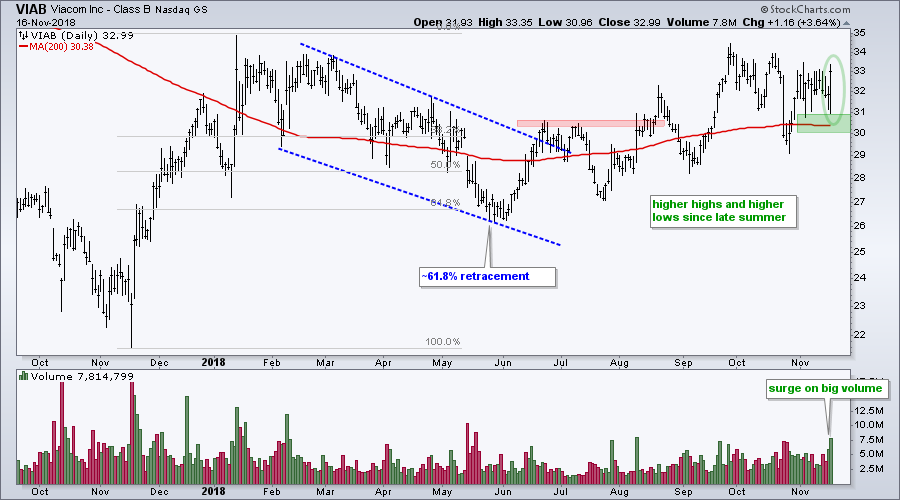
Viacom Makes a Move with Big Volume
by Arthur Hill,
Chief Technical Strategist, TrendInvestorPro.com
Viacom (VIAB) is part of the broadcasting-entertainment industry group, which is part of the Communication Services SPDR (XLC). The stock acted more like a defensive share in the first half of the year by underperforming from January to May. VIAB bottomed in June and outperformed the broader market over the...
READ MORE
MEMBERS ONLY
Volatility, Sentiment, Seasonality and Price - Oh My!
by Arthur Hill,
Chief Technical Strategist, TrendInvestorPro.com
* Defining the Current Market Environment.
* Elliott Wave, Dow Theory and Counter-trend Moves.
* Yearend Seasonality is Bullish.
* Sentiment Reaches Bearish Extremes.
* Focus on the Price Chart!
... Making Adjustments ...
As traders and investors, it is important to understand the current market environment and adjust our strategy accordingly. Are we in a low...
READ MORE
MEMBERS ONLY
Taking the Temperature of the Stock Market
by Arthur Hill,
Chief Technical Strategist, TrendInvestorPro.com
The Momentum Factor iShares (MTUM) and the Minimum Volatility iShares (USMV) represent opposing sides of the market. High flying stocks can be found in the momentum ETF, while the more boring issues dominate the minimum volatility ETF.
Using these two ETFs, chartists can quickly take the temperature of the stock...
READ MORE
MEMBERS ONLY
Weekly Market Review & Outlook (with video) - Digesting the Breakdowns
by Arthur Hill,
Chief Technical Strategist, TrendInvestorPro.com
* Performance Overview.
* Ranging after Breakdown.
* Other Bearish Developments.
* Volatility Heats Up.
* Momentum versus Low Volatility.
* Staples and Utes Hold Up.
* Healthcare and REITs Outperform.
* Big Bounces within even Bigger Downtrends.
* Notes from the Art's Charts ChartList.
... Ranging after Breakdown
The S&P 500 was thrown off trend...
READ MORE
MEMBERS ONLY
Key Levels for SPY and QQQ
by Arthur Hill,
Chief Technical Strategist, TrendInvestorPro.com
* SPY Draws a Line in the Sand.
* QQQ Lags SPY on Rebound.
* Scanning for 5-day ROC.
* Auto Parts Stocks Stand Out.
* On Trend on Youtube.
... SPY Draws a Line in the Sand
... The S&P 500 SPDR (SPY) and the Nasdaq 100 ETF (QQQ) gapped up the day after...
READ MORE
MEMBERS ONLY
The First Death Crosses Appear
by Arthur Hill,
Chief Technical Strategist, TrendInvestorPro.com
A classic death cross occurs when the 50-day moving average moves below the 200-day moving average. On the flip side, a golden cross occurs when the 50-day SMA moves above the 200-day SMA. The 50-day SMAs have been above the 200-day SMAs for all major stock indexes this entire year...
READ MORE
MEMBERS ONLY
Goldman Continues to Struggle
by Arthur Hill,
Chief Technical Strategist, TrendInvestorPro.com
Goldman Sachs is the premier investment bank and a key component of the Financials SPDR (XLF), as well as the Broker-Dealer iShares (IAI). The stock has struggled since March and lagged the market for over six months now. While the S&P 500 moved to a new high in...
READ MORE
MEMBERS ONLY
Weekly Market Review & Outlook (with video) - When Trends Lose Consistency
by Arthur Hill,
Chief Technical Strategist, TrendInvestorPro.com
* Performance Overview.
* When Uptrends Lose Consistency.
* Only One Breadth Thrust.
* Not A Lot of Strong Uptrends.
* Majority of Stocks below 200-day EMA.
* S&P 500 Hits Moment-of-truth.
* On-Trend versus NOT On-Trend.
* Breakdowns Followed by Sharp Rebounds.
* This Week in Art's Charts.
* Notes from the Art's...
READ MORE
MEMBERS ONLY
Healthcare Sector Stands Out - Plus HealthCare Providers, Medical Devices, a New High Scan and Nine Stocks
by Arthur Hill,
Chief Technical Strategist, TrendInvestorPro.com
* Healthcare Sector Shows Leadership.
* Big Moves in %Above 50-day EMA.
* Healthcare Providers and Medical Devices Break Out.
* HealthCare Providers Lead New High List.
* Nine Healthcare Stocks to Watch.
... Strong Breadth within Healthcare
... The chart below shows the %Above 200-day EMA indicator for nine of the sector SPDRs. Note that we...
READ MORE
MEMBERS ONLY
This Big Pharma Stock is Closing in on a New High
by Arthur Hill,
Chief Technical Strategist, TrendInvestorPro.com
Johnson & Johnson (JNJ) started the year on the wrong foot with a double digit decline the first six months. After hitting a 52-week low in late May, the stock turned around and advanced some 20% the next four months. Even though the stock remains below the January high, the...
READ MORE
MEMBERS ONLY
Monitoring the Bounce in the Major Index ETFs, key Sectors, Tech-related ETFs and a Dozen Stocks
by Arthur Hill,
Chief Technical Strategist, TrendInvestorPro.com
* Short-term Bounce Extends.
* XLY and XLF Lead Rebound.
* SKYY and SOXX Lead Tech-related ETFs.
* Gold Holds Breakout.
* Crude Hits Moment-of-Truth.
* Bonds Continue to March South.
* Stocks to Watch: DIS, VZ, CSCO, MSFT, MA, V and JNJ.
... Short-term Bounce Extends
Stocks were deeply oversold in late October and there were several...
READ MORE
MEMBERS ONLY
How to (not) Trade the Elections
by Arthur Hill,
Chief Technical Strategist, TrendInvestorPro.com
The US elections are on Tuesday and the financial press is full of tips based on possible outcomes. Basing a financial decision on a news event means we must get two things right. First, we must successfully predict the news (election results). Second, we must then successfully predict the market&...
READ MORE