MEMBERS ONLY
Small-caps Catch a Little March Madness
by Arthur Hill,
Chief Technical Strategist, TrendInvestorPro.com
The S&P SmallCap iShares (IJR) held up better than the S&P 500 SPDR (SPY) during last week's decline and small-caps are outperforming large-caps in 2018.
The chart shows IJR moving above its late February high with a surge above the blue zone in mid-March....
READ MORE
MEMBERS ONLY
SPY Erases the Gap - ITA Bucks the Trend - Focus on Defense Stocks
by Arthur Hill,
Chief Technical Strategist, TrendInvestorPro.com
* Broad Selling in Technology.
* SPY Erases the Gap.
* New Floors and Ceilings.
* Defense Stocks Buck the Selling.
* Six Stocks with Bullish Continuation Patterns.
* Oil Consolidates within an Uptrend.
* Oil and XES Still Positively Correlated.
* XES Battles Retracement Zone.
Broad Selling in Technology ...
The technology sector led the way lower as...
READ MORE
MEMBERS ONLY
Investors Cut the Cord on Disney
by Arthur Hill,
Chief Technical Strategist, TrendInvestorPro.com
Dow component Disney (DIS) is feeling the heat today with a triangle break and move below the 200-day moving average.
Disney has been one of the weaker stocks in the Dow Industrials over the last few years. The stock peaked way back in August 2015 and formed lower highs the...
READ MORE
MEMBERS ONLY
Dow Industrials Coils Up as Breakout Nears
by Arthur Hill,
Chief Technical Strategist, TrendInvestorPro.com
The Dow Industrials is in the midst of a narrowing consolidation and chartists should watch the March range for the next directional clue.
The 2018 range extends from the January high (26,617) to the February low (23,360), which is 3257 points or around 13% of the current close....
READ MORE
MEMBERS ONLY
Weekly Market Review & Outlook (with Video) - Monitoring the Sector High-Low Lines
by Arthur Hill,
Chief Technical Strategist, TrendInvestorPro.com
* Pop and Drop for Two Key Sectors.
* SPY Approaches First Test.
* High-Low Percent Pops and Drops.
* Sector High-Low Lines Still Rising.
* Big Sectors Remain Mixed.
* Gold Corrects within Correction.
* Treasury Bonds Get Oversold Bounce.
* Funding the Growing Deficit.
* Notes from the Art's Charts ChartList.
The S&P...
READ MORE
MEMBERS ONLY
Centene Moves to Recapture 50-day SMA
by Arthur Hill,
Chief Technical Strategist, TrendInvestorPro.com
Centene (CNC), which is part of the healthcare sector, sports a steady uptrend over the past year and recently surged towards its 50-day SMA.
First and foremost, the long-term trend is clearly up because the stock recorded a 52-week high in January, the 50-day SMA is above the 200-day SMA...
READ MORE
MEMBERS ONLY
Non-confirmations Persist, but Bulls have the Edge in this Stock Pickers Market
by Arthur Hill,
Chief Technical Strategist, TrendInvestorPro.com
* Non-confirmations Continue to Nag.
* Setting the Benchmark Highs.
* RSP Sector Weights are Quite Different.
* EW Consumer Discretionary and Industrials Lag.
* XLF and XLY Trigger Triangle Breaks.
* A Stock Picker's Market.
Non-confirmations Continue to Nag...
The Nasdaq 100 brothers, Nasdaq Composite and Nasdaq 100, were the only two major...
READ MORE
MEMBERS ONLY
Momentum and Money Flow Take a Turn in LabCorp
by Arthur Hill,
Chief Technical Strategist, TrendInvestorPro.com
Laboratory Corporation of America Holdings (LH) is looking bullish as the Moving Average Convergence Divergence (MACD) turns up and Chaikin Money Flow pops.
On the price chart, the long-term trend is up because LH hit a new high in January, the 50-day EMA is above the 200-day EMA and price...
READ MORE
MEMBERS ONLY
Measuring the Weight of the Evidence with Breadth Indicators
by Arthur Hill,
Chief Technical Strategist, TrendInvestorPro.com
* Breadth Indicators Strengthen.
* Nasdaq 100 Leads AD Percent Rebound.
* $SPX High-Low% Signals End of Correction.
* Large-caps Lead %Above 200-day EMA.
* Broad Market Breadth Table.
* Sector Breadth Table.
* Links for Sector Breadth Charts.
Breadth Indicators Strengthen...
A couple of breadth indicators flipped from bearish to bullish with last week's...
READ MORE
MEMBERS ONLY
Weekly Market Review & Outlook (with Video) - Market Likes a Teenage VIX
by Arthur Hill,
Chief Technical Strategist, TrendInvestorPro.com
* VIX is a Teenager Again.
* $NDX and $SML AD Lines Lead.
* New Highs Still Dragging.
* Small-caps, Large-caps, Tails and Dogs.
* Six Leading Sectors (and Four Laggards).
* A Pop and Drop for Gold.
* Oil Forms Lower High.
* The Incredibly Shrinking Stock Market.
* Notes from the Art's Charts ChartList.
VIX...
READ MORE
MEMBERS ONLY
Finding Strong Stocks and Avoiding Weak Ones - Steel, Brokers, Defense and More
by Arthur Hill,
Chief Technical Strategist, TrendInvestorPro.com
* Separating the Leaders from the Laggards.
* Flying Flags for Commercial Metals and Nucor.
* Broker-Dealer iShares Leads with New High.
* Morgan Stanley and the 3 Discount Brokers.
* Defense and Aerospace ETF Fully Recovers.
* General Dynamics and Lockheed Martin.
* Verisign, Bristol-Meyers and Fastenal.
Finding the Strongest Stocks....
When dealing with stocks, we...
READ MORE
MEMBERS ONLY
Revenge of the Small Caps
by Arthur Hill,
Chief Technical Strategist, TrendInvestorPro.com
The S&P 500 SPDR (SPY) is pretty much unchanged over the last five trading days and the respective sector SPDRs are mixed. The story is a bit different for small-caps because the S&P SmallCap iShares (IJR) is up over 3% the last five days and the...
READ MORE
MEMBERS ONLY
SystemTrader - The Turn of the Month Strategy
by Arthur Hill,
Chief Technical Strategist, TrendInvestorPro.com
* Turn of the Month Strategy.
* Testing the Last and First Days of the Month.
* Turn of the Month Results.
* Plotting the Equity Curve.
* Charting Recent Results.
* Conclusions and Takeaways.
The turn of the month shows a strong bullish bias, regardless of the broad market trend.
Today we will examine stock...
READ MORE
MEMBERS ONLY
The Strange Correlation between Gold and Silver - Plus Copper the Chopper
by Arthur Hill,
Chief Technical Strategist, TrendInvestorPro.com
* The Strange Correlation between Gold and Silver.
* Gold Looks Poised to Continue Trend.
* Silver ETF Breaks Wedge Line.
* Copper the Chopper Bounces.
Correlation between Gold and Silver...
Gold and silver have not been on the same page lately, but there is still a strong positive correlation between the two. The...
READ MORE
MEMBERS ONLY
SPY Meanders, but Two Sectors Stand Out - 7 Bullish Stock Charts
by Arthur Hill,
Chief Technical Strategist, TrendInvestorPro.com
* SPY Continues to Meander.
* Sector Performance Remains Mixed.
* Seven Industry Group ETFs Stand Out.
* Regional Bank SPDR Forms Continuation Pattern.
* QQQ, Top Stocks and the 50-day SMAs.
* Leading Stocks with Bullish Charts.
SPY Continues to Meander
The S&P 500 SPDR (SPY) got a nice oversold bounce the last...
READ MORE
MEMBERS ONLY
Electronic Arts Leads and Stalls at the Same Time
by Arthur Hill,
Chief Technical Strategist, TrendInvestorPro.com
Electronic Arts (EA) is one of the leading stocks in a strong video game industry group. Note that Activision (ATVI), one of its main competitors, hit a 52-week high in late January and is challenging this high here in early March. Take-Two (TTWO) is the weakest of the big three,...
READ MORE
MEMBERS ONLY
Applying Dow Theory to the Top Sectors for Broad Market Analysis
by Arthur Hill,
Chief Technical Strategist, TrendInvestorPro.com
The principle of confirmation is important to the application of Dow Theory. This principle asserts that the Averages, Dow Industrials and Dow Transports, should confirm each other when making new highs. In other words, both should make new highs to affirm the broad market trend. Failure by one results in...
READ MORE
MEMBERS ONLY
Weekly Market Review & Outlook (with Video) - Bull Markets, Corrections and Pullbacks
by Arthur Hill,
Chief Technical Strategist, TrendInvestorPro.com
* Pullbacks versus Corrections versus Bull Markets.
* Objective Uptrend and Subjective Correction.
* VIX Moves Back above 20.
* Gold Firms at Support Zone.
* Legendary Trader Sounds the Alarm.
* Trend Followers Know What they Don't Know.
* CNBC Interview with Tobias Levkovich.
* Notes from the Art's Charts ChartList.
Pullbacks, Corrections...
READ MORE
MEMBERS ONLY
And Then There was One - Applying a Dow Theory Principle to the Top Sectors
by Arthur Hill,
Chief Technical Strategist, TrendInvestorPro.com
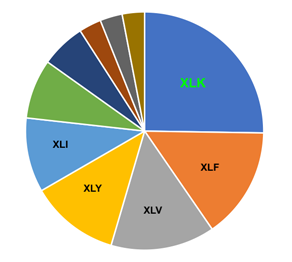
* XLK is Near Top of 2018 Range.
* XLE is Near Bottom of 2018 Range.
* Year-to-date Ranks for Equal-Weight Sectors.
* And Then There was One.
* EW Consumer Discretionary ETF Underperforms.
* Scanning the Major Indexes.
* Majority of Stocks are Struggling.
* Non-Confirmation Among the Offensive Sectors.
XLK is Near Top of 2018 Range....
READ MORE
MEMBERS ONLY
P&G Weighs on Consumer Staples Sector
by Arthur Hill,
Chief Technical Strategist, TrendInvestorPro.com
The Consumer Staples SPDR (XLP) is one of the worst performing sectors year-to-date with a loss greater than 8 percent. The sector is also the second weakest in February because it failed to hold its bounce over the last two weeks.
The chart shows XLP with its biggest component (P&...
READ MORE
MEMBERS ONLY
The 800-Pound Gorilla in the Market - Charting the Fab Five
by Arthur Hill,
Chief Technical Strategist, TrendInvestorPro.com
* SPY Leads with First Breakout.
* Small Caps and Mid Caps Still Lagging.
* Six Sectors and Six Upswings.
* Techs and Materials Lead New High List.
* The 800-pound Sector in the Market.
* Charting the Fab Five (AAPL, GOOGL, FB, AMZN, MSFT).
* Retail and Housing Lag.
SPY Leads with First Breakout...
For the...
READ MORE
MEMBERS ONLY
Humana Tests Breakout Zone as PPO Turns
by Arthur Hill,
Chief Technical Strategist, TrendInvestorPro.com
Humana (HUM) is part of the HealthCare Providers ETF (IHF) and this group led the market from mid-October to late January with a 20+ percent surge to new highs. The group pulled back in February, but the long-term trend is up and this bodes well for stocks in the group....
READ MORE
MEMBERS ONLY
Weekly Market Review & Outlook (with Video) - Something for Everyone
by Arthur Hill,
Chief Technical Strategist, TrendInvestorPro.com
* Bulls, Bears and Fishermen.
* Long-term Picture Still Bullish.
* Rising SMAs for the S&P 500.
* A Short-term Bullish Pattern for SPY.
* Small-caps Show some Short-term RS.
* Lots of Little Consolidations.
* Oil Extends Bounce off Support.
* Energy Stocks are Not Impressed.
* Gold Miners Not Impressed Either.
* Notes from the Art&...
READ MORE
MEMBERS ONLY
SystemTrader - In-Sample and Out-of-Sample Results for Two Momentum Systems - Measuring Performance and Drawdowns
by Arthur Hill,
Chief Technical Strategist, TrendInvestorPro.com
* Revisiting Two Momentum Systems from 2017.
* A Simple Momentum Rotation System.
* Live by the Sword, Die by the Sword.
* A Trend-Momentum System with a Profit Target.
* Successful and Unsuccessful Trades.
* In-Sample and Out-of-Sample Performance.
* Drawdowns are Unavoidable.
* Conclusions and Takeaways.
* Consulting, Software and Data.
Revisiting Two Momentum Systems
I introduced...
READ MORE
MEMBERS ONLY
Regional Bank ETF Rises to the Top
by Arthur Hill,
Chief Technical Strategist, TrendInvestorPro.com
Even though I am currently in the "correction" camp for the broader market, there are clearly pockets of strength in some key groups. The Software iShares (IGV), Cyber Security ETF (HACK), Internet ETF (FDN) and Networking iShares (IGN) are leading the technology rebound and all are close to...
READ MORE
MEMBERS ONLY
Never Short a Dull Market or Go Long a Volatile One
by Arthur Hill,
Chief Technical Strategist, TrendInvestorPro.com
* Go Long a Volatile Market?
* Setting Correction Targets for S&P 500.
* Leaders and Laggards During the Rebound.
* Scanning for Percent from High.
* Semis, Housing and Transports Lag.
"Never short a dull market" is an old Wall Street saying. Even though we cannot build a strategy on...
READ MORE
MEMBERS ONLY
Where Did All Those New Lows Come From?
by Arthur Hill,
Chief Technical Strategist, TrendInvestorPro.com
Stocks rebounded this week as the S&P 500 Equal-Weight Index ($SPXEW) recovered most of the losses from the previous week. On a closing basis, the index fell around 10% in nine days and then recovered around half of this loss with a 5.4% gain the last six...
READ MORE
MEMBERS ONLY
Weekly Market Review & Outlook (with Video) - Rubber Band Rebound
by Arthur Hill,
Chief Technical Strategist, TrendInvestorPro.com
* Rubber Band Rebound.
* A Bearish Breadth Thrust.
* High-Low Percent Indicators Weaken.
* %Above Indicators Remain Bullish.
* Weight of the Evidence.
* SPX Clears 50-day as VIX Falls.
* Small-caps Take the Internal Lead.
* Scan Code for Top ROC.
* Tech-Related Industry Groups Lead.
* Notes from the Art's Charts ChartList.
Rubber Band Rebound...
READ MORE
MEMBERS ONLY
Oil Bounces off Breakout Zone - Plus XES, HAL and an S&P 500 Update
by Arthur Hill,
Chief Technical Strategist, TrendInvestorPro.com
* Indicators Improve as S&P 500 Follows Through.
* A Retest of the February Low?
* Monitoring the Pennant Breakout.
* Oil Bounces off Breakout Zone.
* Use Continuous Contract Long-Term.
* Oil & Gas Equip & Services SPDR Firms.
* Haliburton Returns to Breakout Zone.
Indicators Improve as S&P 500 Follows Through...
READ MORE
MEMBERS ONLY
A Short-term Disconnect between VIX and SPY - Watch the Pennant
by Arthur Hill,
Chief Technical Strategist, TrendInvestorPro.com
There is another disconnect working between the VIX and SPY. The S&P 500 SPDR (SPY) opened weak with a dip below 265, but the S&P 500 Volatility Index ($VIX) also declined. This is an interesting dynamic because the VIX usually moves opposite of SPY. I am...
READ MORE
MEMBERS ONLY
Expansion in New Lows Points to Extended Correction
by Arthur Hill,
Chief Technical Strategist, TrendInvestorPro.com
As with Charles Dow, I work under the assumption that the trend is in force until proven otherwise. And, in accordance with Dow Theory, neither the length nor the duration can be forecast. We can, however, identify trend changes and act accordingly.
The stock market is in a delicate spot...
READ MORE
MEMBERS ONLY
CME Group Embraces Volatility and Bucks Selling Pressure
by Arthur Hill,
Chief Technical Strategist, TrendInvestorPro.com
The CME Group (CME), which has a number of volatility-based futures products, runs a variety of futures and options exchanges including the CME, CBOT, NYMEX and COMEX.
While the S&P 500 fell 8.82% over the last two weeks, CME Group actually gained ground and advanced 1.09%...
READ MORE
MEMBERS ONLY
Weekly Market Review & Outlook (with Video) - The Main Driver for Stock Prices
by Arthur Hill,
Chief Technical Strategist, TrendInvestorPro.com
* The Main Driver for Stocks.
* Rate-of-Change Reaches an Extreme.
* Two Relatively Clean Bottoms.
* A Messy Bottom in 2011.
* Watching the 200-day First.
* Notes from the Art's Charts ChartList.
The Main Driver for Stock Prices
Today's report will focus on the S&P 500 because the...
READ MORE
MEMBERS ONLY
Not Many Hiding Places - Oil Turns and XLE Triggers Breadth Signals.
by Arthur Hill,
Chief Technical Strategist, TrendInvestorPro.com
* Nowhere to Hide.
* Majority of Stocks Remain Weak.
* VIX Remains at Lofty Levels.
* Oil Starts to Correct.
* XES Extends Correction and Breaks Wedge Line.
* XLE Triggers Bearish Breadth Signals.
* Charting Breadth Indicators.
February marked a sudden and dramatic shift in the financial markets. As the PerfChart below shows, stocks, oil,...
READ MORE
MEMBERS ONLY
Intel Holds Support with Three Day Reversal
by Arthur Hill,
Chief Technical Strategist, TrendInvestorPro.com
Intel (INTC) was hit hard the first three days of February, but the stock managed to hold support with a high volume reversal over the last three days.
First and foremost, the long-term trend is up because Intel recorded a 52-week high in late January and the 50-day EMA is...
READ MORE
MEMBERS ONLY
Is this Just a Correction or Something More?
by Arthur Hill,
Chief Technical Strategist, TrendInvestorPro.com
* First Things First (Correction or More?).
* Another Perfect Storm.
* Yield Curve Turns Up.
* Oversold Setup in Breadth Indicators.
* A Bullish Setup for VIX.
* Playing the Guessing Game.
* Past Corrections Study.
First Things First
It is still a bull market. The 50-day EMA for the S&P 500 remains above...
READ MORE
MEMBERS ONLY
Palo Alto Holds above Breakout Zone
by Arthur Hill,
Chief Technical Strategist, TrendInvestorPro.com
The stock market was hit with hard selling pressure last week, but Palo Alto Networks (PANW) held up rather well and move below its breakout zone. Stocks that hold up best during a broad market correction are often the ones that lead on the rebound.
The chart shows PANW in...
READ MORE
MEMBERS ONLY
Long-term Treasury Yields Finally Play Catch Up
by Arthur Hill,
Chief Technical Strategist, TrendInvestorPro.com
Short-term Treasury yields have been moving sharply higher since September with the 5-yr and 2-yr yields hitting multi-year highs over the last few months. Yields at the long end of the curve are lagging, but appear to be catching up finally as the 10-yr yield broke out in January and...
READ MORE
MEMBERS ONLY
Weekly Market Review & Outlook (with Video) - Disconnects Could Raise the VIX Range
by Arthur Hill,
Chief Technical Strategist, TrendInvestorPro.com
* Turn of the Month Turns Negative.
* SPY Holds the Gap.
* Is the VIX Returning to Normal?.
* S&P 500 Correction Targets.
* Watching for Oversold Breadth.
* IBB Corrects from New High.
* Gold Maintains Upswing as Dollar Falls.
* Notes from the Art's Charts ChartList.
* Videos with Interesting Takes.
Turn...
READ MORE
MEMBERS ONLY
The First Step to Picking Stocks is Not Picking Stocks (with Complete Scan Code and Two Stocks)
by Arthur Hill,
Chief Technical Strategist, TrendInvestorPro.com
* Filter Group 1: General Symbol Conditions.
* Scanning Specific Indexes.
* Filter Group 2: Broad Technical Conditions.
* Cutting to the Chase with Indexes.
* Eliminating a Sector or Industry Group.
* Filter Group 3: Technical Signals.
* Wendy's and Micron Make the Cut.
* Conclusions and Complete Scan Code.
Chartists use scans to narrow...
READ MORE