MEMBERS ONLY
Two Down and Two to Go - Capitulation and Thrust are just a Start
by Arthur Hill,
Chief Technical Strategist, TrendInvestorPro.com
KEY TAKEAWAYS
* Stocks are halfway after capitulation in early April and a Zweig Breadth Thrust.
* SPY is still below its 200-day SMA and late March high.
* Follow through is needed to trigger the medium and long term signals.
The market does not always follow the same script or sequence, but...
READ MORE
MEMBERS ONLY
Zweig Breadth Thrust Dominates the Headlines - But What about an Exit Strategy?
by Arthur Hill,
Chief Technical Strategist, TrendInvestorPro.com
KEY TAKEAWAYS
* S&P 1500 Advance-Decline Percent triggered a Zweig Breadth Thrust this week.
* These signals reflect a sudden and sharp shift in participation (net advancing percent).
* ZBT signals only cover the entry, which means chartists need to consider an exit strategy should it fail.
The Zweig Breadth Thrust...
READ MORE
MEMBERS ONLY
Equities? Fuhgeddaboudit! Alternative Assets are Leading
by Arthur Hill,
Chief Technical Strategist, TrendInvestorPro.com
KEY TAKEAWAYS
* A simple ranking shows leadership in alterative assets and commodities.
* Stocks are not the place to be because the vast majority are below their 200-day SMAs.
* Bitcoin is holding up relatively well as it sets up with a classic corrective pattern.
Trading is all about the odds. Trade...
READ MORE
MEMBERS ONLY
An Oversold Bounce is One Thing - A Bullish Breadth Thrust is Another
by Arthur Hill,
Chief Technical Strategist, TrendInvestorPro.com
KEY TAKEAWAYS
* Price and breadth fell to extremes in early April as the market panicked.
* These extremes produced an oversold bounce, but this is still within a bear market.
* Follow through is what separates bear market bounces from bullish breadth thrusts.
Panic selling and oversold extremes gave way to a...
READ MORE
MEMBERS ONLY
This Report Might Self Destruct in 5 Days
by Arthur Hill,
Chief Technical Strategist, TrendInvestorPro.com
KEY TAKEAWAYS
* With fast-moving markets, this report is vulnerable to self-destruction within 5 days.
* The bond vigilantes sent a message as long-term yields surged and bonds plunged.
* Unless reversed, these developments are negative for stocks, especially rate sensitive stocks.
In the opening scene of Mission Impossible 2, Ethan Hunt receives...
READ MORE
MEMBERS ONLY
Bitcoin Holds Up, but Remains Short of Relative Breakout
by Arthur Hill,
Chief Technical Strategist, TrendInvestorPro.com
KEY TAKEAWAYS
* Traders may consider alternatives, such as Bitcoin, in bear markets.
* Bitcoin and SPY are positively correlated long-term, but one period stands out.
* Even though Bitcoin shows short-term relative strength, it is short of a relative breakout.
Stocks are in a freefall with selling pressure spreading into industrial metals...
READ MORE
MEMBERS ONLY
Performance Profile Paints Different Pictures for Commodity and Equity ETFs
by Arthur Hill,
Chief Technical Strategist, TrendInvestorPro.com
KEY TAKEAWAYS
* Among equity ETFs, non-cyclical groups are holding up the best.
* Cyclical names have the most pronounced downtrends.
The performance profile for 2025 says a lot about the state of the market. Commodity-related ETFs are leading, non-cyclical equity ETFs are holding up the best and cyclical names are performing...
READ MORE
MEMBERS ONLY
Two Ways to Use the Zweig Breadth Thrust - Plus an Added Twist
by Arthur Hill,
Chief Technical Strategist, TrendInvestorPro.com
KEY TAKEAWAYS
* The Zweig Breadth Thrust is best known for its bullish reversal signals.
* Traders can also use the "setup" period to identify oversold conditions.
* Nasdaq stocks were left out of the original, but there is solution.
The Zweig Breadth Thrust is best known for its bullish reversal...
READ MORE
MEMBERS ONLY
SPY Reverses Long-term Uptrend with Outsized Move - Now What?
by Arthur Hill,
Chief Technical Strategist, TrendInvestorPro.com
KEY TAKEAWAYS
* SPY reverses uptrend with sharpest decline in over two years.
* Large-caps underperform the average S&P 500 stock.
* Broken support and 40-week SMA turn resistance.
The weight of the evidence shifted to the bears over the last few weeks. First, the major index ETFs reversed their long-term...
READ MORE
MEMBERS ONLY
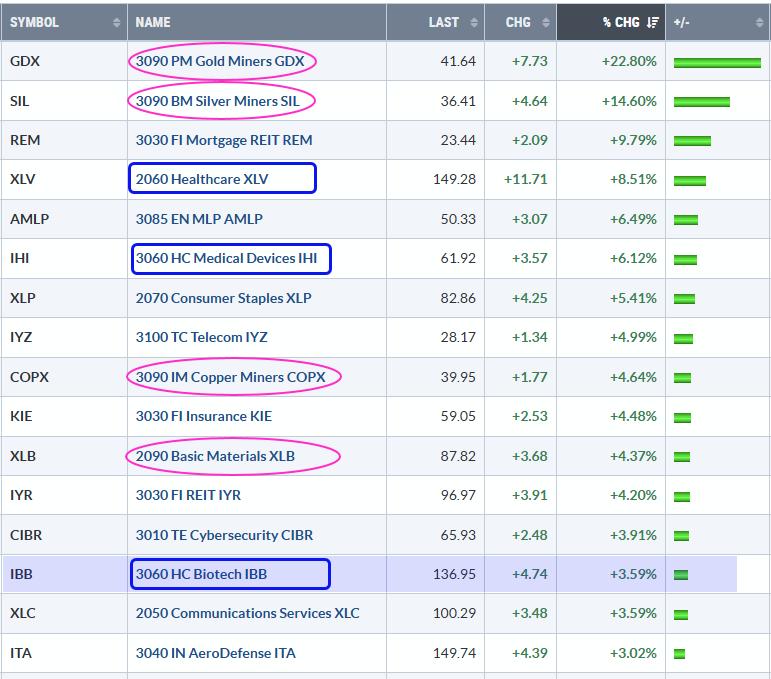
Commodity and Healthcare Related ETFs Lead in 2025 - Bullish Breakout in Biotechs
by Arthur Hill,
Chief Technical Strategist, TrendInvestorPro.com
KEY TAKEAWAYS
* 2025 is off to a rough start with SPY, QQQ and IWM sporting losses.
* ETFs with gains are bucking the market by showing relative and absolute strength.
* The Biotech ETF broke out in January and is battling its breakout zone.
2025 is off to a rough start for...
READ MORE
MEMBERS ONLY
Small-caps Trigger Bearish, but Large-caps Hold Uptrend and Present an Opportunity
by Arthur Hill,
Chief Technical Strategist, TrendInvestorPro.com
KEY TAKEAWAYS
* Long-term Keltner Channels are trend-following indicators that identify volatility breakouts.
* The Russell 2000 ETF triggered bearish this week and reversed a 14 month uptrend.
* The S&P 500 SPDR remains within an uptrend and the current pullback is an opportunity.
The Russell 2000 ETF triggered a bearish...
READ MORE
MEMBERS ONLY
Stash that Flash Right in the Trash
by Arthur Hill,
Chief Technical Strategist, TrendInvestorPro.com
KEY TAKEAWAYS
* Price represents a distillation of all news, events and rumors.
* Our job is to set biases aside and focus on price action.
* Chartists should focus on uptrends, relative strength and bullish setups.
The news cycle is in high gear lately, leading to some extra volatility. Traders reacting to...
READ MORE
MEMBERS ONLY
Bank SPDR Extends on Breakout - How to Find the Setup before the Breakout
by Arthur Hill,
Chief Technical Strategist, TrendInvestorPro.com
KEY TAKEAWAYS
* Pullbacks within uptrends provide opportunities to trade within an uptrend.
* Retracements, broken resistance and support mark setup zones.
* Strong breakouts should hold so we should mark re-evaluation levels accordingly.
The Finance sector is leading the market with a new high this week and the Bank SPDR (KBE) is...
READ MORE
MEMBERS ONLY
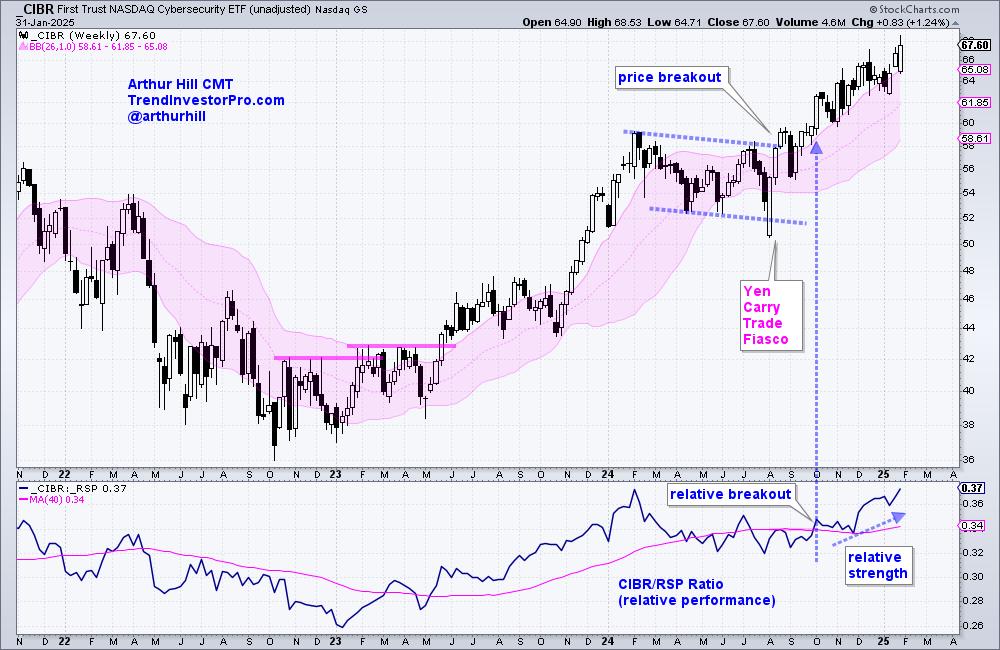
Cybersecurity Makes Yet Another Statement
by Arthur Hill,
Chief Technical Strategist, TrendInvestorPro.com
KEY TAKEAWAYS
* Chartists can use weekly charts to find strong uptrends and leaders.
* We can then turn to the daily chart to find tradeable pullbacks along the way.
* Oversold conditions in Percent-B also present opportunities.
The Cybersecurity ETF (CIBR) has been leading the market for a solid four months and...
READ MORE
MEMBERS ONLY
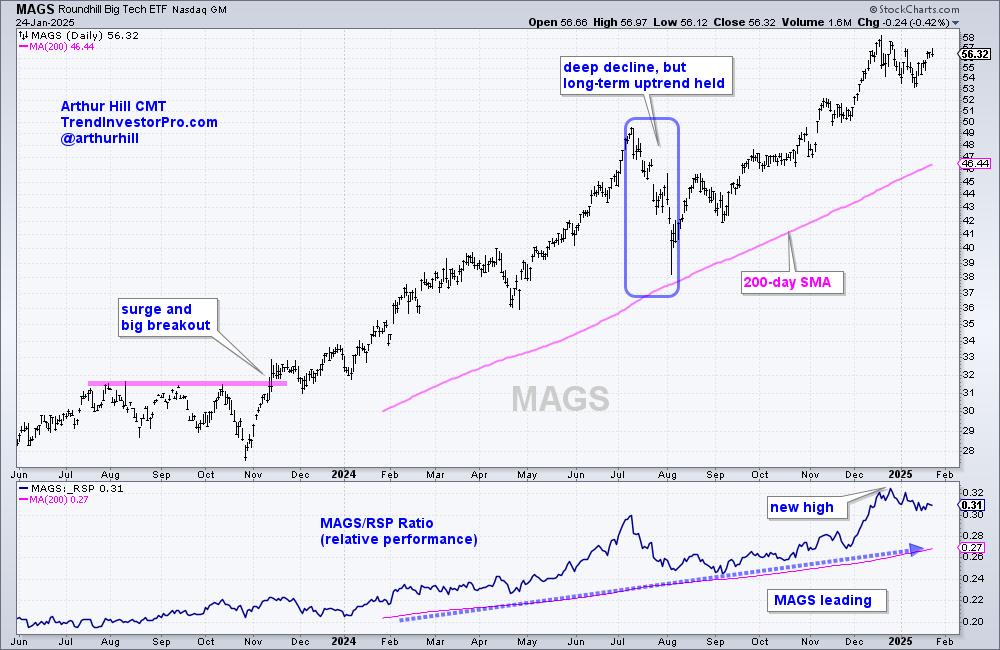
Mag7 ETF Leads as Bullish Pattern Forms - Charting the Trends and Trading Setups for the Mag7 Stocks
by Arthur Hill,
Chief Technical Strategist, TrendInvestorPro.com
KEY TAKEAWAYS
* The Mag7 ETF (MAGS) is outperforming the market and in a strong uptrend.
* MAGS broke out of a short-term bullish continuation pattern this week.
* Nvidia, Tesla, Amazon and Meta are powering MAGS higher.
The Mag7 ETF (MAGS) formed another short-term bullish continuation pattern as it worked its way...
READ MORE
MEMBERS ONLY
Mid-Caps Make a Statement with a Breadth Thrust
by Arthur Hill,
Chief Technical Strategist, TrendInvestorPro.com
KEY TAKEAWAYS
* Short-term breadth became oversold in mid December.
* Stocks surged this week with mid-caps triggering a bullish breadth thrust.
* A small bullish divergence preceded the breadth thrust.
Mid-caps show leadership and were the first to trigger a breadth thrust. Stocks surged this week with mid-caps showing the highest participation...
READ MORE
MEMBERS ONLY
Market Pullbacks Provide Opportunities <BR>to Build your WatchList - Here's How
by Arthur Hill,
Chief Technical Strategist, TrendInvestorPro.com
KEY TAKEAWAYS
* ETFs holding up during corrections often lead when the market turns up again.
* Ranking performance based on year-to-date and one month Rate-of-Change.
* ARTY and IHI show relative and absolute strength.
The stock market is in pullback mode with the S&P 500 EW ETF down 5.15%...
READ MORE
MEMBERS ONLY
How to Trade Erratic Uptrends - An Example and Setup using IWM
by Arthur Hill,
Chief Technical Strategist, TrendInvestorPro.com
KEY TAKEAWAYS
* The Russell 2000 ETF (IWM) gained 10% in 2024 - but did it the hard way.
* Even when trending higher, IWM is prone to pullbacks and erratic price action.
* Chartists can put this to their advantage by using %B to identify tradable pullbacks.
The Russell 2000 ETF managed...
READ MORE
MEMBERS ONLY
Is this Bounce a Robust Rebound or a Dead-Cat Bounce?
by Arthur Hill,
Chief Technical Strategist, TrendInvestorPro.com
KEY TAKEAWAYS
* Short-term breadth becomes most oversold in a year.
* Bounce ensues, but has yet to show material increase in participation.
* Setting key levels to identify a robust rebound.
Breadth became oversold last week and stocks rebounded this week. Is this a robust rebound or a dead cat bounce? Today&...
READ MORE
MEMBERS ONLY
Three Big Negatives Overshadow the Uptrends in SPY and QQQ
by Arthur Hill,
Chief Technical Strategist, TrendInvestorPro.com
KEY TAKEAWAYS
* SPY and QQQ are still in long-term uptrends, but the red flags are rising.
* Housing and semis, two key cyclical groups, are in downtrends.
* Interest rates are rising as the 10-yr Yield reversed a 13 month downtrend.
SPY and QQQ remain in long-term uptrends, but three big negatives...
READ MORE
MEMBERS ONLY
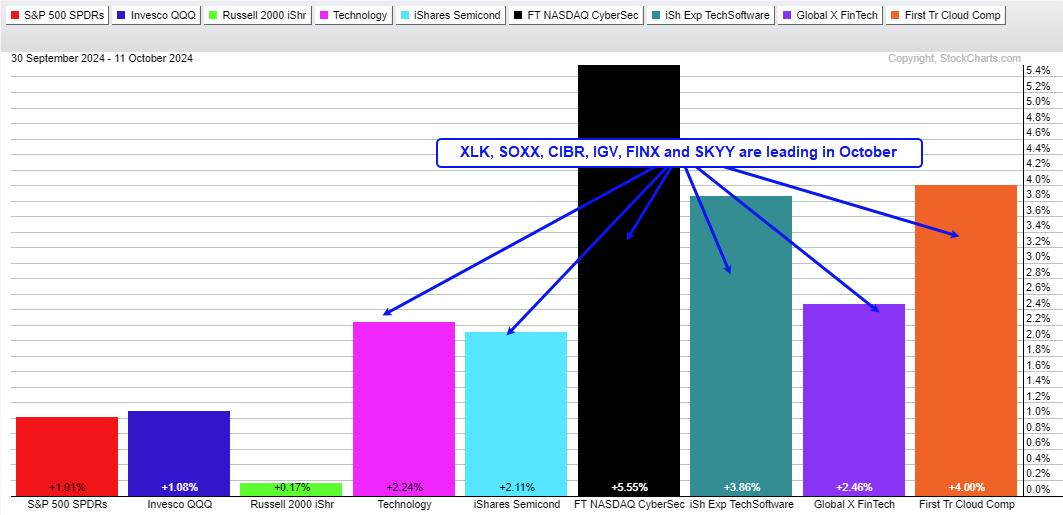
Fintech Leadership Provides Good Hunting Ground for Bullish Setups
by Arthur Hill,
Chief Technical Strategist, TrendInvestorPro.com
KEY TAKEAWAYS
* The FinTech ETF (FINX) is leading the market since September.
* FINX is both strong and extended as the PPO exceeded 20%.
* It is time to wait for the next setup or look within the group for setups.
Chartists looking for stock setups can start with strong industry groups....
READ MORE
MEMBERS ONLY
Plunge in Treasury Yields Triggers Gap-Surge in Home Builders
by Arthur Hill,
Chief Technical Strategist, TrendInvestorPro.com
KEY TAKEAWAYS
* The 10-yr Treasury Yield reversed its upswing with a sharp decline.
* The 7-10 Yr Treasury Bond ETF surged and reversed its downswing.
* Lower yields provided a big boost to the Home Construction ETF.
The 10-yr Treasury Yield reversed its upswing with a sharp decline and the Home Construction...
READ MORE
MEMBERS ONLY
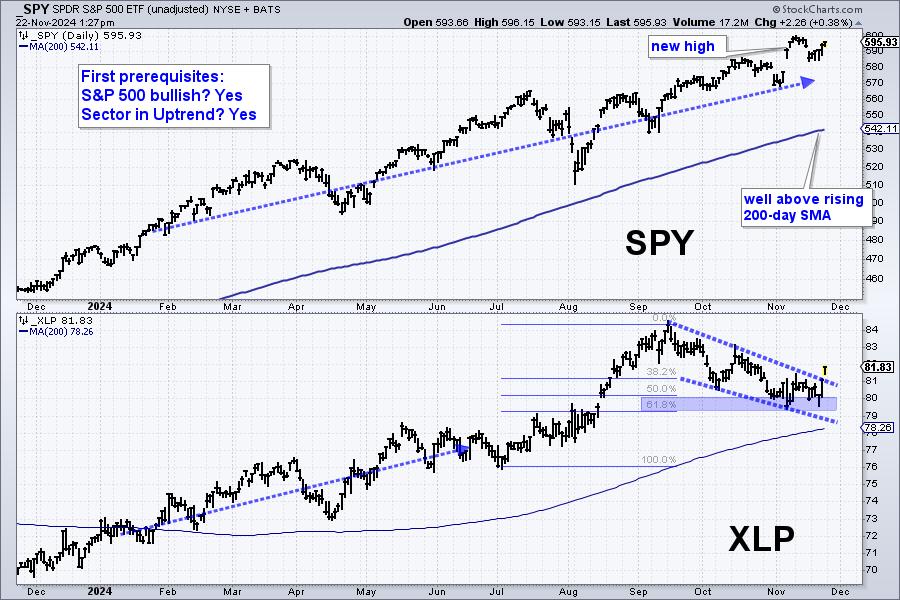
Four Prerequisites to Improve Your Odds - A Live Example
by Arthur Hill,
Chief Technical Strategist, TrendInvestorPro.com
KEY TAKEAWAYS
* Traders can improve their odds with market, sector and stock filters.
* We should be in a bull market and the sector should be in an uptrend.
* The stock should be in a long-term uptrend and leading.
Even though trading based on chart analysis involves some discretionary decisions, chartists...
READ MORE
MEMBERS ONLY
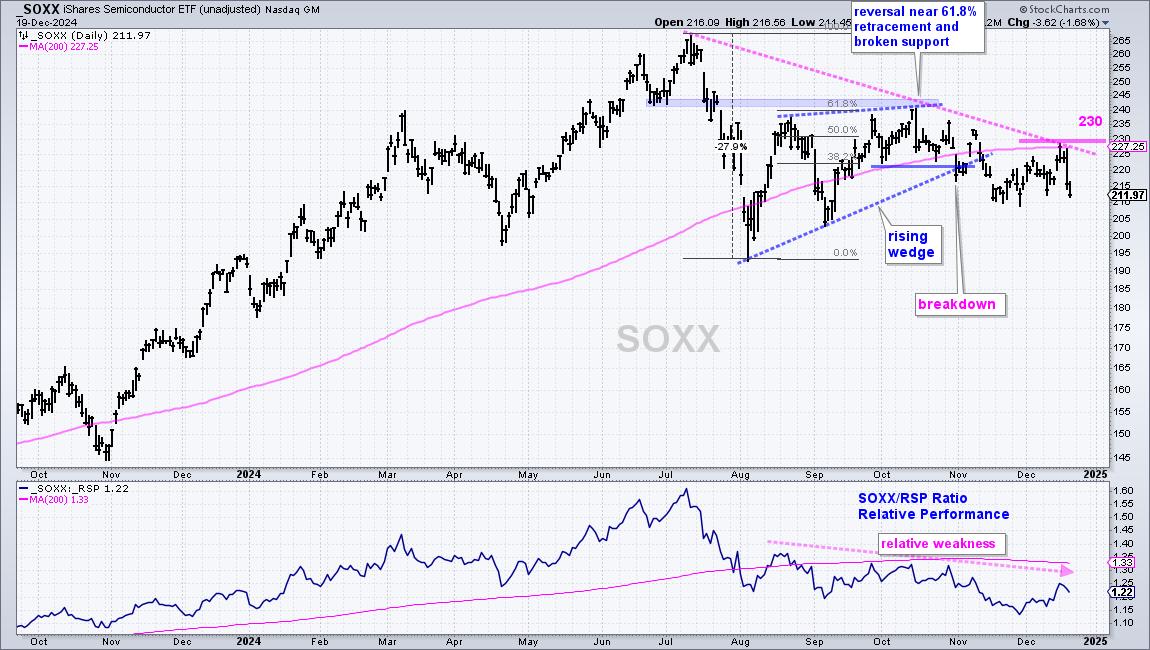
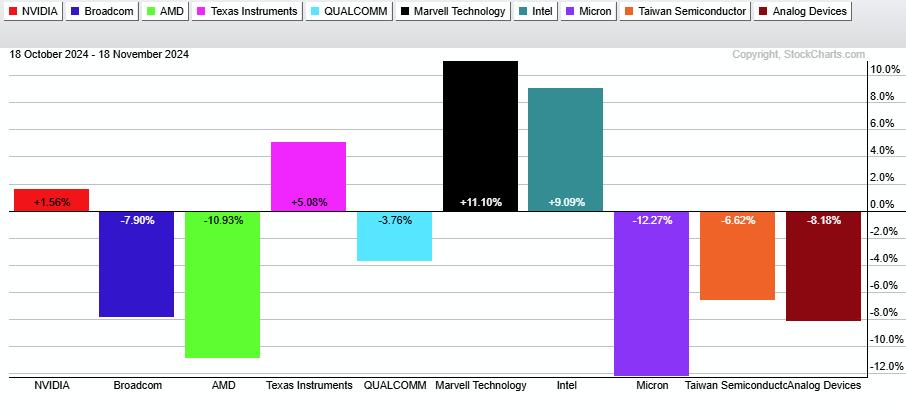
A Tale of Two Semiconductor ETFs - Why is SMH holding up better than SOXX?
by Arthur Hill,
Chief Technical Strategist, TrendInvestorPro.com
KEY TAKEAWAYS
* SOXX is lagging SMH as it broke the 200-day SMA and confirmed a bearish pattern.
* SMH is holding up because its top component remains strong.
* Nevertheless SMH is at a moment of truth ahead of a big earnings report from Nvidia.
Even though the iShares Semiconductor ETF (SMH)...
READ MORE
MEMBERS ONLY
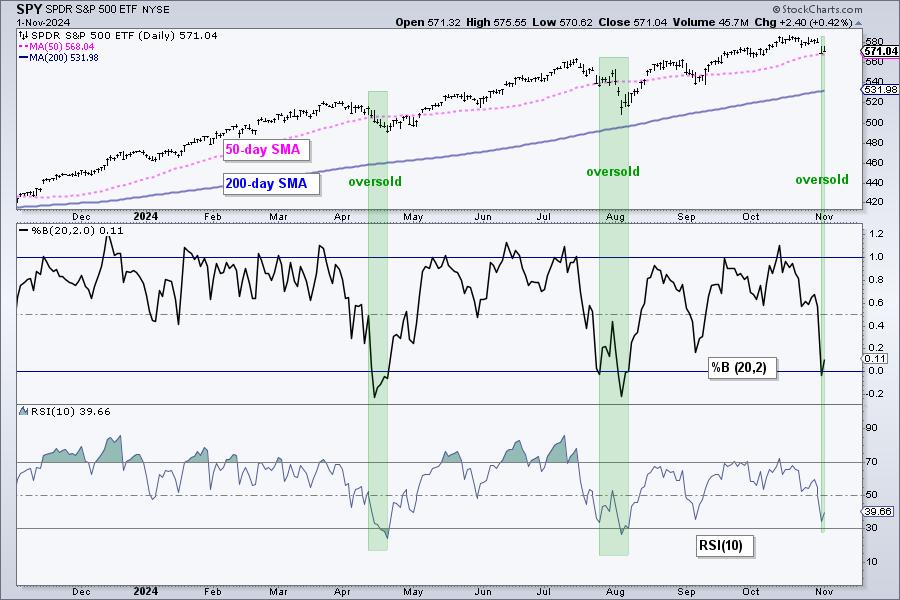
Finding and Trading Oversold Conditions within Long-term Uptrends
by Arthur Hill,
Chief Technical Strategist, TrendInvestorPro.com
KEY TAKEAWAYS
* Oversold conditions create opportunities to trade with the long-term uptrend.
* Oversold conditions provide the setup, but not the signals.
* Chartists need a signal because price can become oversold and remain oversold.
There is only one way to trade in a long-term uptrend: long. Forget about picking tops and...
READ MORE
MEMBERS ONLY
Two Indicators to Improve Your Edge
by Arthur Hill,
Chief Technical Strategist, TrendInvestorPro.com
KEY TAKEAWAYS
* Trend and momentum are proven concepts we can use to improve our edge.
* Longer timeframes are better for trend-momentum
* CandleGlance charts make it easy to rank and sort for momentum.
There are no magic bullets, but we can improve our trading edge by starting our selection process with...
READ MORE
MEMBERS ONLY
Cybersecurity ETF Comes to Life with New Trending Phase
by Arthur Hill,
Chief Technical Strategist, TrendInvestorPro.com
KEY TAKEAWAYS
* Stocks go through trending and non-trending phases.
* Non-trending phases often last longer than trending phases.
* CIBR recently broke out and started a new trending phase.
The Cybersecurity ETF (CIBR) is resuming the lead as it surged to new highs this past week. It is important to note that...
READ MORE
MEMBERS ONLY
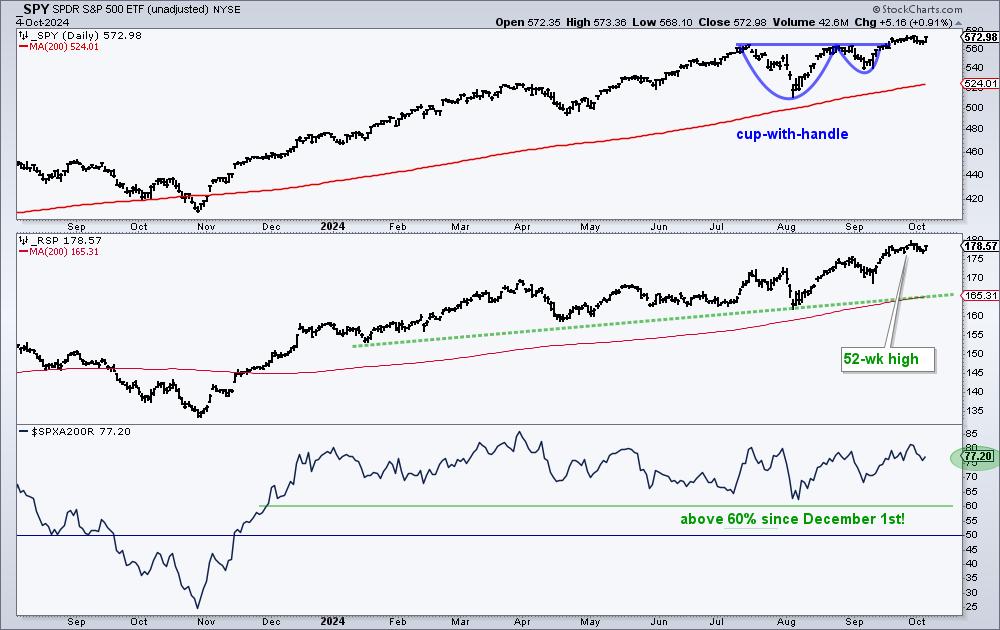
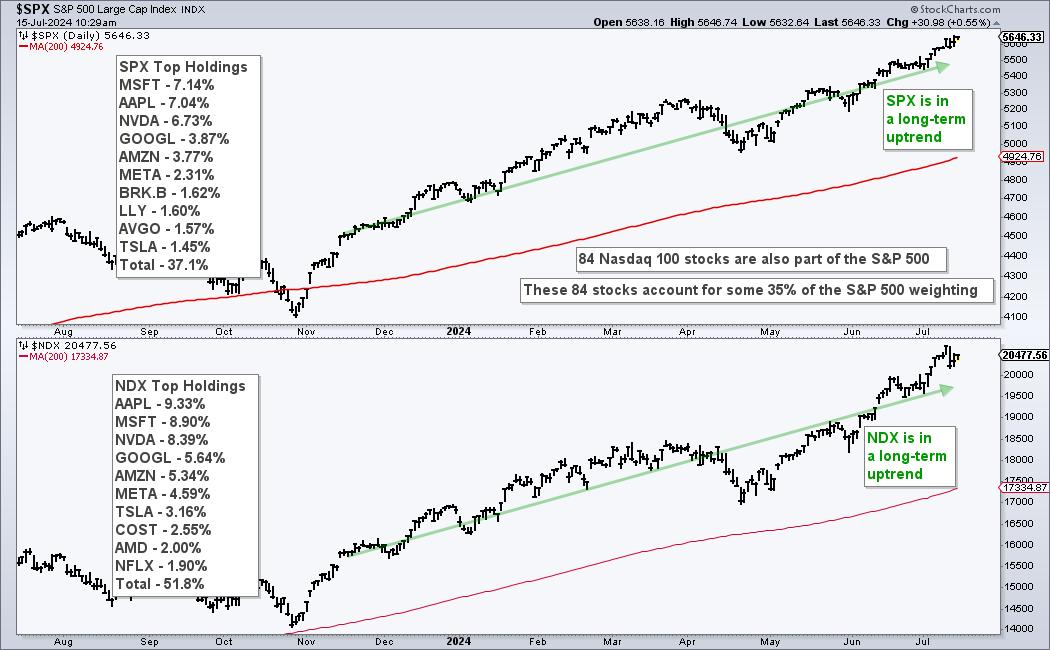
What More do the Bulls Want?
by Arthur Hill,
Chief Technical Strategist, TrendInvestorPro.com
KEY TAKEAWAYS
* Over 70% of S&P 500 stocks are above their 200-day SMAs.
* SPY and RSP are trading near new highs.
* We see a bullish continuation pattern in a key AI stock.
It is a bull market for stocks. On the chart below, the S&P 500...
READ MORE
MEMBERS ONLY
An Indicator to Reduce Whipsaws and Ride Trends
by Arthur Hill,
Chief Technical Strategist, TrendInvestorPro.com
KEY TAKEAWAYS
* Whipsaws and losing trades are part of the process for trend-following strategies.
* These strategies are profitable because average profits far exceed average losses.
* Chartists can reduce whipsaws by adding signal thresholds to the 5/200 day SMA cross.
Whipsaws and losing trades are part of the process for...
READ MORE
MEMBERS ONLY
Market Timing for a Rules-Based Strategy
by Arthur Hill,
Chief Technical Strategist, TrendInvestorPro.com
KEY TAKEAWAYS
* Chartists need a market timing mechanism to assess risk
* Risk is above average during bear markets (preserve capital)
* Risk levels are acceptable during bull markets (invest capital)
Any strategy that trades stocks needs some sort of market timing mechanism to identify bull and bear markets. Typically, stock strategies...
READ MORE
MEMBERS ONLY
It all Started with a Big Bang!
by Arthur Hill,
Chief Technical Strategist, TrendInvestorPro.com
KEY TAKEAWAYS
* Extended uptrends often start with a bang, a big bang.
* Chartists can find big bangs by measuring price moves in ATR terms.
* Paypal broke a major resistance level with a 5+ ATR advance in August.
Extended trends often start with big bangs and major breakouts. Chartists can identify...
READ MORE
MEMBERS ONLY
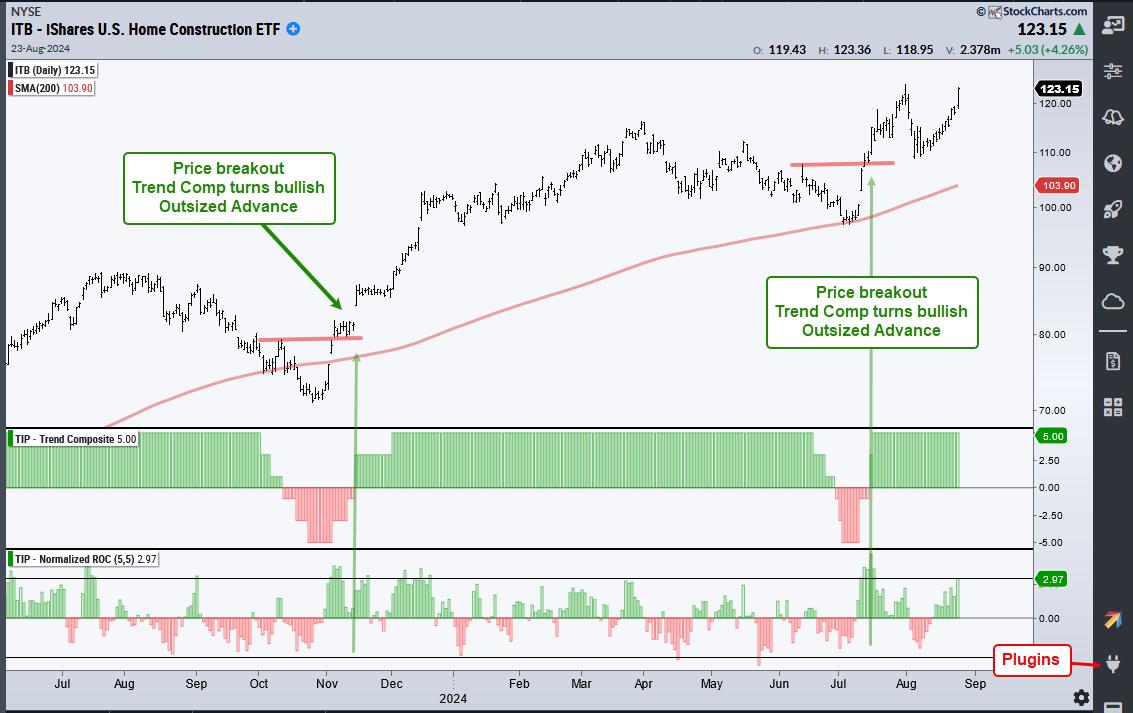
This Housing-Related Stock Just Printed a 5 for the Trend Composite
by Arthur Hill,
Chief Technical Strategist, TrendInvestorPro.com
KEY TAKEAWAYS
* A bullish trio triggers for the Home Construction ETF (ITB) in mid July.
* Outsized advances and resistance breakouts often kick start uptrends.
* The Trend Composite is a lagging indicator that triggers after follow through.
The Home Construction ETF (ITB) is leading the market as it surged to a...
READ MORE
MEMBERS ONLY
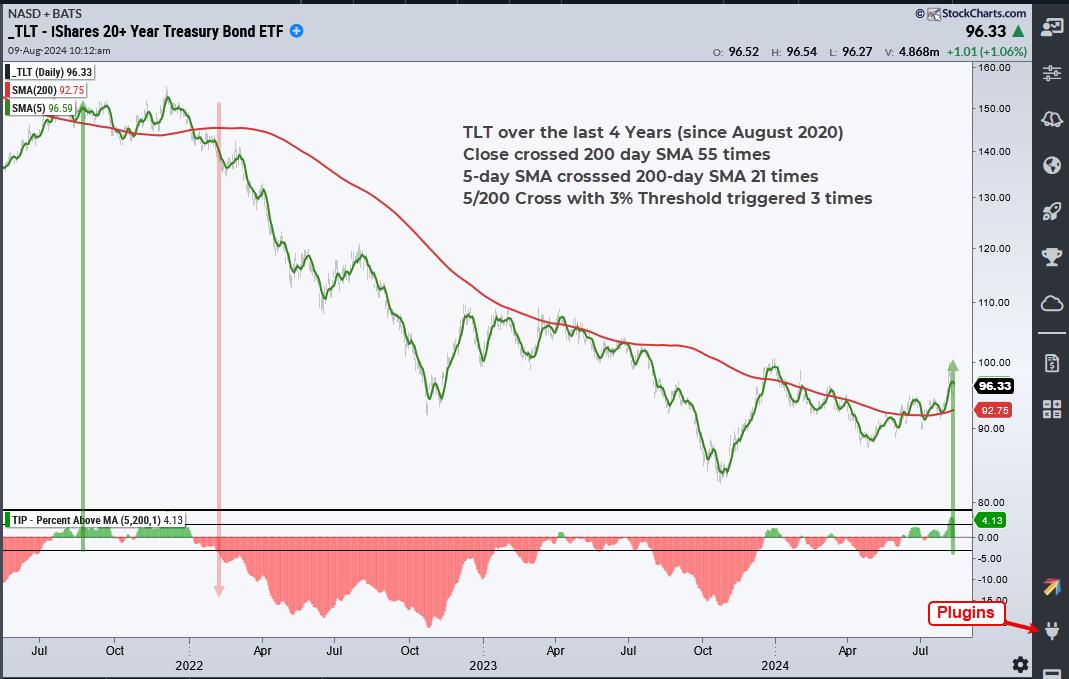
TLT Turns the Corner and Starts to Lead
by Arthur Hill,
Chief Technical Strategist, TrendInvestorPro.com
KEY TAKEAWAYS
* Smoothing the signal thresholds help to reduce whipsaws.
* A new uptrend signaled for TLT as the 5-day exceeded the 200-day by more than 3%
* TLT also sports a classic breakout and continuation signal.
The 20+ Yr Treasury Bond ETF (TLT) is turning the corner as a long-term trend...
READ MORE
MEMBERS ONLY
This Breadth Indicator Points to More Downside and a Potential Opportunity
by Arthur Hill,
Chief Technical Strategist, TrendInvestorPro.com
KEY TAKEAWAYS
* Most stocks follow their underlying index or group.
* Oversold conditions in long-term uptrends are opportunities.
* Stocks can remain oversold so wait for an upward catalyst.
The broad market and the group are big drivers for stock performance. Recently, the Nasdaq 100 ETF (QQQ) led the market lower with...
READ MORE
MEMBERS ONLY
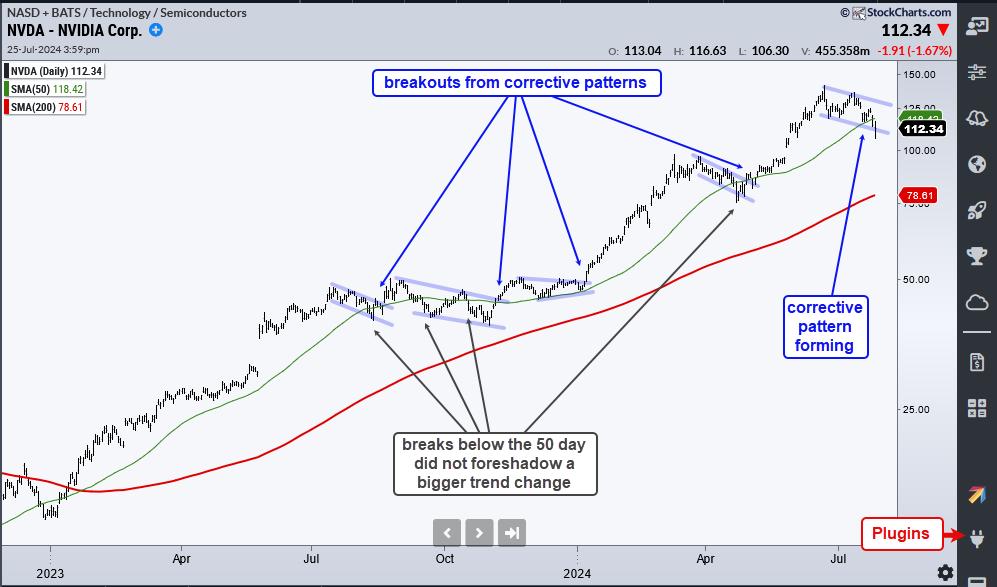
Nvidia Breaks the 50-day SMA: Is This a Threat or an Opportunity?
by Arthur Hill,
Chief Technical Strategist, TrendInvestorPro.com
KEY TAKEAWAYS
* The long-term trend provides perspective and sets the trading bias.
* The bias is bullish during long-term uptrends.
* Breaks below the 50-day SMA are viewed a opportunities, not threats.
After a big run this year, Nvidia (NVDA) fell over 15% from its high and broke its 50-day simple moving...
READ MORE
MEMBERS ONLY
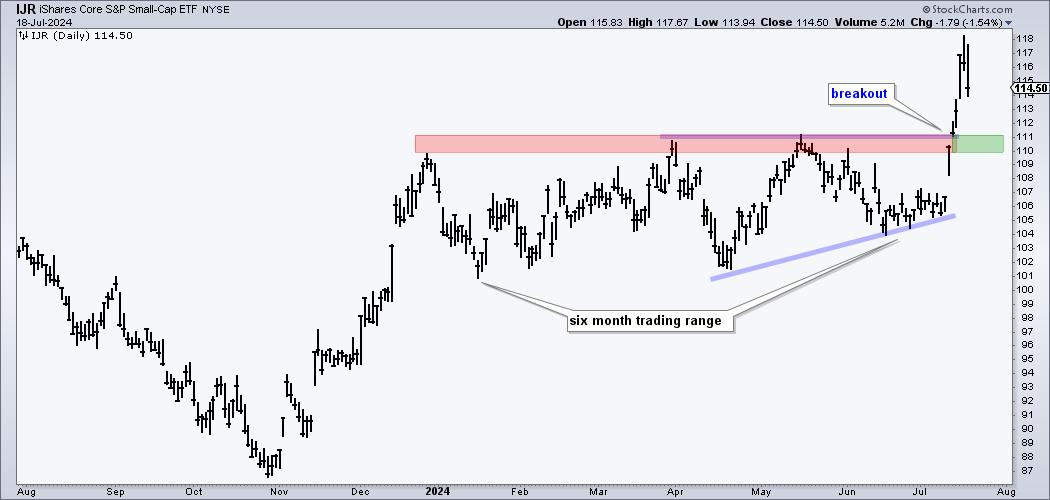
Small-caps Break Out and Lead - Now What?
by Arthur Hill,
Chief Technical Strategist, TrendInvestorPro.com
KEY TAKEAWAYS
* IJR broke out and a strong breakout should hold.
* Broken resistance turns first support.
* Small-caps are prone to extended trading ranges.
Small-caps took the lead over the last two weeks with the S&P SmallCap 600 SPDR (IJR) surging over 10% in five days and hitting a...
READ MORE
MEMBERS ONLY
Using Nasdaq 100 Specific Breadth to Measure Risk Appetite
by Arthur Hill,
Chief Technical Strategist, TrendInvestorPro.com
KEY TAKEAWAYS
* Nasdaq 100 stocks account for over 30% of the S&P 500.
* Nasdaq 100 stocks represent the risk appetite in the stock market.
* Chartists can quantify the risk appetite using Nasdaq 100 specific breadth indicators.
The Nasdaq 100 is a major driver in the stock market and...
READ MORE
MEMBERS ONLY
Finding Emerging Leaders within Key Groups
by Arthur Hill,
Chief Technical Strategist, TrendInvestorPro.com
KEY TAKEAWAYS
* Finding Emerging Leaders within Key GroupsChartists can find emerging leaders using price and the price relative.
* Breakouts and higher highs on the price chart show absolute strength.
* Upturns and breakouts in the price-relative show relative strength.
The broader market is fairly mixed with one clear leader: technology. I...
READ MORE
MEMBERS ONLY
Alibaba Returns to the Scene of the Crime
by Arthur Hill,
Chief Technical Strategist, TrendInvestorPro.com
KEY TAKEAWAYS
* Big breakouts are bullish, but sometimes traders miss the breakout.
* A throwback is a decline back to the breakout zone, which turns support.
* Throwbacks offer traders a second chance to partake in breakouts.
Chinese stocks wet on a tear from mid April to mid May with the China...
READ MORE
MEMBERS ONLY
Visualizing the Holdings for a Dual Momentum Rotation Strategy
by Arthur Hill,
Chief Technical Strategist, TrendInvestorPro.com
KEY TAKEAWAYS
* Absolute momentum defines trend direction.
* Relative momentum quantifies the strength of the uptrend.
* Take together, these two form the basis for a Dual Momentum Rotation Strategy.
As the name suggests, Dual Momentum Rotation Strategies focus on stocks that are in absolute and relative uptrends. This is a two-step...
READ MORE