MEMBERS ONLY
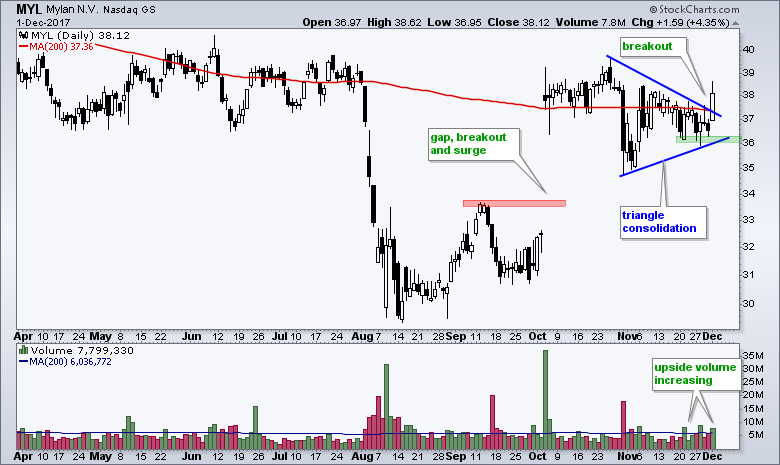
Mylan Continues its Move with Expanding Volume
by Arthur Hill,
Chief Technical Strategist, TrendInvestorPro.com
Mylan (MYL) was hit hard in early August with a plunge to 30, but firmed and recovered with a gap and surge to the upper 30s. The stock consolidated after this gap-surge and recently broke out with above average volume. Notice that the gap-zone held in the mid 30s as...
READ MORE
MEMBERS ONLY
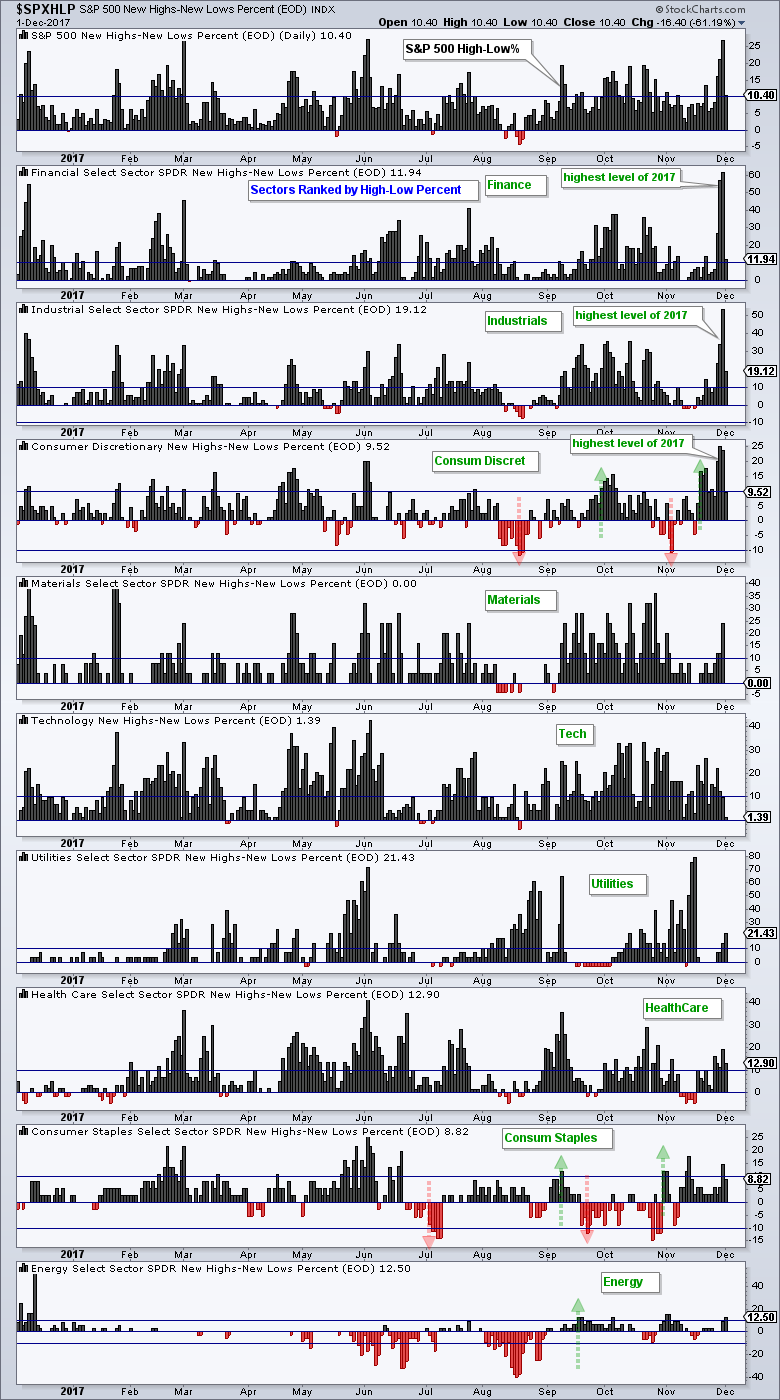
Financials and Industrials Lead New High Expansion
by Arthur Hill,
Chief Technical Strategist, TrendInvestorPro.com
Chartists can plot High-Low Percent for the nine sectors to identify areas of strength within the stock market. The chart below shows the High-Low Percent ranked by this week's highest value. The finance, industrials and consumer discretionary sectors stand out this week because their High-Low Percent indicators hit...
READ MORE
MEMBERS ONLY
Weekly Market Review & Outlook - Long-term Bullish and Short-term Frothy
by Arthur Hill,
Chief Technical Strategist, TrendInvestorPro.com
.... Bullish But Getting Frothy
.... Bull Market Broadens with Surge in New Highs
.... Finance, Industrials and Consumer Discretionary Lead
.... Consumer Staples and Discretionary Lead November
.... SPY and QQQ Hit New Highs
.... Small-caps Extend Recent Leadership Run
.... New High Hat-Tricks for Four Sectors
.... XLI, XLF, XLB and XLV Resume Uptrends
.... Oil Pulls...
READ MORE
MEMBERS ONLY
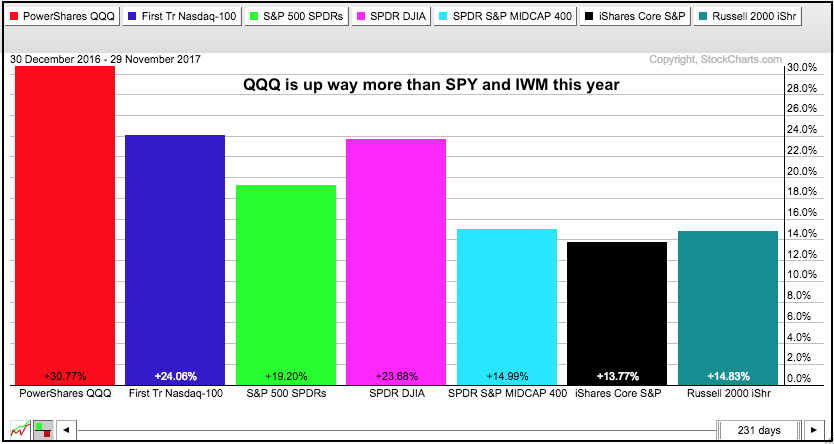
QQQ Still Leads Year-to-Date - Playing the Pullback in Healthcare - Consumer Discretionary Stocks Come Alive
by Arthur Hill,
Chief Technical Strategist, TrendInvestorPro.com
.... One Day does not Ruin the Year
.... Drastic Declines are Part of the Uptrend
.... Stock Picking Goes in Waves
.... Stocks to Watch: ADP, ARRS, FISV, LH
.... Playing the Pullback in Healthcare (BIIB, BMY)
.... Auto and Restaurant Stocks Join the Upturn ....
One Day does not Ruin the Year
Tech stocks were...
READ MORE
MEMBERS ONLY
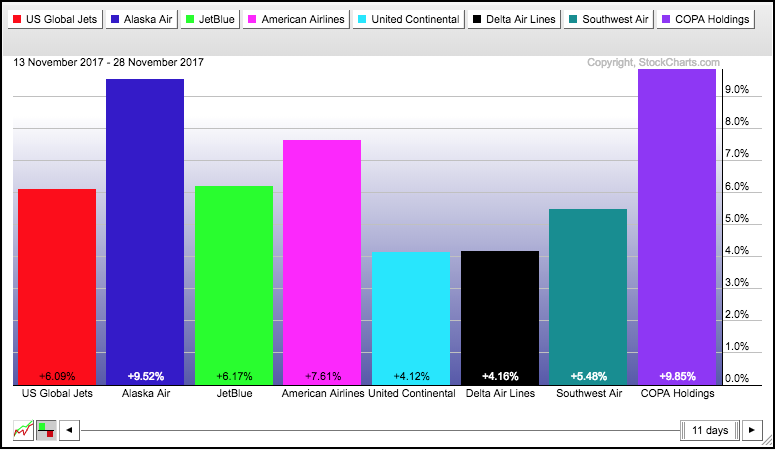
Delta Air Lines Reverses with Outside Reversal Day
by Arthur Hill,
Chief Technical Strategist, TrendInvestorPro.com
Airline stocks are moving higher again with solid gains across the board over the last two weeks. The PerfChart below shows the performance for the Airline ETF (JETS) and seven other airline stocks since mid November. All are up with Alaska Air (ALK), Southwest (LUV) and COPA Airlines (COPA) sporting...
READ MORE
MEMBERS ONLY
Ugly Charts versus Strong Charts - Broad Market Leadership - Charts for Cintas, Netflix, Eli Lilly and Tesla
by Arthur Hill,
Chief Technical Strategist, TrendInvestorPro.com
.... Lots of Ugly Charts can be Found
.... There are also Plenty of Strong Uptrends
.... New Highs in the Nasdaq 100
.... Netflix and Cintas Consolidate within Uptrends
.... Lilly Turns Up at Key Retracement Zone
.... Billy and Bobby Debate Tesla ....
Lots of Ugly Charts can be Found
Chartists looking for weakness in...
READ MORE
MEMBERS ONLY
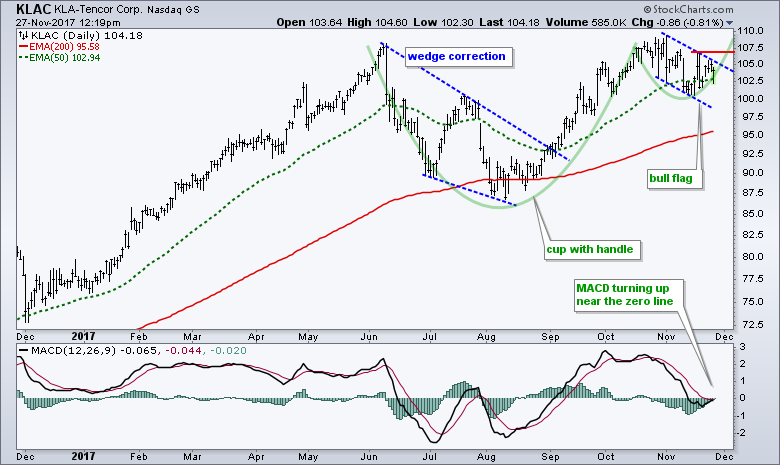
KLA-Tencor Traces out Two Continuation Patterns
by Arthur Hill,
Chief Technical Strategist, TrendInvestorPro.com
KLA-Tencor (KLAC), a semiconductor equipment and materials designer and manufacturer, is in a long-term uptrend with large and small bullish continuation patterns working. The chart shows 52-week highs in May and October so the long-term trend is clearly up. The green outline highlights a cup-with-handle forming from June to November....
READ MORE
MEMBERS ONLY
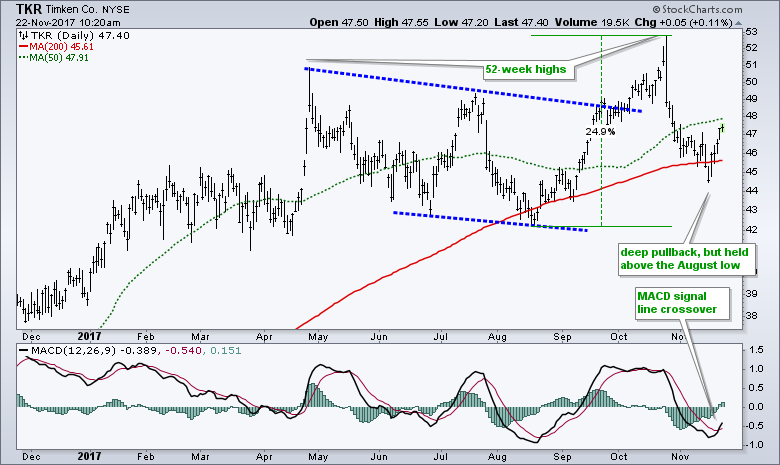
Timken Surges off Rising 200-day SMA
by Arthur Hill,
Chief Technical Strategist, TrendInvestorPro.com
Timken (TKR), a mid-cap industrial, looks like it is resuming its bigger uptrend with a surge off the 200-day SMA. The chart below shows the stock hitting 52-week highs in April and October. The October high formed after a channel breakout and 25% advance. Timken then corrected with a rather...
READ MORE
MEMBERS ONLY
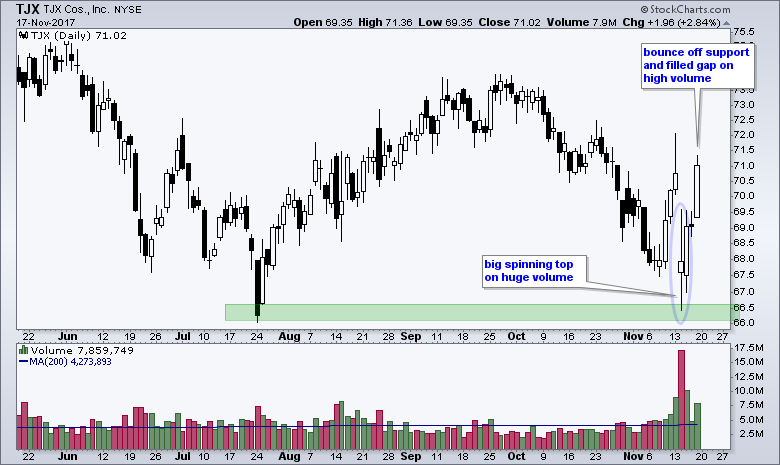
TJX Companies Reverses with Big Spinning Top
by Arthur Hill,
Chief Technical Strategist, TrendInvestorPro.com
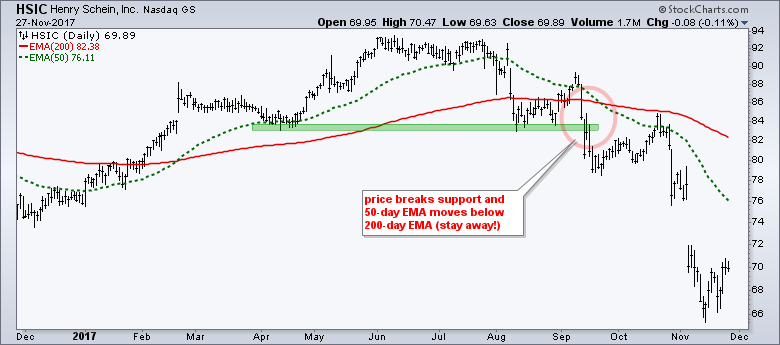
Retail stocks surged last week and discounter TJX Companies ($TJX) bounced off support with high volume. Technically, the big trend is still down because the 50-day EMA is below the 200-day EMA and TJX is below the 200-day EMA. These EMAs are not shown on the chart to keep it...
READ MORE
MEMBERS ONLY
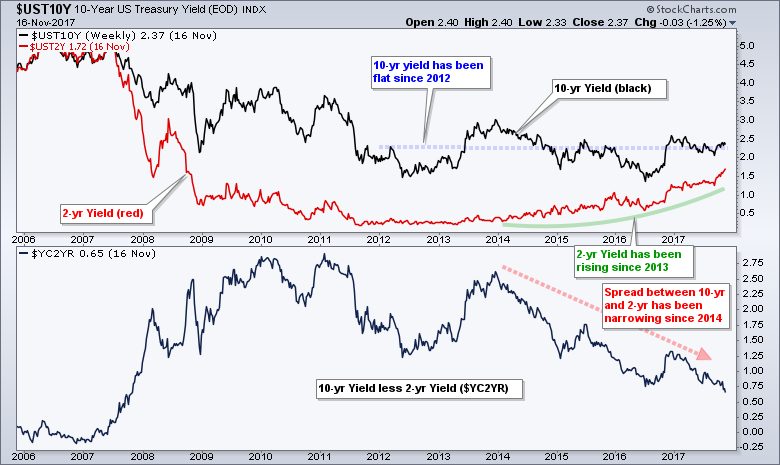
What Does a Flat Yield Curve Look Like Anyway?
by Arthur Hill,
Chief Technical Strategist, TrendInvestorPro.com
I hear talk that the yield curve is flattening and that this is a problem for the stock market. While it is true that the spread between the 10-yr T-Yield ($UST10Y) and 2-yr T-Yield ($UST2Y) is the lowest since 2007, the yield curve itself is by no means flat. The...
READ MORE
MEMBERS ONLY
Weekly Market Review & Outlook (with Video) - Small Caps and Retailers Take the Lead - Energy Hits Moment of Truth
by Arthur Hill,
Chief Technical Strategist, TrendInvestorPro.com
.... Broad Strength in the Nasdaq 100
.... IJR Bounces from Oversold Levels
.... Small-cap Sector Leaders
.... Healthcare and Consumer Discretionary Surge
.... Retail SPDR Goes for a Bottom
.... Starbucks, Nike and Disney Power XLY Higher
.... SPY Bounces as QQQ Hits New High
.... Four Sectors Correct (XLF, XLI, XLB, XLV)
.... Bobby, Billy and Arthur...
READ MORE
MEMBERS ONLY
A Raging Battle in the Bond Market - Junk Bond Update - Big Banks - Copper - Biotechs - Disney
by Arthur Hill,
Chief Technical Strategist, TrendInvestorPro.com
.... A Raging Battle in the Bond Market
.... Junk Bond Update
.... Big Banks Shrug off Yield Plunge
.... Copper Corrects with Bullish Wedge
.... And then there were Three
.... Biotech SPDR Becomes Oversold Again
.... Competition Increasing for NetFlix
.... Disney Goes for Lift Off ....
A Raging Battle in the Bond Market
There is a...
READ MORE
MEMBERS ONLY
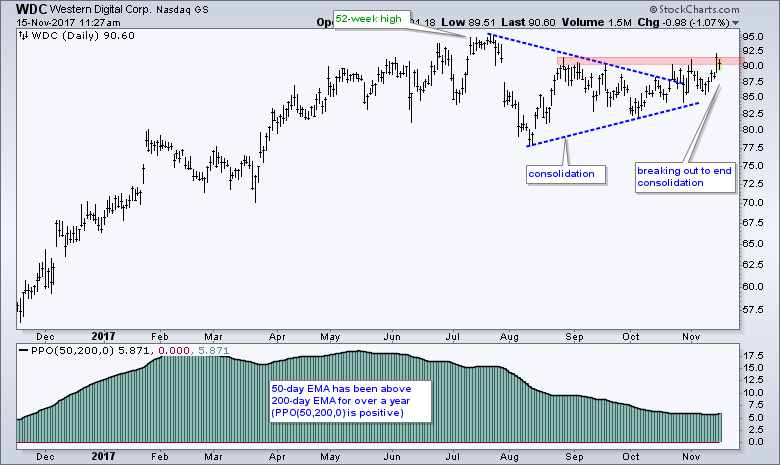
Western Digital Breaks Out of Continuation Pattern
by Arthur Hill,
Chief Technical Strategist, TrendInvestorPro.com
Western Digital (WDC) appears to be emerging from a consolidation pattern and this increases the chances of new highs in the coming weeks. The chart shows WDC hitting a new high in July and then falling with a rather sharp decline into early August. The stock immediately rebounded after this...
READ MORE
MEMBERS ONLY
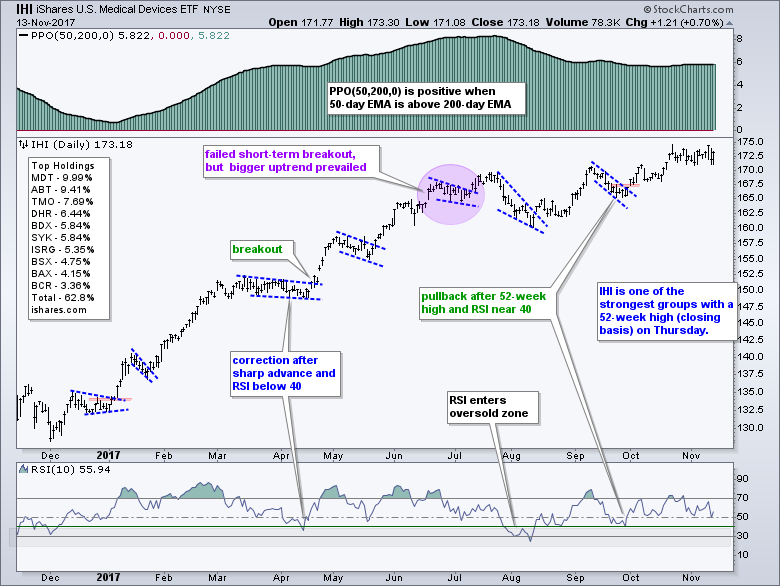
Dissecting the Medical Devices Group - Discount Brokers with Bullish Continuation Patterns - Banks, Gold, Utes and the 10-yr Yield
by Arthur Hill,
Chief Technical Strategist, TrendInvestorPro.com
.... Medical Devices Group Leads Healthcare
.... Medtronic Bids to End Correction
.... Abbot Labs Leads Medical Device Group
.... Boston Scientific Bounces from Oversold Levels
.... Four Medical Device Stocks (WAT, VAR, ALOG, CMD)
.... First Oversold Readings Since Breakouts (BMY, BIIB)
.... Discount Brokers Consolidate within Uptrends
.... Banks, Utilities, Gold and the 10-yr T-Yield ....
Medical...
READ MORE
MEMBERS ONLY
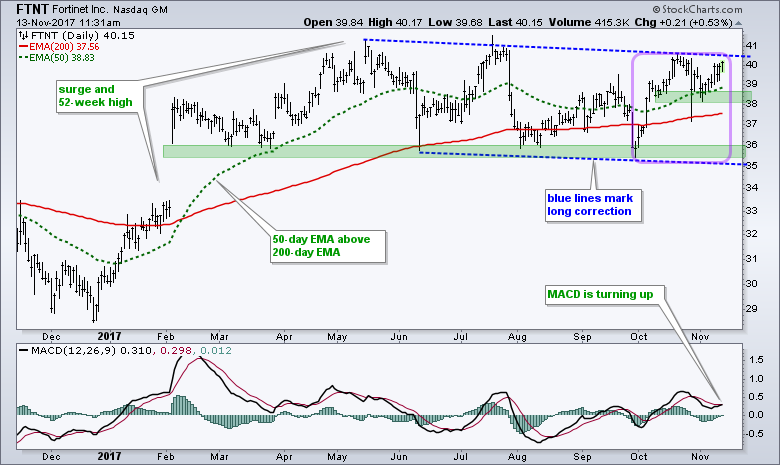
Fortinet Bids to End Long Correction
by Arthur Hill,
Chief Technical Strategist, TrendInvestorPro.com
Stocks close to new highs are usually in uptrends and have a good chance of recording new highs in the near future. Fortinet looks poised for a new high as challenges a channel line after an upturn last week. First and foremost, Fortinet is in a long-term uptrend with the...
READ MORE
MEMBERS ONLY
Weekly Market Review & Outlook (w/ video) - Junk Bonds Fall Hard
by Arthur Hill,
Chief Technical Strategist, TrendInvestorPro.com
.... Risk-on versus Risk-off on One PerfChart
.... Junk Bond ETF Falls Most Since August
.... The Oxymoronic Nature of Technical Analysis
.... SPY Hovers Near its Highs
.... RSI Moves into Oversold Zone for IJR
.... Finance, Industrials and Healthcare Lead Pullback
.... Utilities SPDR Hits 52-week High
.... Technology Remains a Leader (plus XLY)
.... Industrials and...
READ MORE
MEMBERS ONLY
Does the Bond Market Have a Message for the Stock Market? - Plus Mean-Reversion Setups for IJR, XLV and IBB
by Arthur Hill,
Chief Technical Strategist, TrendInvestorPro.com
.... Is the Bond Market Sending a Message?
.... IJR Triggers Mean Reversion Signal
.... RSI Turns Up for the Health Care SPDR
.... When Ugly Charts Provide Opportunities
.... Biotech iShares Dip for the Third Time ....
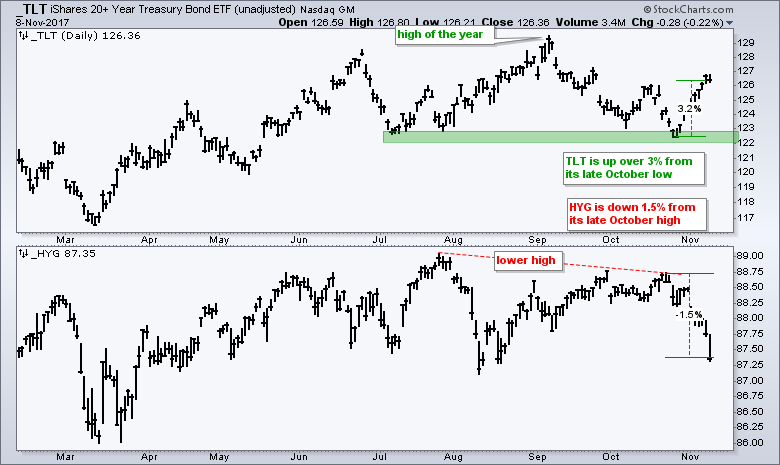
I wrote about the unadjusted High-Yield Bond ETF (_HYG) on October 31st and junk bonds fell rather sharply...
READ MORE
MEMBERS ONLY
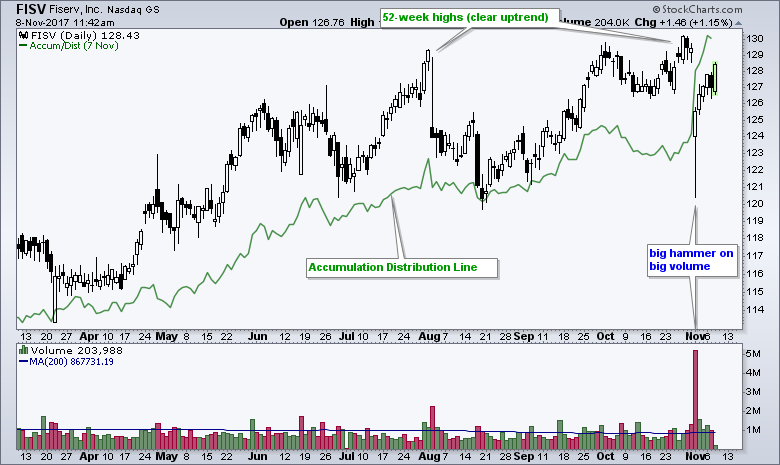
Fiserve Shows Resilience with Move into Gap Zone
by Arthur Hill,
Chief Technical Strategist, TrendInvestorPro.com
Fiserv gapped down and fell on big volume last week, but the candlestick points to an accumulation day and the Accumulation Distribution Line hit a new high. First and foremost, the big trend is up because Fiserve hit a 52-week high with a move above 130 in late October. FISV...
READ MORE
MEMBERS ONLY
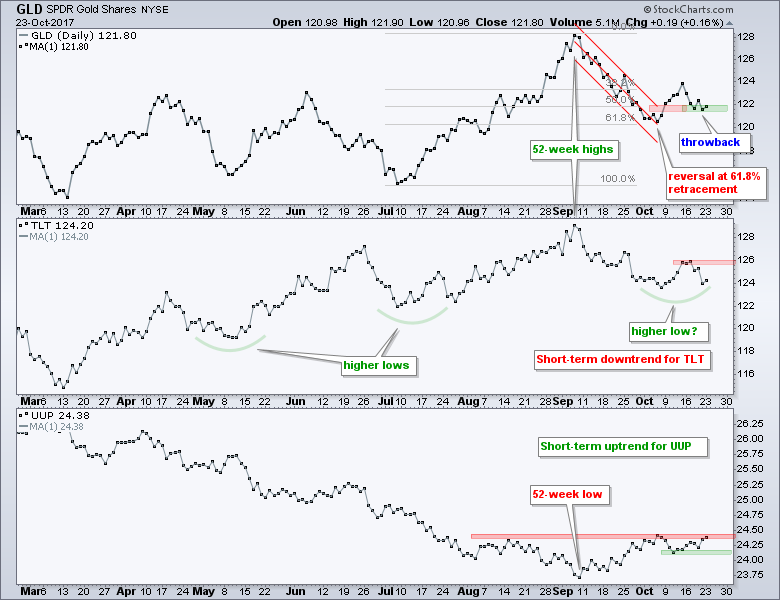
Small Caps are Really Really Small - Gold Firms at Key Retracement - Plus DRI, FCX, GD, KEY, STT and TIF
by Arthur Hill,
Chief Technical Strategist, TrendInvestorPro.com
.... Mid-cap and Large-cap ETFs Hit New Highs
.... Checking the Mean-Reversion Trade for IJR
.... Small-caps are Really Really Small
.... Momentum ETF Extends its Lead
.... Gold Ignores Strength in TLT and UUP
.... Darden and Tiffany
.... Keycorp Consolidates after Surge
.... Two Mean-Reversion Setups (GD, STT)
.... Freeport McMoran Bounces off Support ....
Small-caps are leading...
READ MORE
MEMBERS ONLY
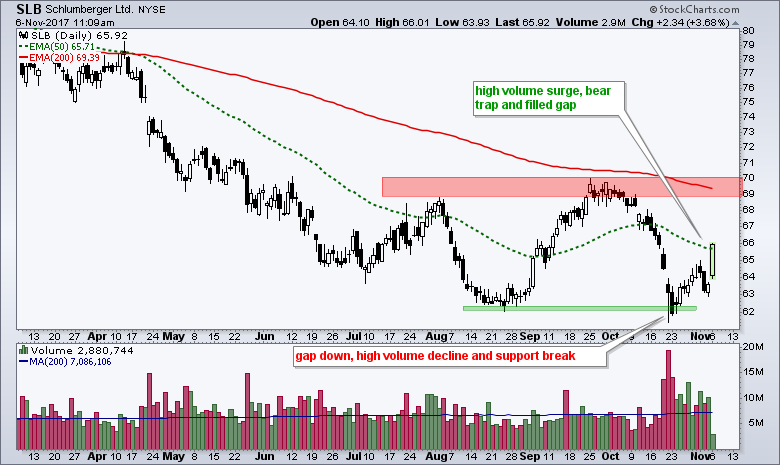
Schlumberger Springs a Bear Trap with Big Volume
by Arthur Hill,
Chief Technical Strategist, TrendInvestorPro.com
Schlumberger (SLB) broke support with a surge in volume, but this support break did not hold as the stock surged with strong volume the last two weeks. The decline below 62 looks like a selling climax because of high volume and the gap down. The surge in volume flushes out...
READ MORE
MEMBERS ONLY
Uptrends: What to Ignore and What to Watch?
by Arthur Hill,
Chief Technical Strategist, TrendInvestorPro.com
An uptrend means prices are advancing and higher highs are the order of the day. We do not know how long a trend will persist, but there is clear evidence that trends persist. Just look at the S&P 500 since early 2016 for a recent example. The 50-day...
READ MORE
MEMBERS ONLY
Weekly Market Review & Outlook - Are Small Caps Leading or Lagging?
by Arthur Hill,
Chief Technical Strategist, TrendInvestorPro.com
.... Those Pesky Timeframes
.... SPY Notches another New High
.... Broad Advance Lifts QQQ to New Highs
.... IJR Fluctuates within Bullish Consolidation
.... Finance and Technology Lead
.... Consumer Discretionary Struggles Internally
.... Utilities and Materials are Close to 52-week Highs
.... Industrials and Healthcare Pull Back within Uptrends
.... XLE Breaks Flag Resistance as Oil Hits...
READ MORE
MEMBERS ONLY
Begin with the Big Trend in Mind - Market, Sector, Industry and Stock
by Arthur Hill,
Chief Technical Strategist, TrendInvestorPro.com
.... Big Winners and Losers During Earnings Season
.... Automatically Charting Sector and Industry Group
.... Follow the Broader Market
.... De-selection is Part of the Selection Process ....
Big Winners and Losers During Earnings Season
Stock picking is a tough game, even in the best of times. Earnings season is still underway and we...
READ MORE
MEMBERS ONLY
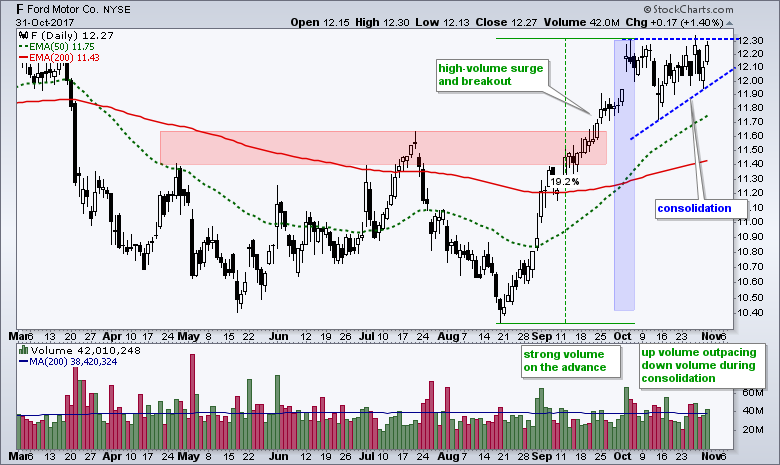
Ford Stalls before Making Next Move
by Arthur Hill,
Chief Technical Strategist, TrendInvestorPro.com
Ford (F) consolidated after a big advance and this consolidation looks like a bullish continuation pattern. First, industry group strength and the long-term uptrend are in Ford’s favor. Ford is part of the red-hot Global Auto ETF (CARZ), which is up over 20% from its April low and trading...
READ MORE
MEMBERS ONLY
Watching Junk Bonds for Clues on Stocks - Two Bad Picks, Two Discount Brokers and Four Cyber Security Plays
by Arthur Hill,
Chief Technical Strategist, TrendInvestorPro.com
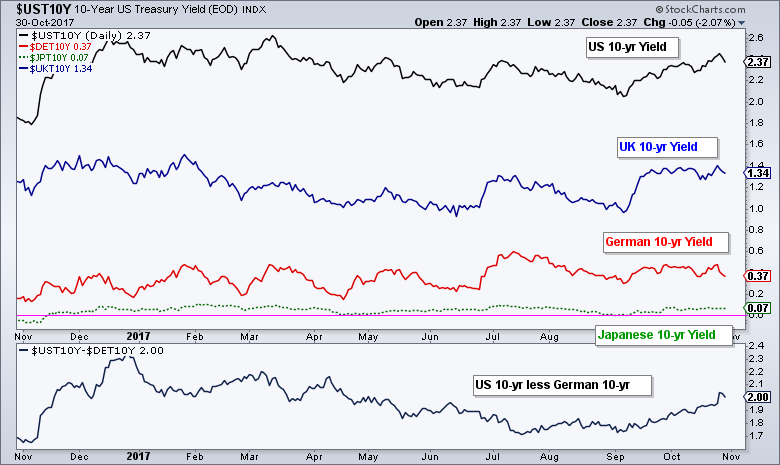
.... Comparing Global Treasury Yields
.... Watch Junk Bonds as a Leading Indicator
.... T-Mobile Fails to Hold Breakout
.... Merck Plunges to Potential Support
.... Two Discount Brokers with Bullish Charts
.... HACK and three Cyber Security Stocks ....
Today we will start with a view of global Treasury yields and show how the US remains...
READ MORE
MEMBERS ONLY
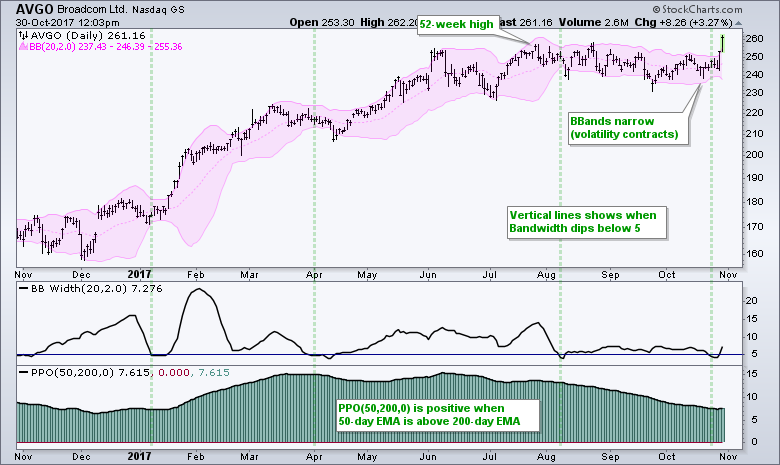
BroadCom Gets a Squeeze and Makes a Move $BRCM
by Arthur Hill,
Chief Technical Strategist, TrendInvestorPro.com
BroadCom looks set to continue its long-term uptrend with a breakout and fresh 52-week high. The chart shows BroadCom (AVGO) with Bollinger Bands, the Bandwidth indicator and the Percentage Price Oscillator (PPO). First, notice that the stock hit a 52-week high in July and the PPO(50,200,0) has...
READ MORE
MEMBERS ONLY
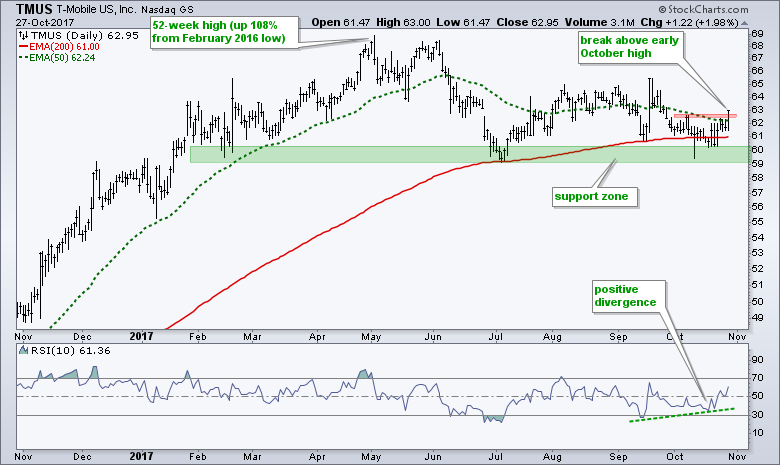
The Divergence is Just Icing on the Cake for T-Mobile $TMUS
by Arthur Hill,
Chief Technical Strategist, TrendInvestorPro.com
T-Mobile is showing signs of life with an upturn off support and a positive divergence in RSI. As always, lets review the bigger picture before trying to make sense of current conditions. TMUS basically doubled from February 2016 to April 2017 with a 108% advance. This massive advance gave way...
READ MORE
MEMBERS ONLY
Weekly Market Review & Outlook (w/ video) - Broad Sector Participation Supports the Bulls
by Arthur Hill,
Chief Technical Strategist, TrendInvestorPro.com
.... Amazon and Google Fool Billy Bear
.... SPY and QQQ Edge Lower after New Highs
.... QQQ Joins the Small-cap Dip
.... IJR Falls Back into Flag Pattern
.... 5 Sectors Hit New Highs - Tech Leads
.... XLB Jumps to Fresh High
.... XLF Breaks out of Flag
.... XLK and XLI Extend with New Highs...
READ MORE
MEMBERS ONLY
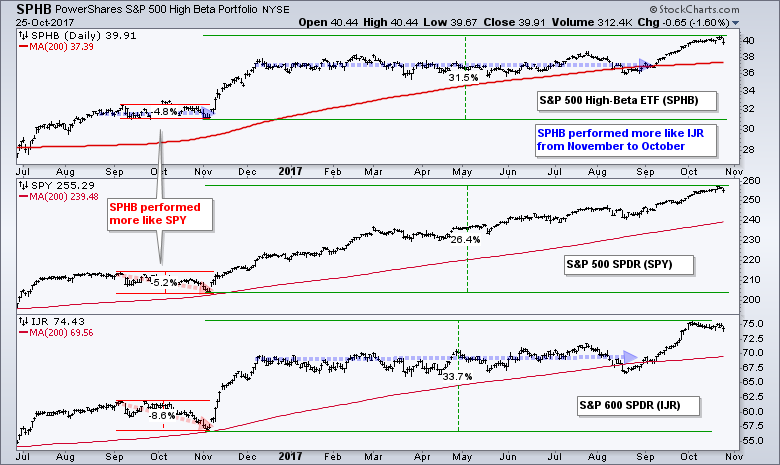
Creating a ChartList of High-Octane Stocks
by Arthur Hill,
Chief Technical Strategist, TrendInvestorPro.com
.... Active Management Comes at a Cost
.... Add Some Beta with the S&P 500 High-Beta ETF
.... Get Serious Beta from the IBD 50 List
.... Creating a ChartList of the IBD 50 ....
Today I am going to step back and show how we can set up a ChartList to focus...
READ MORE
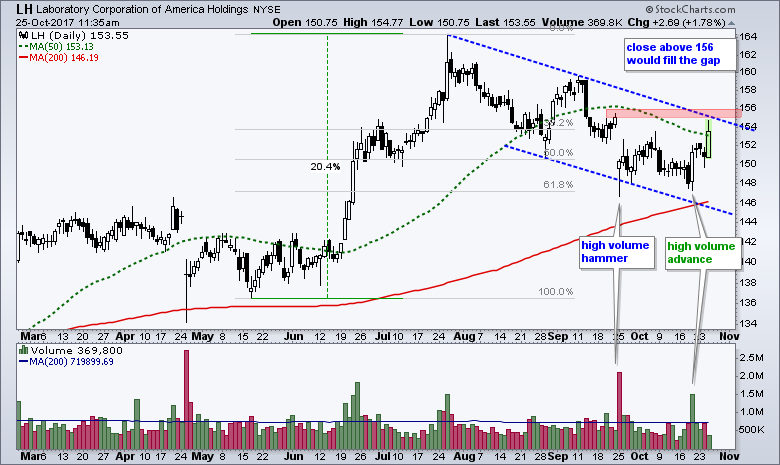
MEMBERS ONLY
A Healthy Reaction to Earnings Reinforces Support in LH
by Arthur Hill,
Chief Technical Strategist, TrendInvestorPro.com
Laboratory Corporation of America (LH) reported earnings today and surged above the 50-day moving average on the results. The trend since late July remains down, but recent price action is constructive and a breakout could be in the offing. The stock surged around 20% and hit a 52-week high in...
READ MORE
MEMBERS ONLY
Metals&Mining ETF Forms Small Continuation Pattern - A Selling Climax for Medical Device Maker - Old School Tech Leads
by Arthur Hill,
Chief Technical Strategist, TrendInvestorPro.com
.... Bonds, Gold and the Dollar
.... XME Holds Breakout with Bullish Pattern
.... Medtronic Hits Reversal Zone with Selling Climax
.... Old School Tech Stocks Take the Lead
.... Facebook and Amazon Stall
.... Uptrends in Alphabet and Apple Slow
.... Palo Alto Forms Bull Flag ....
The short-term uptrend in the Dollar and short-term downtrend in...
READ MORE
MEMBERS ONLY
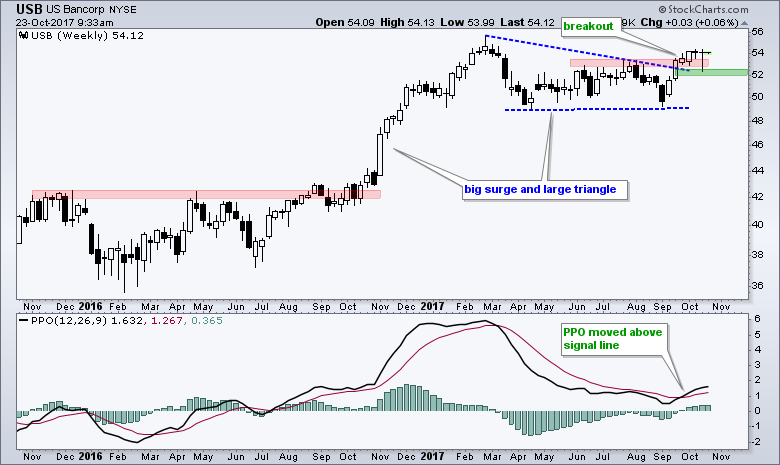
US Bancorp Breaks out of Long Consolidation
by Arthur Hill,
Chief Technical Strategist, TrendInvestorPro.com
US Bancorp (USB) ended a long corrective period with an upside breakout and this breakout is holding. Note that USB is part of the Financials SPDR (XLF) and the Regional Bank SPDR (KRE). These two are up double digits over the last six weeks and this puts has sector and...
READ MORE
MEMBERS ONLY
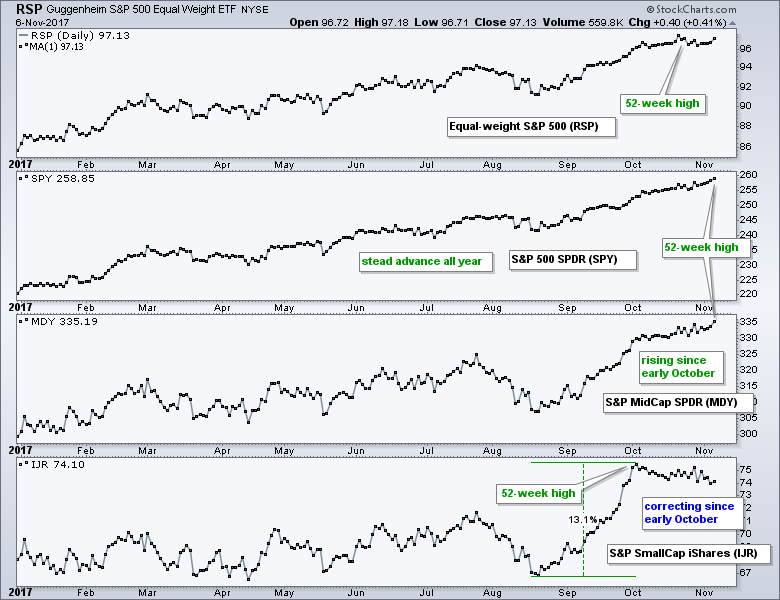
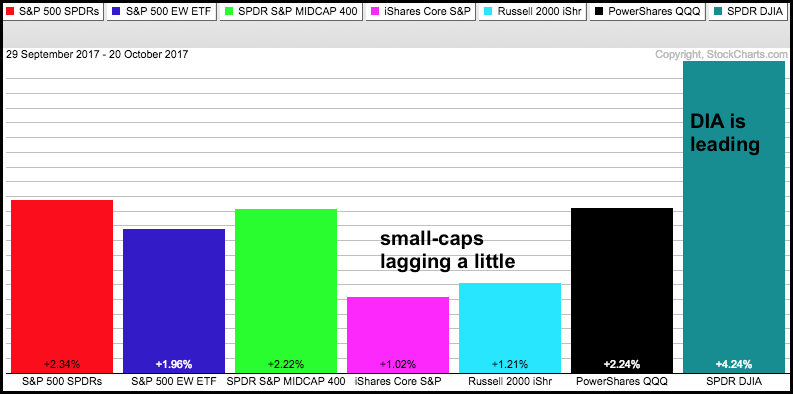
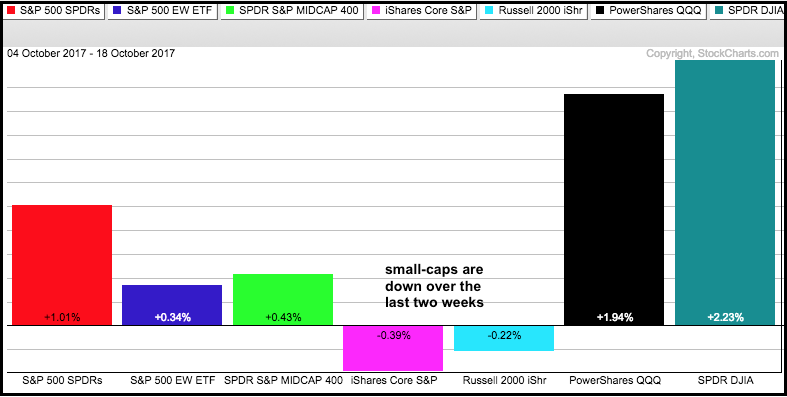
Small-cap ETFs Lag in October, but Break out of Flag Patterns
by Arthur Hill,
Chief Technical Strategist, TrendInvestorPro.com
The EW S&P 500 ETF, S&P MidCap SPDR and S&P 500 SPDR moved to new highs this week, but the S&P SmallCap iShares and Russell 2000 iShares are lagging and remain below their early October highs, which were 52-week highs. The PerfChart...
READ MORE
MEMBERS ONLY
Weekly Market Review & Outlook - Flag and Consolidations Abound
by Arthur Hill,
Chief Technical Strategist, TrendInvestorPro.com
.... Large-caps and Mid-caps Hit New Highs
.... SPY has been "Overbought" Since mid September
.... QQQ Hits Another New High
.... Flags, Pennants and Short-term Consolidations
.... IWM and IJR Remain with Falling Flags
.... XLY Forms Bullish Pennant
.... XLF and XLI Consolidate after Big Moves
.... XLE Tests Flag Lows
.... Tech, Healthcare and...
READ MORE
MEMBERS ONLY
Flag Failure in Oil & Gas Equipment & Services ETF Could Bode Ill for Oil and XLE - Small-caps Correct - Oracle Bounces
by Arthur Hill,
Chief Technical Strategist, TrendInvestorPro.com
.... Small-cap ETFs Form Falling Flags
.... XLE Stalls as XES Breaks Down
.... Watching Two Timeframes for Oil
.... Shipping ETF Turns Up
.... Oracle Bounces off Support ....
There are lots of small consolidations on the charts as the market digests the gains from mid August to early October. The S&P 500...
READ MORE
MEMBERS ONLY
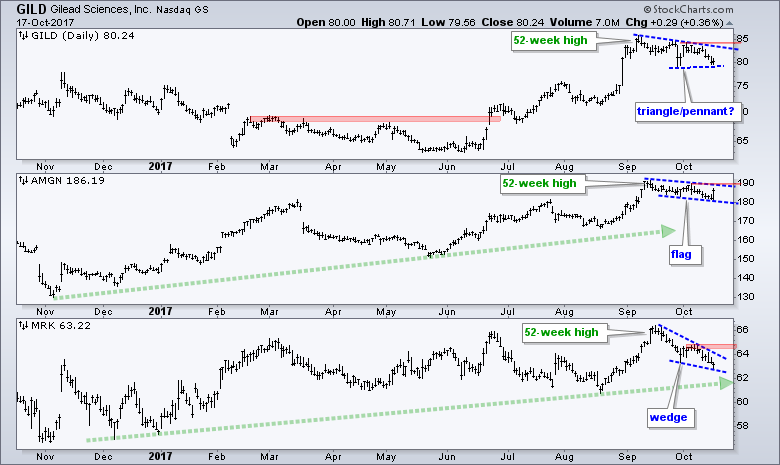
Three Pullbacks for Three Healthcare Stocks
by Arthur Hill,
Chief Technical Strategist, TrendInvestorPro.com
Chartists should watch Gilead (GILD), Amgen (AMGN) and Merck ($MRK) because all three are forming bullish continuation patterns. First and foremost, all three hit new highs in September so it is safe to assume that the long-term trends are up. AMGN and MRK have been trending higher the last 12...
READ MORE
MEMBERS ONLY
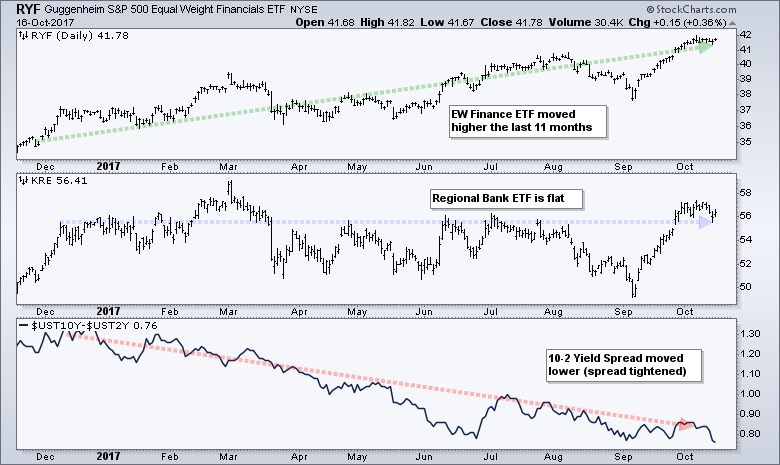
Finance Sector Ignores Flattening Yield Curve - A Deeper Dive into Correlation
by Arthur Hill,
Chief Technical Strategist, TrendInvestorPro.com
.... Finance Sector Ignores Flattening Yield Curve
.... 2-yr Yield Hits New High
.... Yield Curve is not a Problem Until
.... Correlation between KRE and the 10-yr Yield
.... Correlation is Not Everything
.... Back to Chart Basics
.... Play the Pullback ....
Finance Sector Ignores Flattening Yield Curve
What would happen to the EW Finance ETF...
READ MORE
MEMBERS ONLY
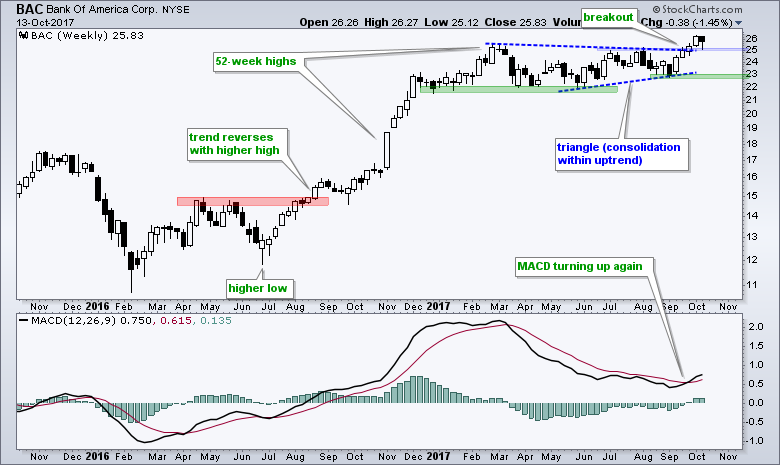
Bank of America Holds above Breakout Zone $BAC
by Arthur Hill,
Chief Technical Strategist, TrendInvestorPro.com
Bank of America (BAC) broke out of a large bullish continuation pattern three weeks' ago and this breakout is holding. Overall, BAC surged from June 2016 to February 2017 and then consolidated with a large triangle pattern. A consolidation within an uptrend is a bullish continuation pattern and the...
READ MORE
MEMBERS ONLY
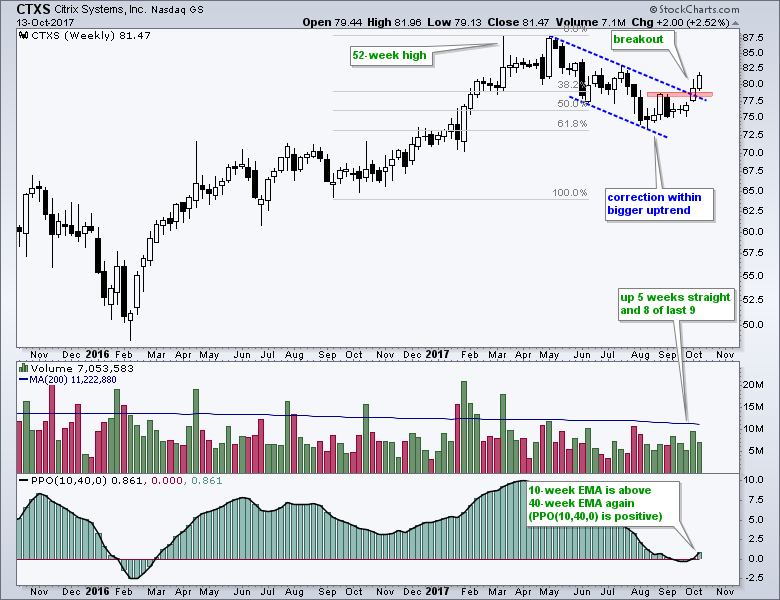
Citrix Ends Correction with Five Week Surge
by Arthur Hill,
Chief Technical Strategist, TrendInvestorPro.com
Citrix (CTXS), which is part of the Internet ETF (FDN) and Software iShares (IGV), appears to have ended its correction and resumed its long-term uptrend. The stock hit a 52-week high in early 2017 and then declined from May to August. CTXS underperformed the market and its peers during this...
READ MORE
MEMBERS ONLY
Weekly Market Review & Outlook (with Video) - Consumer Discretionary Weighs on Market
by Arthur Hill,
Chief Technical Strategist, TrendInvestorPro.com
.... Consumer Discretionary Weighs on Market
.... SPY and QQQ Hit Fresh New Highs
.... IJR Edges Lower after Big Run
.... A Hat Trick in the Technology Sector
.... Industrials Pick up the Slack
.... Materials Sector Leads with More New Highs
.... Finance Sector Stalls Near New High
.... Bullish Continuation Patterns Form in Energy
.... XLU...
READ MORE