MEMBERS ONLY
Weekly Market Review & Outlook - Looking at Performance Splits within the Market and Oversold ETFs - Webinar Link
by Arthur Hill,
Chief Technical Strategist, TrendInvestorPro.com
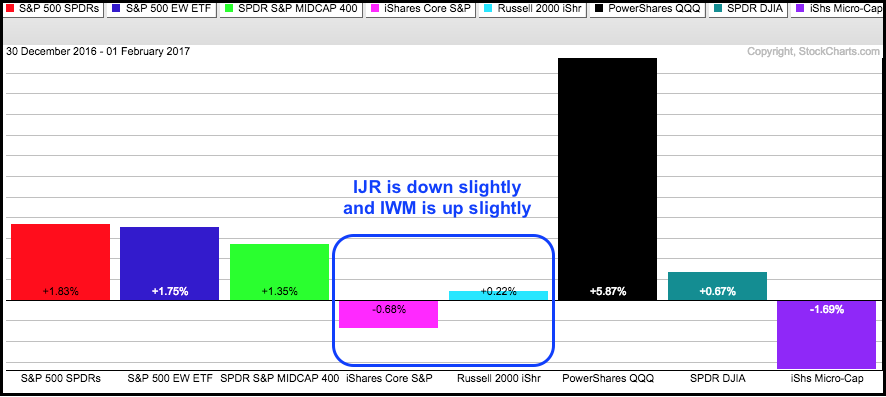
.... Market is Clearly Mixed as Some Groups Correct
.... Small-caps and Mid-caps Lead the Correction
.... New Highs Dry Up, but New Lows remain Low
.... Over 70% of Stocks Still above 200-day EMA
.... SPY Fills the Gap as QQQ Stalls at High Level
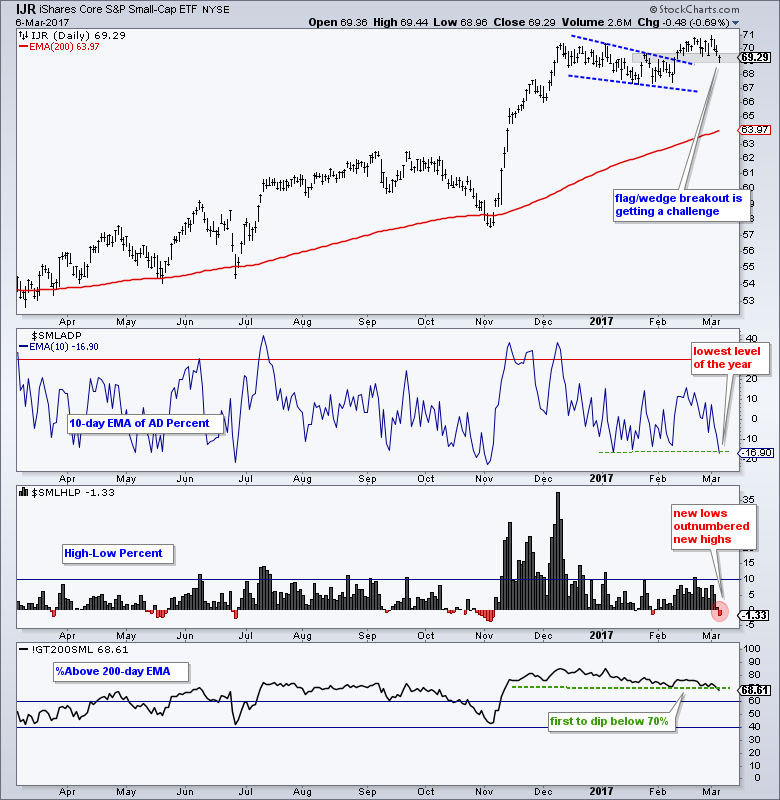
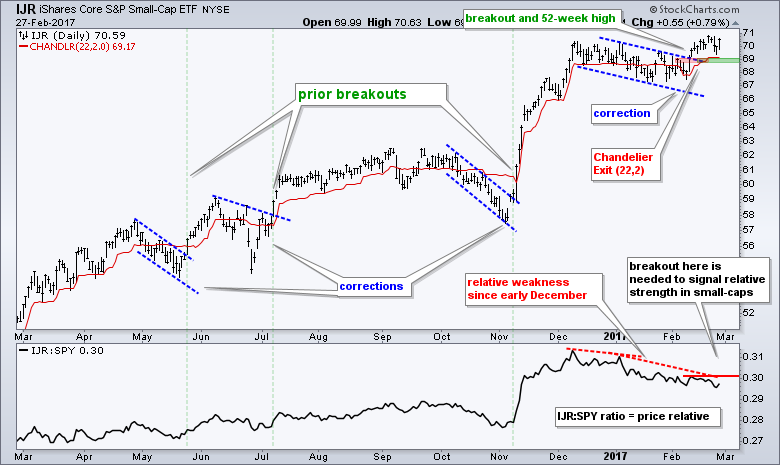
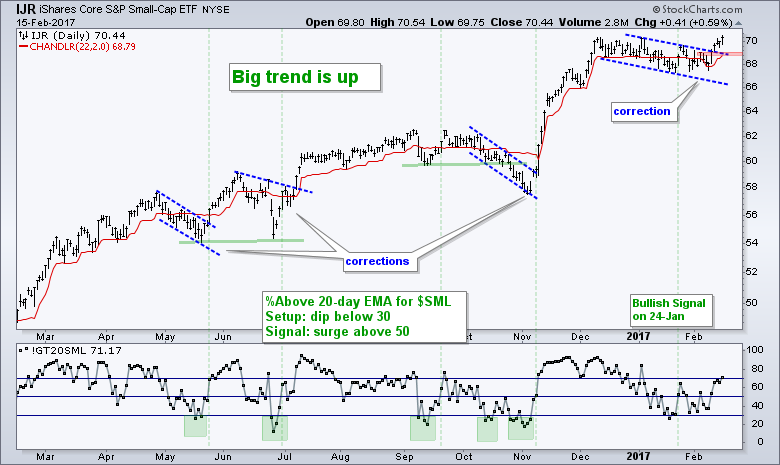
.... IJR Falls Back into Corrective Mode
.... Consumer Discretionary Sector...
READ MORE
MEMBERS ONLY
SystemTrader - Reducing Risk with a Portfolio Approach to Mean-Reversion Trading
by Arthur Hill,
Chief Technical Strategist, TrendInvestorPro.com
.... Failure for One Trader is Opportunity for Another
.... Mean-Reversion Trades and Setups for IJR
.... Backtesting Two Short-term Mean-Reversion Strategies
.... Completed Trade and Current Setup for MDY
.... Testing Five Major index ETFs
.... Trading a Portfolio to Reduce Risk
.... Equity Curve and Drawdown Chart
.... Conclusions
Failure for One Trader is Opportunity for...
READ MORE
MEMBERS ONLY
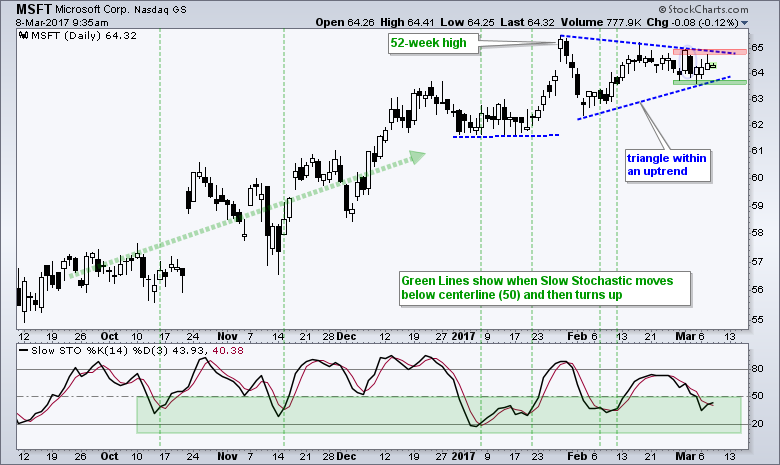
Microsoft Stalls within Uptrend as Stochastic Oscillator Starts to Turn
by Arthur Hill,
Chief Technical Strategist, TrendInvestorPro.com
It always piques my interest when a stock bucks the broader market. Note that SPY and QQQ closed lower the last two days and Microsoft (MSFT) closed higher. Even though it is only for two days, this little morsel of relative strength could foreshadow a bullish resolution to the current...
READ MORE
MEMBERS ONLY
Small-Cap Breadth Deteriorates - Bonds Could Hold the Key for Stocks
by Arthur Hill,
Chief Technical Strategist, TrendInvestorPro.com
.... Small-cap Breadth Deteriorates
.... TLT Tests Support and 2-yr Yields Hits 52-week High
.... Mind the Gaps in these 4 Bank Stocks
.... Where to Check Earnings and News
.... 12 Stocks with Bullish Charts
.... PCN, CX, NUE, EOG, LNG, GE, ATI, JNPR, AKAM, T, EXPE, CAKE
Small-cap Breadth Deteriorates
Stocks declined for the,...
READ MORE
MEMBERS ONLY
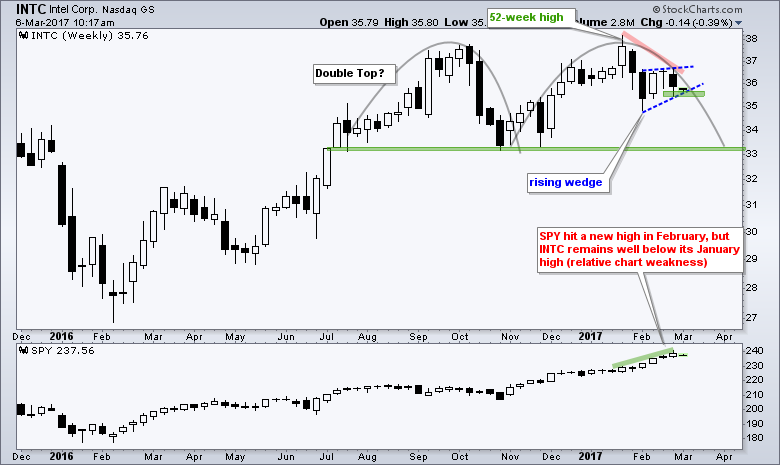
Intel Struggles as Bearish Patterns Take Shape
by Arthur Hill,
Chief Technical Strategist, TrendInvestorPro.com
Intel is not keeping pace with the broader market and chartists should watch the bearish wedge for signs of further weakness. There are two patterns at work on the price chart. First, INTC formed a rising wedge after a sharp decline and this looks like a short-term bearish continuation pattern....
READ MORE
MEMBERS ONLY
Actual Price Action versus Relative Price Action
by Arthur Hill,
Chief Technical Strategist, TrendInvestorPro.com
The price relative tells us how a stock is performing relative to a market benchmark, such as the S&P 500. Even though this relative performance indicator is good for measuring relative momentum, it does not always tell the entire story. A stock can show weakness in relative momentum,...
READ MORE
MEMBERS ONLY
Weekly Market Review & Outlook 4-Mar-17 (w/ video) - Breadth is Strong Enough
by Arthur Hill,
Chief Technical Strategist, TrendInvestorPro.com
----- Video Link ----- Art's Charts ChartList (updated 4-Mar) -----
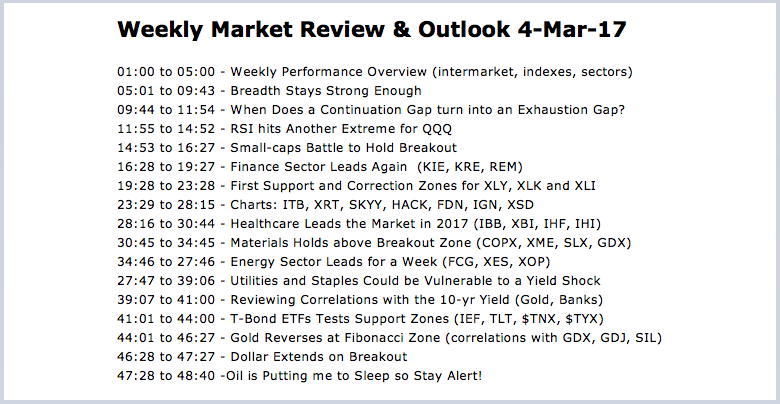
Weekly Market Review & Outlook 4-Mar-17
Financials, healthcare and energy stocks led the stock market higher this week with the S&P 500 SPDR, Nasdaq 100 ETF and S&P MidCap SPDR hitting new highs. The...
READ MORE
MEMBERS ONLY
SystemTrader - Testing a 58-ETF Portfolio using Trend-Timing and Momentum-Rotation
by Arthur Hill,
Chief Technical Strategist, TrendInvestorPro.com
.... Introduction
.... Review of the Testing Period
.... Universe, Timeframe and Data
.... Stock Market and Portfolio Benchmark
.... Trend-Timing System using the PPO
.... Different Faces of Momentum
.... Market Filter, Trend Filter and Momentum
.... Scanning Code Sample
.... Testing Four Momentum Indicators
.... Equity Line and Drawdown Chart
.... Conclusions
Introduction
Last week I presented a trend-timing...
READ MORE
MEMBERS ONLY
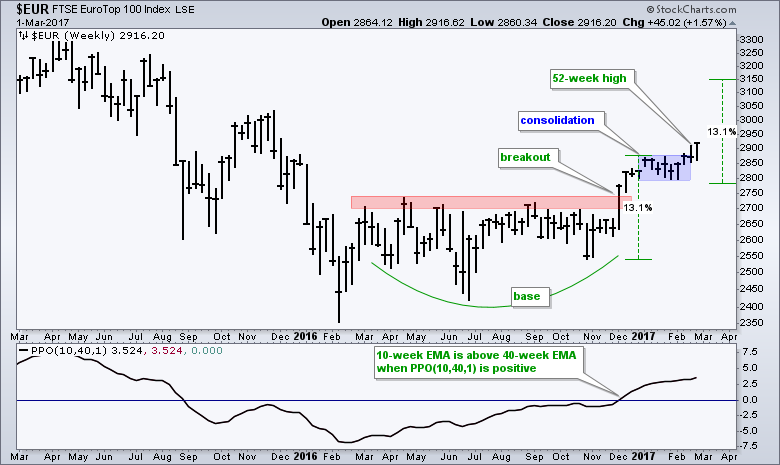
EuroTop 100 Index Ends Consolidations and Resumes Uptrend $EUR
by Arthur Hill,
Chief Technical Strategist, TrendInvestorPro.com
The EuroTop 100 ($EUR) has further room to run after breaking out of a bullish continuation pattern. The price chart shows the index basing from March until November and then breaking above a major resistance zone in early December. After a 13.1% advance in nine weeks, the index paused...
READ MORE
MEMBERS ONLY
Fibonacci Retracements are Not Science and 17 Stocks to Watch
by Arthur Hill,
Chief Technical Strategist, TrendInvestorPro.com
.... Small-caps Hold Breakout, but Still Lag
.... A Classic Throwback for Nucor
.... Oil Remains Stuck in Consolidation
.... Watch the Big Three (XOM, CVX, SLB) for Clues on XLE
.... Two Oil Refiner Stocks (MPC, VLO)
.... Four Oil & Gas Equipment and Services Stocks (NE, NOV, RDC, RIG)
.... Fibonacci Retracements are Not Science...
READ MORE
MEMBERS ONLY
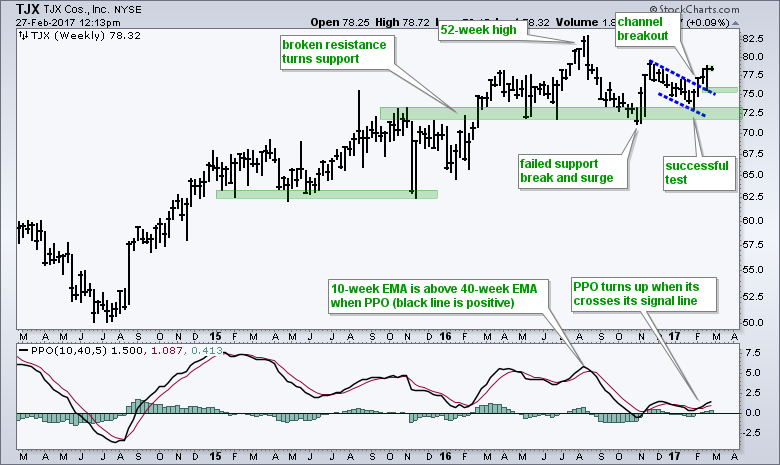
TJX Companies Looks Poised to Extend Uptrend $TJX
by Arthur Hill,
Chief Technical Strategist, TrendInvestorPro.com
TJX Companies (TJX), which operates TJ Maxx and Marshalls, recently broke out of a corrective pattern and this argues for a continuation of the bigger uptrend. It has been a rough year for most retail stocks with the Retail SPDR (XRT) down around 1% year-to-date. In contrast, TJX is up...
READ MORE
MEMBERS ONLY
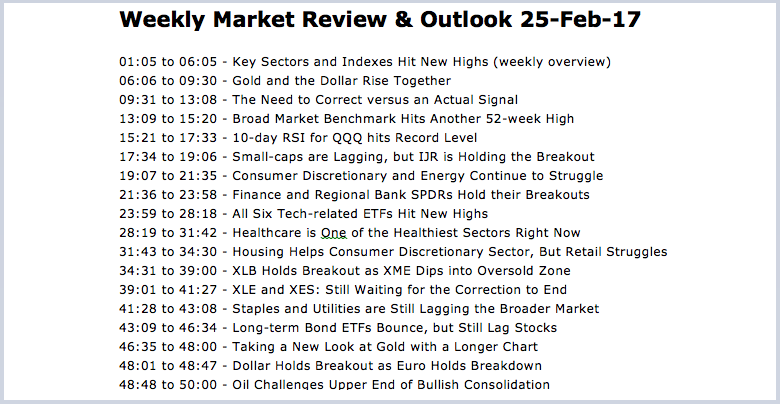
Weekly Market Review & Outlook 25-Feb-17 (w/video) - The Need to Correct versus an Actual Signal
by Arthur Hill,
Chief Technical Strategist, TrendInvestorPro.com
----- Video Link ----- Art's Charts ChartList (updated 25-Feb) -----
Key Sectors and Indexes Hit New Highs
The stock marked notched more new highs this week as the major index ETFs hit new highs during the week (SPY, DIA, IWM, IJR, MDY, QQQ). February is shaping up to...
READ MORE
MEMBERS ONLY
SystemTrader - Testing a Trend-Timing System and Momentum-Rotation System for the nine Sector SPDRs
by Arthur Hill,
Chief Technical Strategist, TrendInvestorPro.com
.... Introduction
.... Testing During Two Bear Markets
.... Universe, Timeframe and Data
.... Using S&P 500 as a Market Filter
.... Trend-Timing System using the PPO
.... Scaling into the S&P 500
.... Momentum-Rotation System using Rate-of-Change
.... Testing Different Momentum Periods
.... Riding the Roller Coaster
.... Conclusions
.... Scan Code
Introduction
I presented a...
READ MORE
MEMBERS ONLY
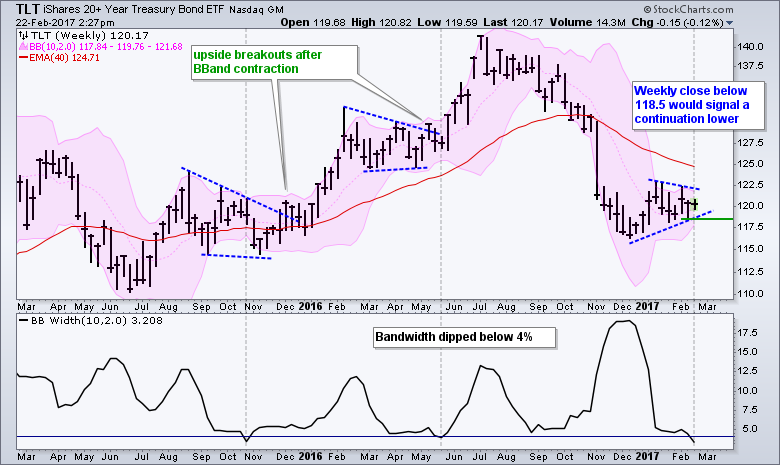
The Noose Tightness as T-Bond ETF Prepares for Next Move
by Arthur Hill,
Chief Technical Strategist, TrendInvestorPro.com
The 20+ YR T-Bond ETF (TLT) is consolidating within a long-term downtrend and this favors a bearish resolution to the current pattern. TLT fell sharply from July to November and broke through its 40-week EMA. The ETF is currently consolidating below the falling EMA and a consolidation within a downtrend...
READ MORE
MEMBERS ONLY
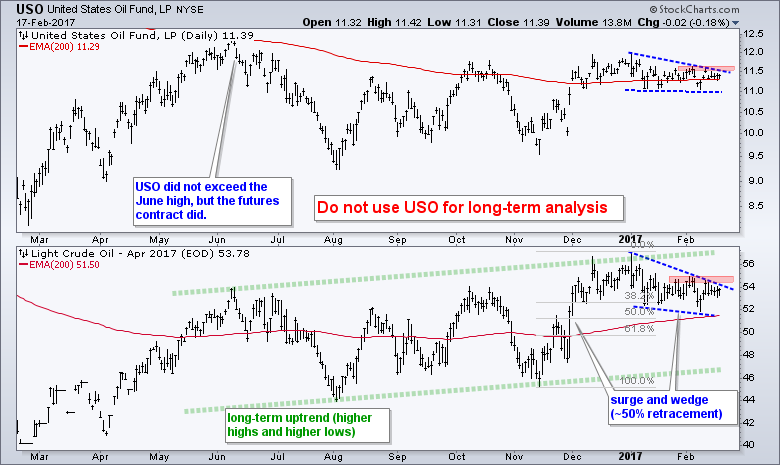
Oil and Energy-related ETFs Look Poised to End Corrections
by Arthur Hill,
Chief Technical Strategist, TrendInvestorPro.com
.... Oil Bounces within Corrective Pattern
.... Measuring the Correlation between Oil and Energy ETF
.... XLE, XES and XOP Correct Along with Oil
.... Focus on Gold for Precious Metals ETFs
.... Watching the Wedge and Fib Retracement in Gold
.... 14 Bullish Stock Charts ....
Oil Bounces within Corrective Pattern
I will start off today...
READ MORE
MEMBERS ONLY
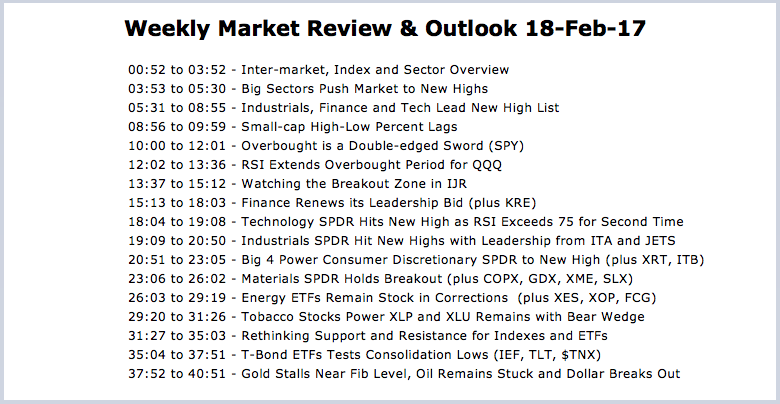
Weekly Market Review & Outlook 18-Feb-2017 - Banks Lead Finance Sector as New Highs Surge
by Arthur Hill,
Chief Technical Strategist, TrendInvestorPro.com
----- Video Link ----- Art's Charts ChartList (updated 18-Feb) -----
Programming Note: The Art's Charts Chartlist has been updated with 30 annotated charts covering the industry group ETFs. The outline above is for the video and I cover many of these industry group ETFs in the...
READ MORE
MEMBERS ONLY
Rethinking Support and Resistance for Indexes and ETFs
by Arthur Hill,
Chief Technical Strategist, TrendInvestorPro.com
Just like potato salad in the fridge, support and resistance levels for the S&P 500 have a shelf life and become stale over time. The value of the S&P 500 is based on the price of its individual component stocks. Support and resistance levels for the...
READ MORE
MEMBERS ONLY
Housing and Retail Stocks Power the Consumer Discretionary Sector
by Arthur Hill,
Chief Technical Strategist, TrendInvestorPro.com
.... Small-caps Join the New High Parade
.... Housing and Retail Come to Life
.... Equal-Weight Consumer Discretionary Sector Breaks Out
.... Five Housing Stocks to Watch (DHI, FBHS, KBH, SKY, TOL)
.... Commercial Metals Resumes Bigger Uptrend
.... United Airlines Challenges Flag Resistance
.... Cornerstone OnDemand Consolidates Above 200-day EMA
.... Itron Ends Correction with Breakout
.... AbbVie...
READ MORE
MEMBERS ONLY
WBA Turns Up after Deep Correction
by Arthur Hill,
Chief Technical Strategist, TrendInvestorPro.com
Walgreens Boots Alliance (WBA) has traded quite choppy over the last 12 months, but I think the bigger trend is up and the recent wedge breakout is bullish. First, notice that WBA broke above a major resistance zone with the November-December surge. This move forged a 52-week high and set...
READ MORE
MEMBERS ONLY
Webinar Recording - Bonds Plunge and Yields Surge - Banks Benefit - Utilities, REITs and Gold Suffer - IJR Holds Breakout - Stocks to Watch
by Arthur Hill,
Chief Technical Strategist, TrendInvestorPro.com
TLT Forms Bearish Continuation Pattern
There is not much change in the broad market environment. The long-term trends are up, but SPY and QQQ are looking extended and ripe for a rest. IJR already got its rest and broke out on Friday to end its corrective period. This pits large-caps...
READ MORE
MEMBERS ONLY
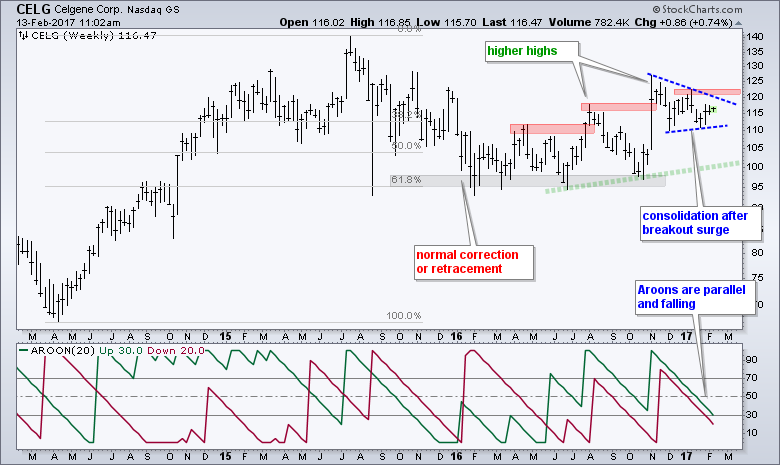
Celgene Stalls within Trend - What's Next?
by Arthur Hill,
Chief Technical Strategist, TrendInvestorPro.com
Celgene (CELG) has not made much headway the last twelve months, but the overall trend is up and the current consolidation looks like a bullish continuation pattern. Taking a step back, notice that CELG doubled from the April 2014 low to the July 2015 high (~70 to ~140). The stock...
READ MORE
MEMBERS ONLY
Weekly Market Review & Outlook (with Video) - Consumer Discretionary, Housing and Retail Come Alive - Small-cap Breakout - Banks Key Off 10-yr Yield - Copper and Alum Lead Metals
by Arthur Hill,
Chief Technical Strategist, TrendInvestorPro.com
----- Video Link ----- Art's Charts ChartList (updated 11-Feb) -----
Banks, Small-caps and the 10-yr Yield
Stocks extended their uptrends with the S&P 500, S&P MidCap 400 and Nasdaq 100 hitting new highs this week. The S&P Small-Cap 600 did not hit...
READ MORE
MEMBERS ONLY
SystemTrader .... Building a Momentum Trading System for Stocks .... Backtest Results .... Scan Code
by Arthur Hill,
Chief Technical Strategist, TrendInvestorPro.com
---- Introduction
---- Trading Universe and Timeframe
---- Culling the Herd
---- Volatility Filter
---- Minimum Liquidity Filter
---- Minimum Price Filter
---- Maximum Rate-of-Change Filter
---- Setting the Trading Rules
---- Backtest Results
---- Conclusions, Scan Code and FAQ ----
Introduction
This System Trader article will introduce and update...
READ MORE
MEMBERS ONLY
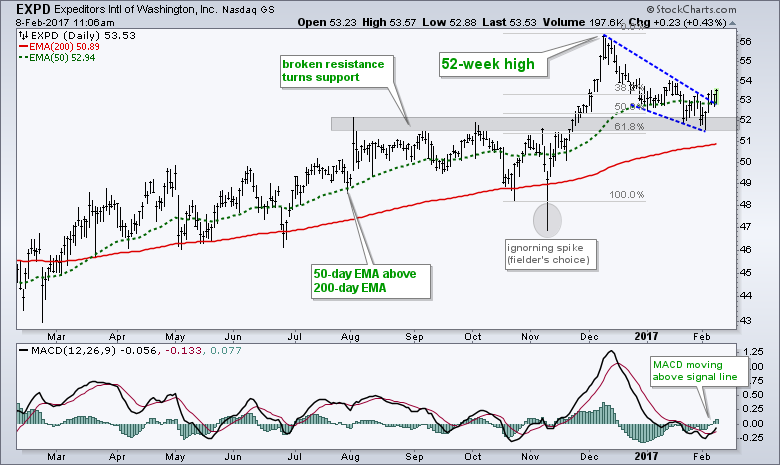
Expeditors Hits Reversal Zone and Turns
by Arthur Hill,
Chief Technical Strategist, TrendInvestorPro.com
Expeditors International of Washington (EXPD), a logistics services provider, is part of the Dow Transports and the Industrials SPDR. The stock caught my eye because it is in a long-term uptrend and recently pulled back to a potential reversal zone. First, the long-term trend is clearly up because the stock...
READ MORE
MEMBERS ONLY
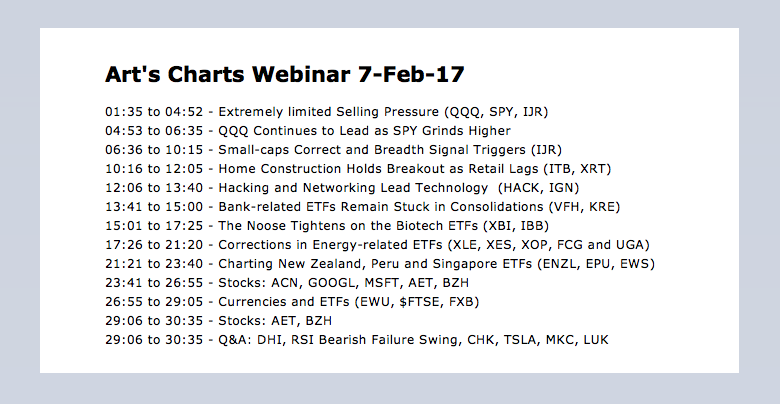
Webinar Recording - Minimal Selling Pressure - Are Small-Caps Ending their Correction? - HACK and IGN Lead Techs - Defense Breaks Out
by Arthur Hill,
Chief Technical Strategist, TrendInvestorPro.com
----- Webinar Video ----- Art's Charts ChartList -----
Today I will start out with simple close-only charts for SPY, QQQ and IJR. Close-only charts filter out the intraday noise and gaps that may occur between sessions. These charts show us just how dull the market has been since...
READ MORE
MEMBERS ONLY
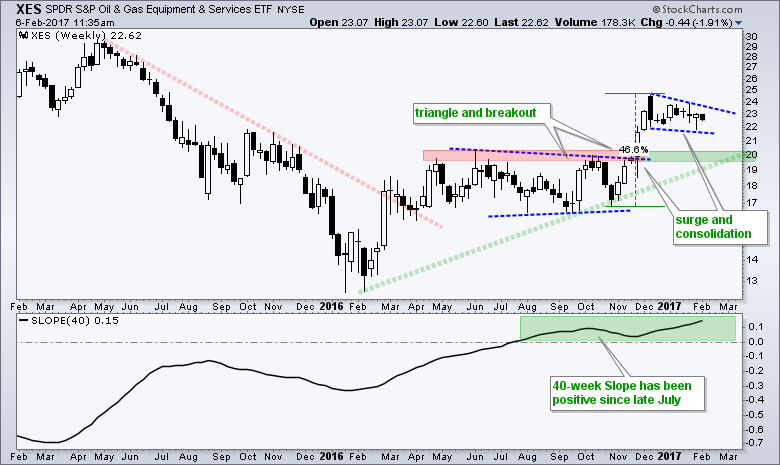
Oil & Gas Equipment & Services SPDR Stalls after Big Surge
by Arthur Hill,
Chief Technical Strategist, TrendInvestorPro.com
The Oil & Gas Equipment & Services SPDR (XES) surged to 52-week highs in November and early December. It is clear after this surge that the bigger trend is up. First, the 40-week Slope turned positive in late July and remains positive. Second, the ETF broke out of a large...
READ MORE
MEMBERS ONLY
Weekly Market Review & Outlook (with Video) - Healthcare Heats Up - Energy Extends Correction - Bonds Remain Weak - Gold and Dollar Hit Reversal Zones
by Arthur Hill,
Chief Technical Strategist, TrendInvestorPro.com
Weekly Performance Review
There was a lot of pushing and shoving in the markets this week. Stocks started the week with a modest move lower and finished the week with a modest move higher. The end result was a .16% gain for the S&P 500 SPDR. The 20+...
READ MORE
MEMBERS ONLY
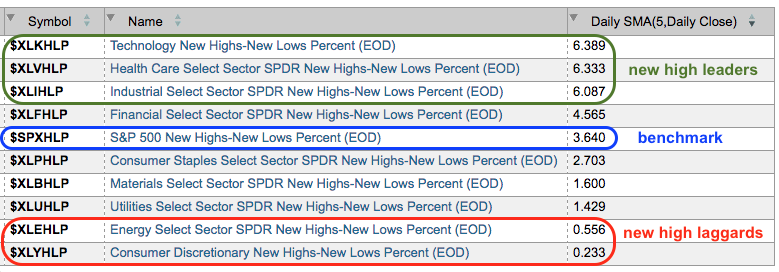
New Highs Expand in the Healthcare Sector
by Arthur Hill,
Chief Technical Strategist, TrendInvestorPro.com
New highs are a sign of underlying strength and chartists can measure this indicator using High-Low Percent. In particular, I like to rank the nine sectors by High-Low Percent or a moving average of High-Low Percent. Note that High-Low Percent equals new highs less new lows divided by total issues....
READ MORE
MEMBERS ONLY
Blame Small-Caps - A Surprising Sector Shows Leadership in 2017 - EEM Nears 52-week High - ChartList Update
by Arthur Hill,
Chief Technical Strategist, TrendInvestorPro.com
Blame Small-Caps for Mixed Up Market .... A Big Surprise for the 3rd Leading Sector .... Breadth Indicators Trigger for Healthcare Sector .... XLV Moves back above Long-term Moving Averages .... Biotech ETFs Spring Back to Life .... Emerging Markets ETF Nears 52-week High .... ChartList Update (16 stocks) .... Food for Thought .... //// ....
Blame Small-Caps for Mixed...
READ MORE
MEMBERS ONLY
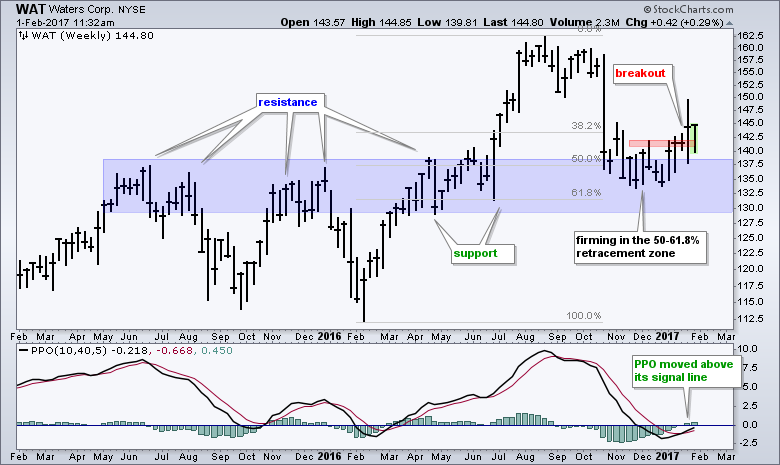
Waters Corp Turns Up and Leads in 2017
by Arthur Hill,
Chief Technical Strategist, TrendInvestorPro.com
Waters Corp (WAT) was hit hard with a double-digit decline in October, but the stock ultimately firmed in November-December and turned up in 2017. Waters Corp is in the top 20% of S&P 500 stocks for year-to-date gain. The chart also looks rather promising. Even though the October...
READ MORE
MEMBERS ONLY
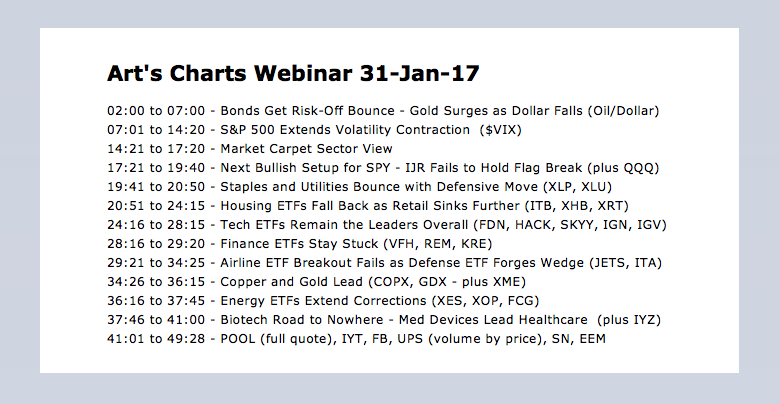
Webinar Video - Volatility Contraction Extends - Next Bullish Setup for SPY - Retail SPDR Bucks the Selling
by Arthur Hill,
Chief Technical Strategist, TrendInvestorPro.com
----- Webinar Video ----- Art's Charts ChartList -----
S&P 500 Extends Volatility Contraction .... The Next Bullish Setup for SPY .... IJR Fails to Hold Flag Break .... Housing ETFs Take a Hit, but Breakouts Remain .... Retail ETF Bucks the Selling Pressure .... Airline ETF Fails to Hold Breakout .... iShares...
READ MORE
MEMBERS ONLY
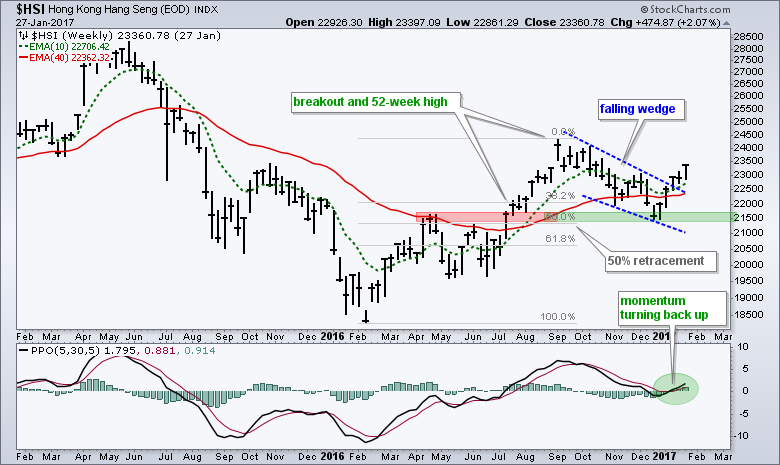
Hang Seng Reverses after a Normal Correction
by Arthur Hill,
Chief Technical Strategist, TrendInvestorPro.com
The Hang Seng Composite ($HSI) is having a good year with a 6% gain year-to-date. The weekly chart also looks bullish because the big trend is up and a correction just ended. First, the index broke resistance with a sharp advance from late June to early September. Second, the index...
READ MORE
MEMBERS ONLY
Weekly Market Review & Outlook Video - Bullish Percent Index Rankings and High-Low Percent Rankings
by Arthur Hill,
Chief Technical Strategist, TrendInvestorPro.com
This is a companion video to the written Weekly Market Review & Outlook. After starting with an overview of the weekly standouts, I also look into the components for the Cyber Security ETF (06:50 mark), scanning for High-Low Percent (18:00 mark) and a table ranking the Bullish Percent...
READ MORE
MEMBERS ONLY
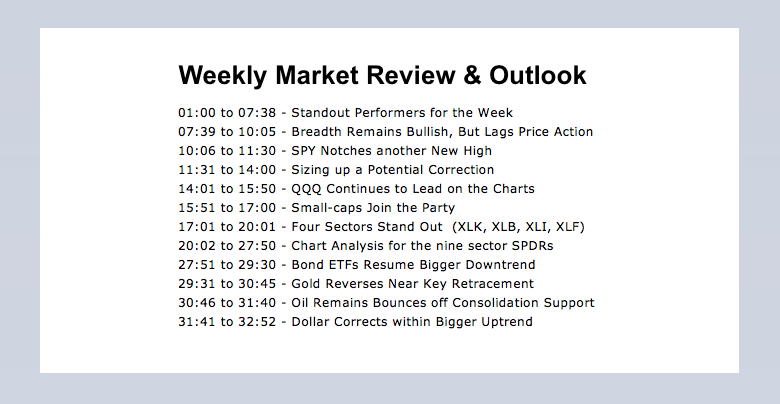
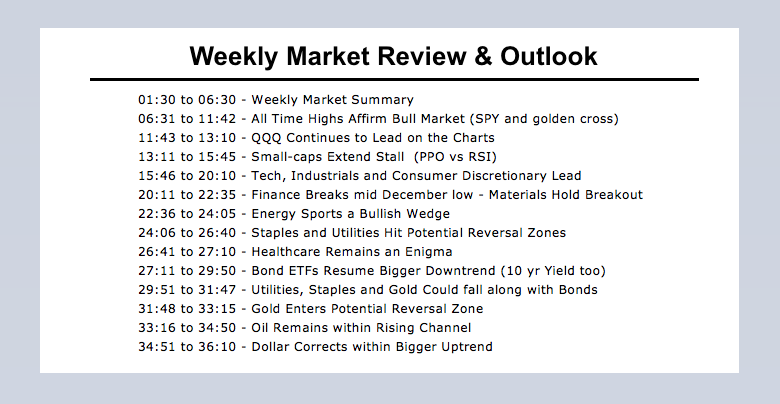
Weekly Market Review & Outlook - Breadth Remains Bullish, but Lags Price Action - Ranking the Sector by Bullish Percent and High-Low Percent - Bonds, Gold, Oil and Dollar
by Arthur Hill,
Chief Technical Strategist, TrendInvestorPro.com
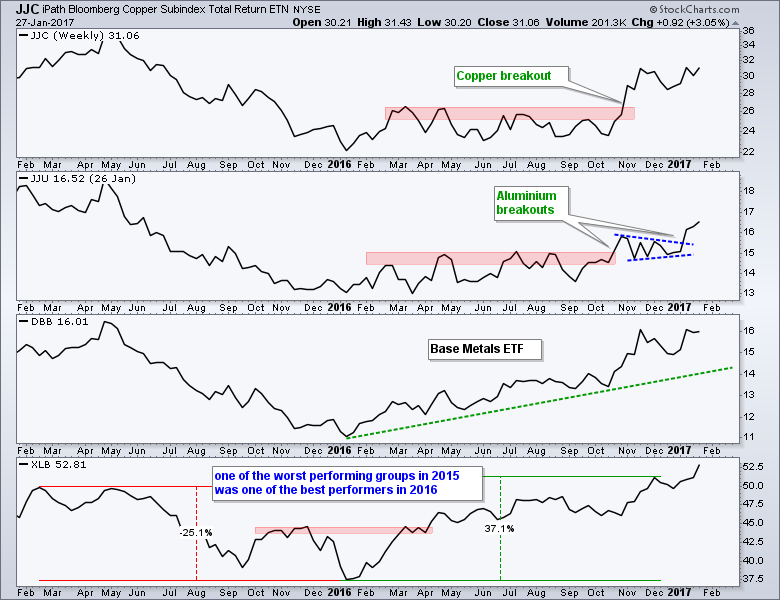
.... Weekly Market Review & Outlook
.... Breadth Remains Bullish, But Lags Price Action
.... SPY Notches another New High
.... Sizing up a Potential Correction
.... QQQ Continues to Lead on the Charts
.... Small-caps Join the Party with Flag Breakout
.... Four Sectors Stand Out (XLK, XLI, XLB, XLF)
.... Materials Sector Extends Breakout
.... Energy Sports...
READ MORE
MEMBERS ONLY
Mid-caps Leading - IJR Breaks Flag Resistance - New Highs Abound - 14 Stock Charts
by Arthur Hill,
Chief Technical Strategist, TrendInvestorPro.com
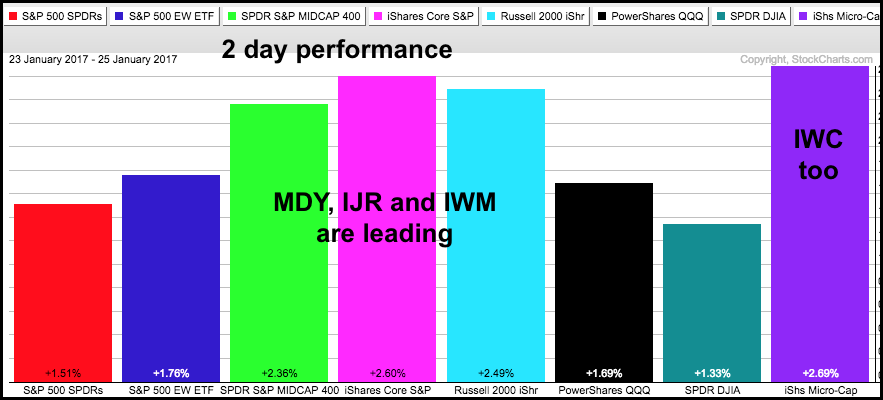
Small-caps Surge, but Mid-caps Lead Year-to-date .... IJR Breaks Flag Resistance .... SPY and QQQ Hit New Highs .... 14 Stocks Added to ChartList .... Food for Thought.... //// ....
I will start with the S&P SmallCap iShares (IJR) because it led the bounce over the last two days. The PerfChart shows the eight...
READ MORE
MEMBERS ONLY
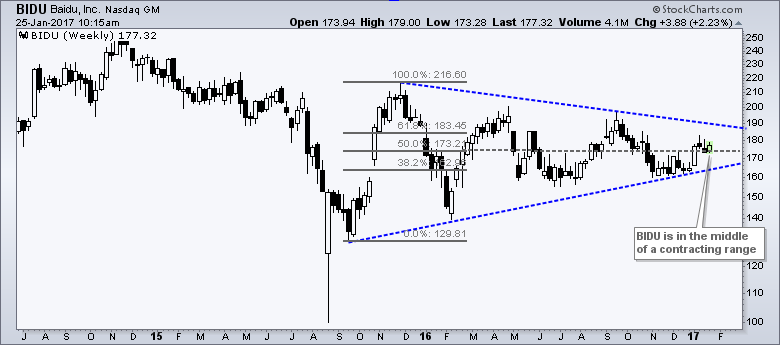
Baidu Forms a Bullish Pattern within a Massive Triangle (plus a Chaikin Money Flow Technique)
by Arthur Hill,
Chief Technical Strategist, TrendInvestorPro.com
Baidu (BIDU) has gone nowhere for a year as a large triangle pattern formed on the weekly chart. There are, however, signs of support and a short-term bullish pattern is emerging on the daily chart. First, the weekly chart shows a triangle that extends from around 120 to 218 at...
READ MORE
MEMBERS ONLY
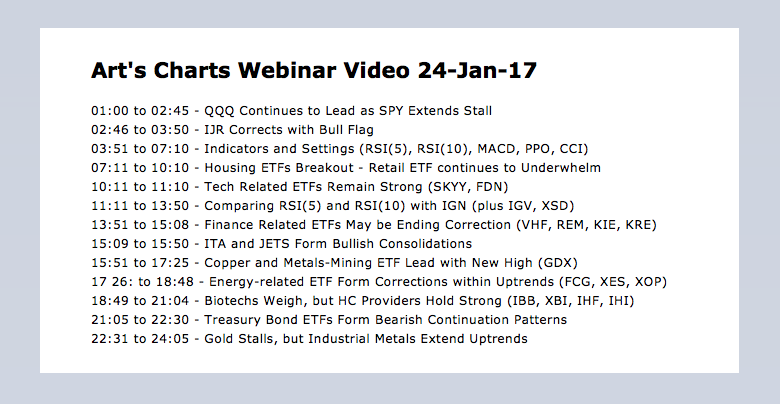
Webinar Video - Small-cap ETF Corrects with Bull Flag - Tech-related ETFs Continue to Lead - Housing, Retail and Banks Hold Market Back
by Arthur Hill,
Chief Technical Strategist, TrendInvestorPro.com
Webinar Video ..... QQQ Continues to Lead as SPY Extends Stall .... IJR Corrects with Bull Flag .... Indicators and Settings .... Housing ETFs Remain in Corrective Mode .... Retail ETF continues to Underwhelm .... Tech Related ETFs Remain Strong .... Comparing RSI(5) and RSI(10) with IGN .... Finance Related ETFs are Correcting .... RSI Enters Oversold...
READ MORE
MEMBERS ONLY
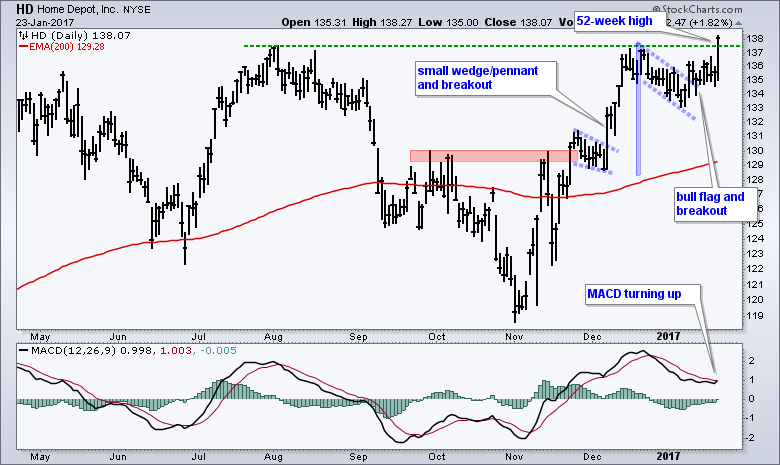
Home Depot Leads with Flag Breakout and 52-week High
by Arthur Hill,
Chief Technical Strategist, TrendInvestorPro.com
In what could be a good sign for housing and the economy, Home Depot (HD) exceeded its summer highs and hit a 52-week high. Home Depot is an interesting company because can be considered part of the housing industry and the retail industry. These two industries are very important to...
READ MORE
MEMBERS ONLY
Weekly Market Review & Outlook Video
by Arthur Hill,
Chief Technical Strategist, TrendInvestorPro.com
This is a companion video to go with the full written commentary (here). I will start out with a review of the weekly performers using the summary format on a ChartList. I will then move into the major index ETFs with special attention to SPY. I will also discuss the...
READ MORE
MEMBERS ONLY
5 Boring Uptrends in 5 Exciting Stocks
by Arthur Hill,
Chief Technical Strategist, TrendInvestorPro.com
One would normally not consider Facebook, Alphabet, Apple, Amazon and Microsoft boring. Well, maybe Microsoft. All joking aside, these tech titans are the biggest stocks in the Nasdaq 100 ETF (QQQ) and they account for around 40% of the ETF. This means traders or investors in QQQ best follow these...
READ MORE