MEMBERS ONLY
Is this Stall Bullish or Bearish? - Measuring the Risk Appetite - XLK, XLF and XLE Lead - XRT Attempts Breakout - Webinar Video
by Arthur Hill,
Chief Technical Strategist, TrendInvestorPro.com
Is Stalling Bullish or Bearish? .... Key Risk Indicators Remain Net Bullish .... Technology, Finance and Energy Lead .... Consumer Discretionary Groups Lag Long-term, But Lead Short-term .... Retail SPDR Attempts Breakout, But Housing Breaks Down .... //// ....
Is Stalling Bullish or Bearish?
Stocks started their stall in mid July and continued that stall into early...
READ MORE
MEMBERS ONLY
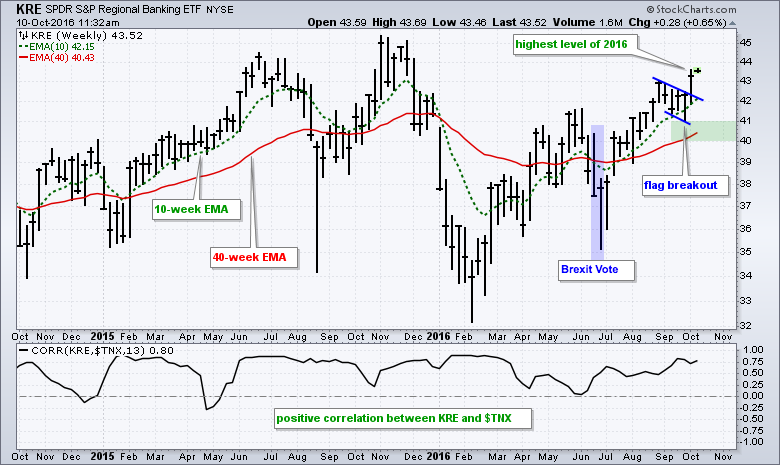
Rising Rates and Strong Seasonality are Part of a Bullish Recipe for Banks
by Arthur Hill,
Chief Technical Strategist, TrendInvestorPro.com
The rise in Treasury yields and bullish fourth quarter provide a strong tail-wind for banking stocks as we head into year-end. After experiencing a wicked whipsaw in June from the Brexit vote, the Regional Bank SPDR (KRE) surged in early July and resumed an uptrend that began with the February...
READ MORE
MEMBERS ONLY
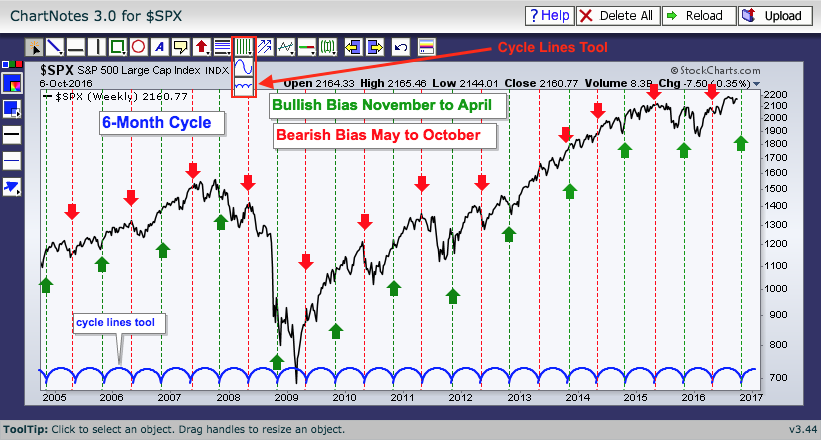
SystemTrader - Testing the Best Six Months Strategy - Tweaking and Adding MACD - Comparing to Market Timing - Historically Strong Q4 Arrives
by Arthur Hill,
Chief Technical Strategist, TrendInvestorPro.com
Introduction .... Background for the Best Six Month Strategy .... Seasonal Patterns Don't Always Work .... Testing the Classic Six-Month Cycle .... Tweaking the Cycle to Account for Seasonality .... Add Market Timing with weekly MACD .... SPY, MACD and Seasonality Now .... Tough to Beat EMA Crossover System .... Final Thoughts as Q4 Hits .... //// ....
Introduction...
READ MORE
MEMBERS ONLY
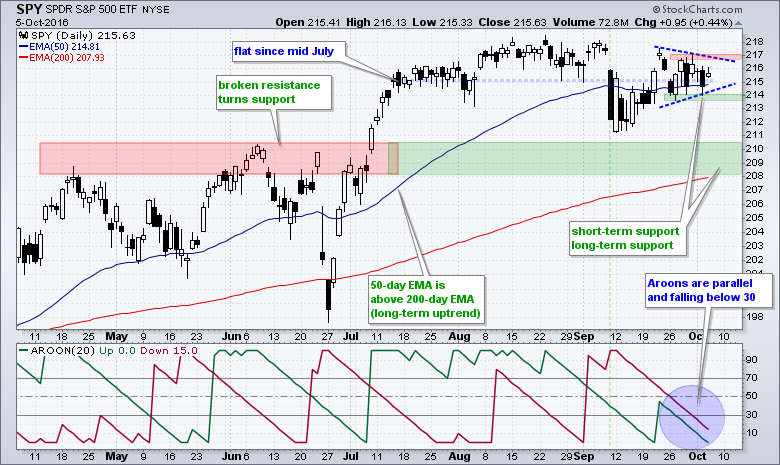
Aroons Crash on SPY Chart - Short-Term Yields Rising Faster - Charting and Scanning Bollinger Band Width - ChartList Update
by Arthur Hill,
Chief Technical Strategist, TrendInvestorPro.com
Aroon Indicators Crash on SPY Chart .... IWM and QQQ Continue to Outperform .... Financials, Utilities and the 10-yr Yield .... Short-term Yields Rising Faster than Long-term Yields .... Plotting, Analyzing and Scanning with Bollinger Bands .... ChartList Update .... //// ....
The S&P 500 SPDR (SPY) moved back above 215 on Wednesday, but remains range...
READ MORE
MEMBERS ONLY
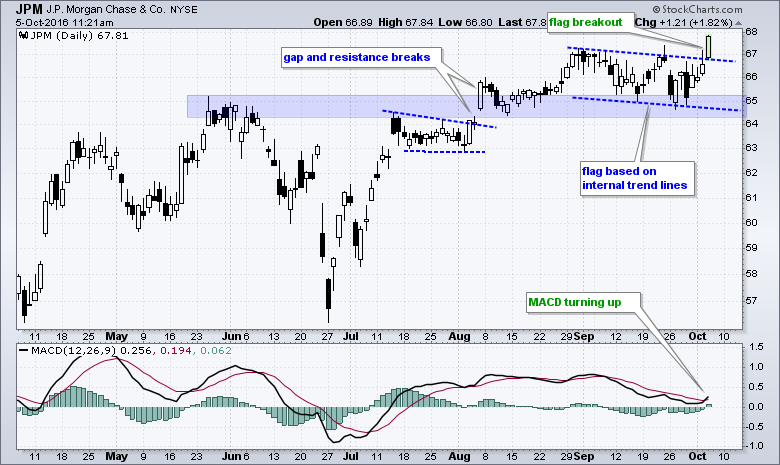
JP Morgan Leads Financials with Breakout and New High
by Arthur Hill,
Chief Technical Strategist, TrendInvestorPro.com
Banking stocks are leading the market on Wednesday and JP Morgan is leading the sector as one of the first of the big banks to hit a new high. I featured the Regional Bank SPDR (KRE) and the Bank SPDR (KBE) in ChartWatchers this weekend and JPM has the same...
READ MORE
MEMBERS ONLY
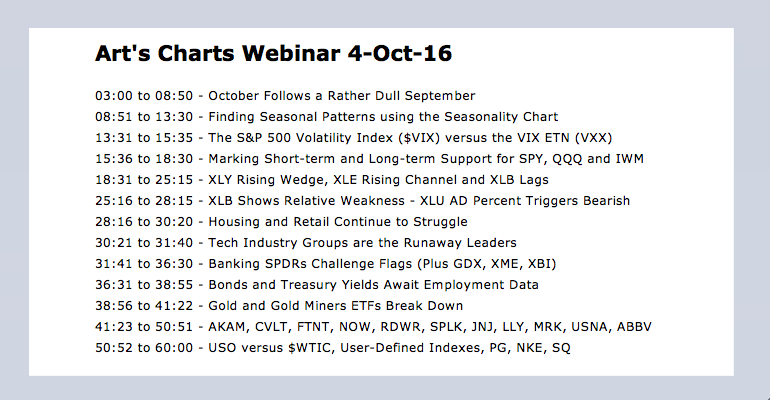
From a Dull September to a Colorful October - Shifting the Seasonality Chart - VIX versus VXX - Webinar Video
by Arthur Hill,
Chief Technical Strategist, TrendInvestorPro.com
September was Dull .... October has a History .... Shifting the Seasonality Chart for Two Views .... The VIX versus the Volatility ETNs .... Webinar Video .... //// ....
Click here for the Webinar Video
September was Dull
October is here and the consensus is for a volatile month. I can certainly understand the reasoning because historical...
READ MORE
MEMBERS ONLY
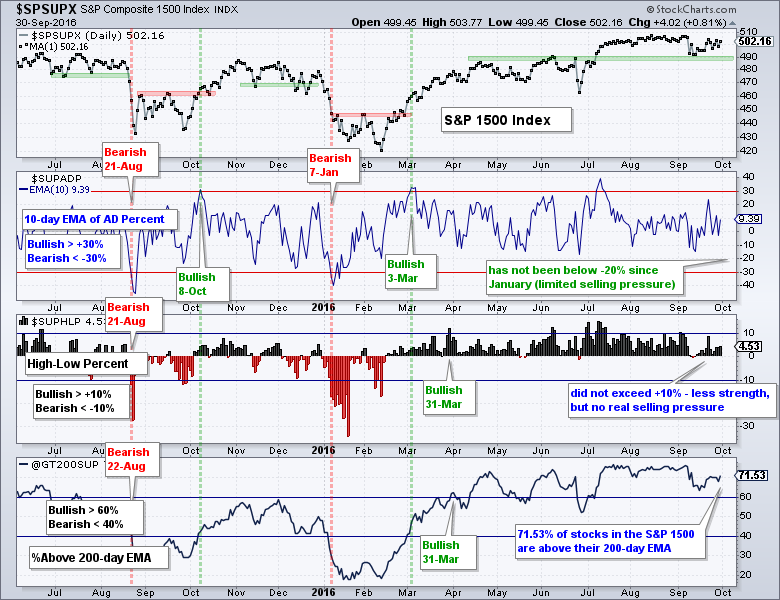
Broad Market Breadth Bullish - SPY Holds above Resistance Break - T-Bonds Wilt - Oil Breaks Wedge - ChartList Update
by Arthur Hill,
Chief Technical Strategist, TrendInvestorPro.com
Broad Market Breadth Remains Bullish .... SPY Holds above Resistance Break .... 7-10 YR T-Bond ETF Fails to Hold Gains .... Oil Breaks a Wedge .... A Couple Dozen Charts to Watch .... //// ....
Broad market breadth turned bullish in March and will remain bullish until there is a bearish signal. I use breadth indicators for...
READ MORE
MEMBERS ONLY
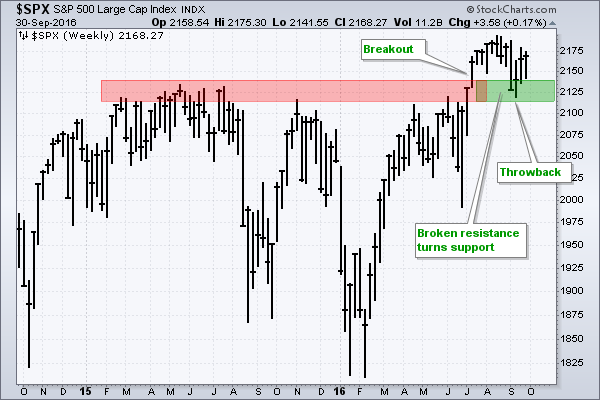
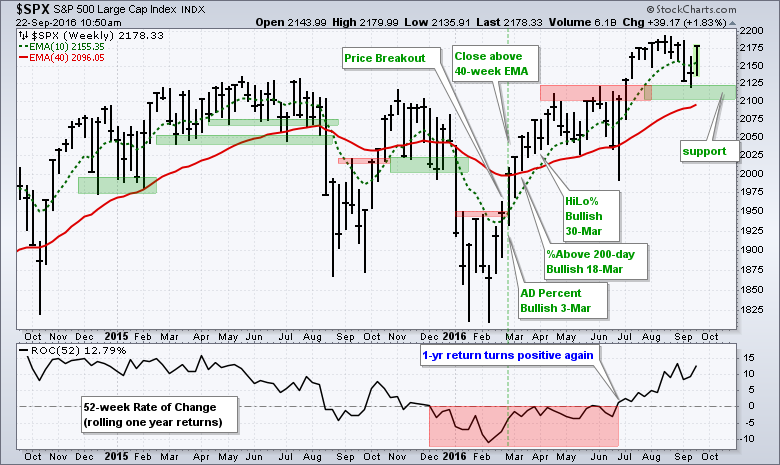
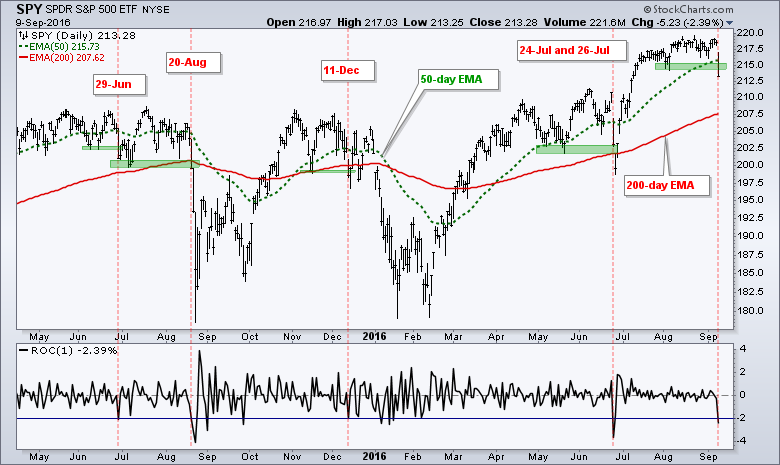
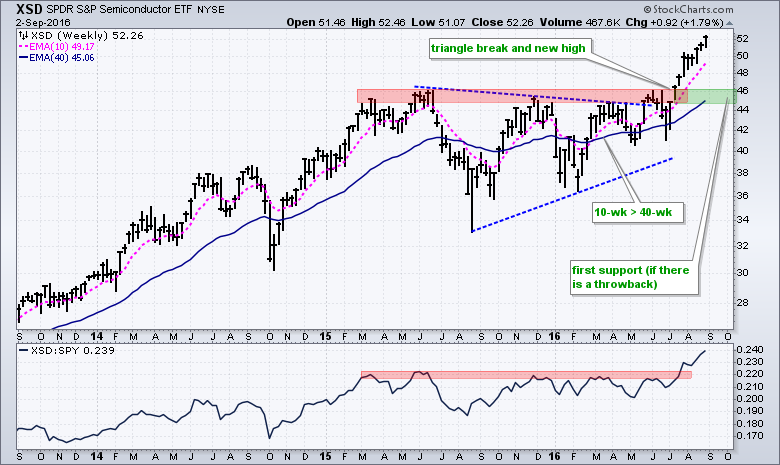
S&P 500 Holds Resistance Breakout with Successful Throwback
by Arthur Hill,
Chief Technical Strategist, TrendInvestorPro.com
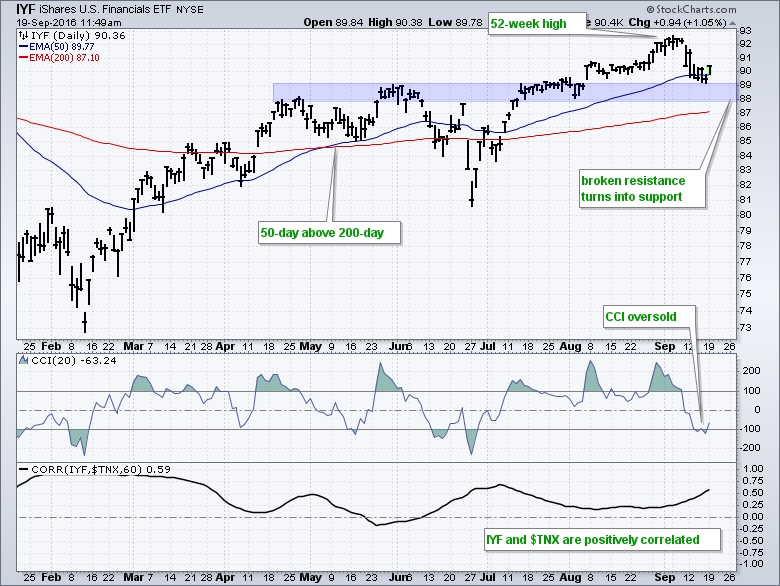
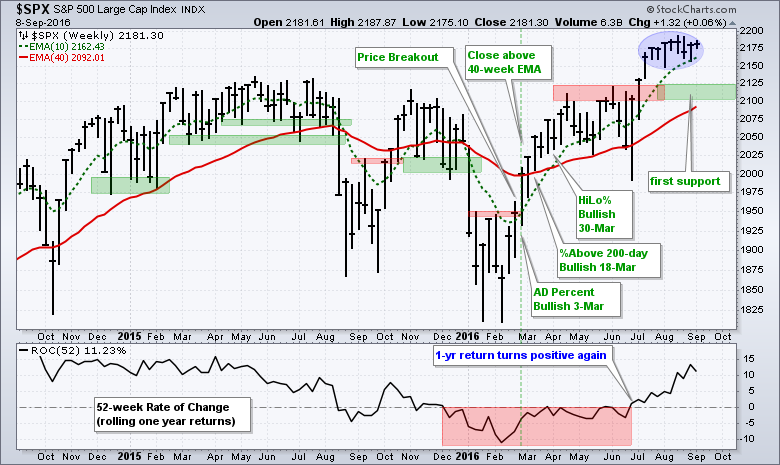
The S&P 500 broke above a big resistance zone with the July surge and this breakout should be considered bullish until proven otherwise. Classic technical analysis teaches us that broken resistance turns into the first support level and this is exactly what happened in September. Notice how the...
READ MORE
MEMBERS ONLY
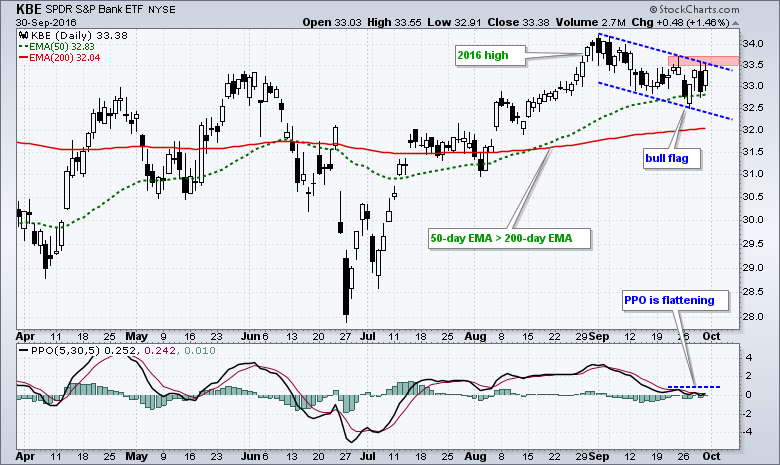
Bull Flags Take Shape in Bank SPDRs
by Arthur Hill,
Chief Technical Strategist, TrendInvestorPro.com
Deutsche Bank dominated the news late in the week, but US banks have been largely unaffected and bullish flags are taking shape in two bank-related ETFs. The charts below show the Bank SPDR (KBE) and the Regional Bank SPDR (KRE) in long-term uptrends. Notice that the 50-day EMAs are above...
READ MORE
MEMBERS ONLY
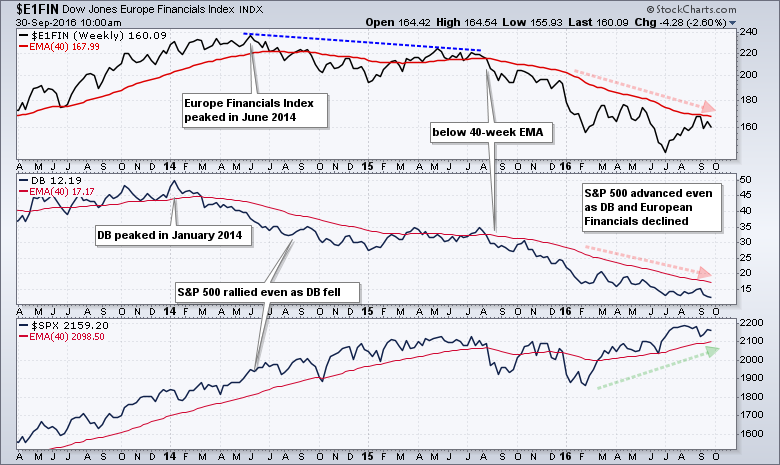
Are US Stocks Affected by European Financials - 5 Market Risk Ratios to Watch - A Selling Climax for DB? - Food for Thought
by Arthur Hill,
Chief Technical Strategist, TrendInvestorPro.com
Are US Stocks Affected by European Financials? .... Five Broad Market Risk Ratios .... Small-caps are Killing It .... Junk Bonds Show No Fear .... A Selling Climax for Deutsche Bank? .... Friday Food for Thought .... //// ....
Are US Stocks Affected by European Financials?
The Deutsche Bank woes are dominating the news right now and markets...
READ MORE
MEMBERS ONLY
Broad Market Stalls - Finance Props up IWM - Mining Stocks Lead Materials Sector - 12 Stocks to Watch
by Arthur Hill,
Chief Technical Strategist, TrendInvestorPro.com
Finance and Tech Power S&P 500 .... Broad Market Stalls .... QQQ and IWM Maintain Upward Drift .... XLI and XLB Bounce with Higher Lows .... XLE Holds Uptrend as XES Challenges Resistance .... Metals & Mining SPDR Extends Breakout .... Art's Charts ChartList Update .... //// ....
Finance and Tech Power S&P...
READ MORE
MEMBERS ONLY
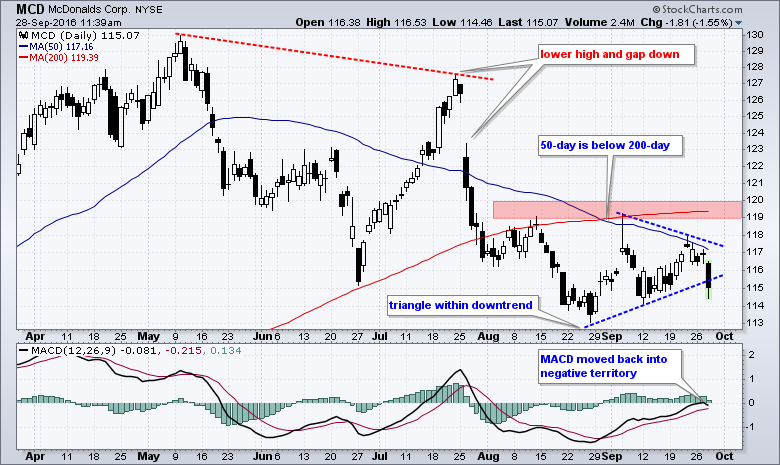
McDonalds Breaks Triangle Trend Line to Signal Trend Continuation
by Arthur Hill,
Chief Technical Strategist, TrendInvestorPro.com
McDonalds shareholders are certainly not "lovin it" right now because the stock is in a long-term downtrend and it is one of the worst performing stocks in the Dow Industrials. The chart below shows the 50-day SMA below the 200-day SMA and the stock below the 200-day SMA....
READ MORE
MEMBERS ONLY
Wedge Break Dominates Oil Chart - Big Triangle Keeps Copper in Check - Gold Extends Stall - 4 Charts to Watch
by Arthur Hill,
Chief Technical Strategist, TrendInvestorPro.com
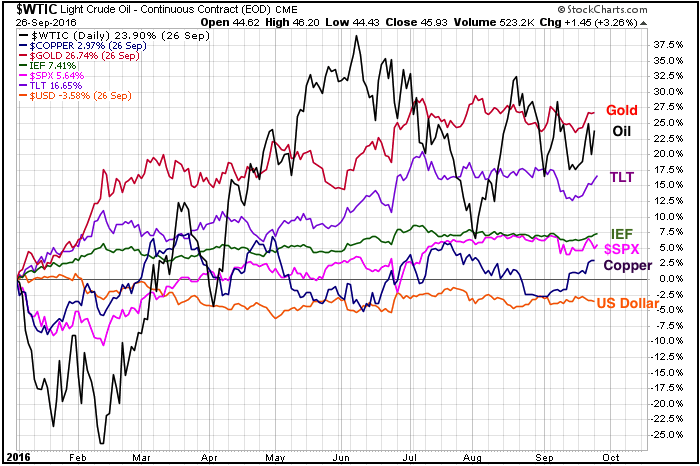
Year-to-date Performance for 3 Key Commodities .... Oil Remains Stuck in Downtrend .... Copper Consolidates with Downtrend .... Gold Stalls above Breakout Zone .... Charts to Watch - XLF, GOOGL, FDN and MSFT .... //// ....
Year-to-date Performance for 3 Key Commodities
The oil, gold and copper charts could give us some insight into Treasury yields, future...
READ MORE
MEMBERS ONLY
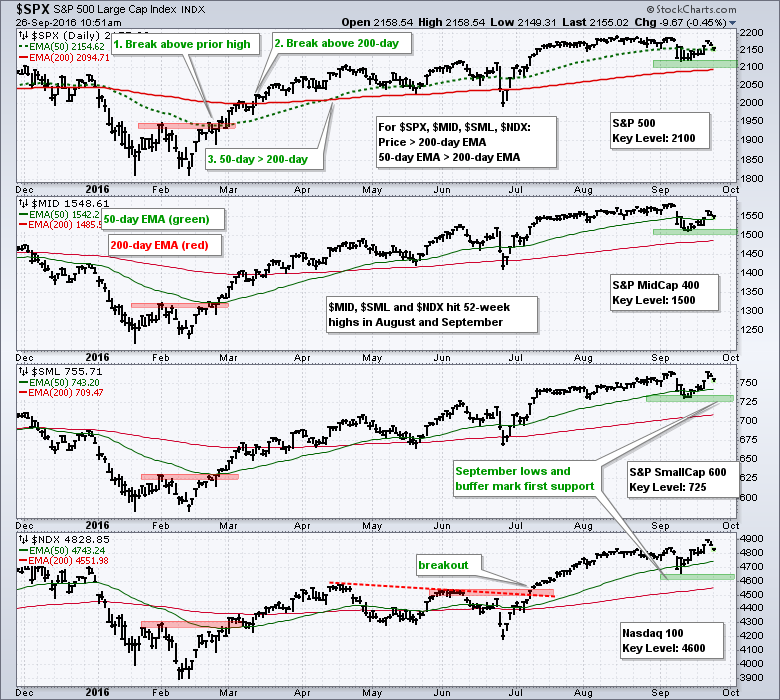
Setting Benchmark Lows for Major Indexes - Breadth for the 4 Offensive Sectors - 7 Charts to Watch
by Arthur Hill,
Chief Technical Strategist, TrendInvestorPro.com
Defining the Uptrends using Benchmark Lows .... Broad Market Breadth Review .... Watch the Stock-Bond Ratio for Clues on Risk Appetite .... %Above 200-day Triggers for Consumer Discretionary Sector .... Technology Sector Shows No Signs of Weakness .... Charts to Watch - XRT, ITB, XSD, KRE, XME, XES and IEF .... The Volatility Calendar .... //// ....
Defining the...
READ MORE
MEMBERS ONLY
Long-term Trend Overrides Short-term Weakness - QQQ Hits New High - KRE Extends Correction - Watching the Wedge in IEF
by Arthur Hill,
Chief Technical Strategist, TrendInvestorPro.com
Long-term Trend Overrides Short-term Weakness .... Percent above 200-day EMA Remains Strong .... SPY Follows Through on Inside Day Reversal .... QQQ Leads as IWM Challenges High .... Housing and Retail are Still Lagging .... Regional Banks Extend Correction .... Treasuries Surge within Corrective Patterns .... //// ....
Long-term Trend Overrides Short-term Weakness
Stocks fell sharply in early September...
READ MORE
MEMBERS ONLY
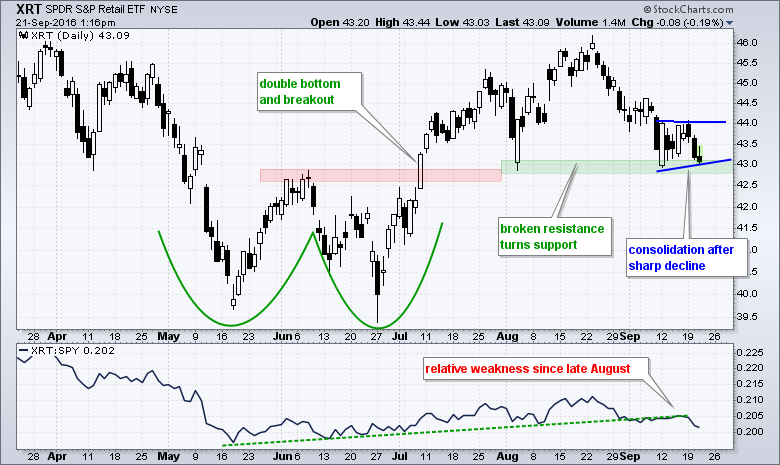
Retail SPDR Hits Moment-of-truth
by Arthur Hill,
Chief Technical Strategist, TrendInvestorPro.com
The Retail SPDR (XRT) is at its moment-of-truth with a long-term bullish pattern battling a short-term bearish pattern. Long-term, the ETF formed a double bottom and broke resistance with the July surge. This breakout zone turned into support with a successful test in early August. After a sharp decline from...
READ MORE
MEMBERS ONLY
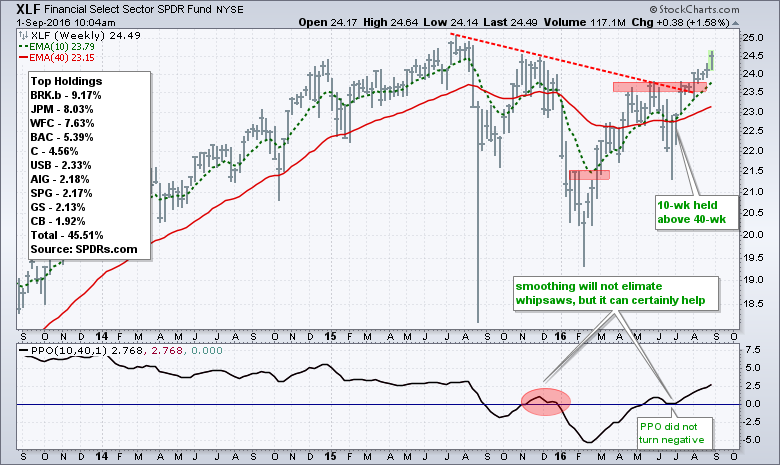
Financials iShares Bounces off Breakout
by Arthur Hill,
Chief Technical Strategist, TrendInvestorPro.com
Chartists looking to track the finance sector can turn to the iShares Financials ETF (IYF). Note that the Finance SPDR (XLF) is in the midst of a metamorphosis this week so chartists can consider watching IYF for clues on the finance sector this week. IYF is in a long-term uptrend...
READ MORE
MEMBERS ONLY
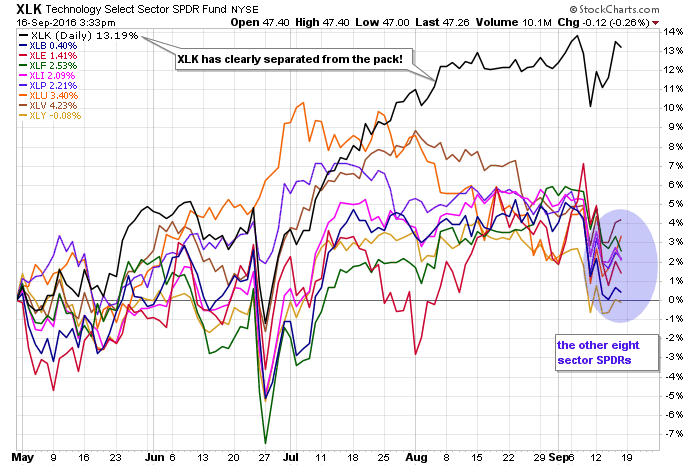
Tech Sector Breaks Away from the Pack
by Arthur Hill,
Chief Technical Strategist, TrendInvestorPro.com
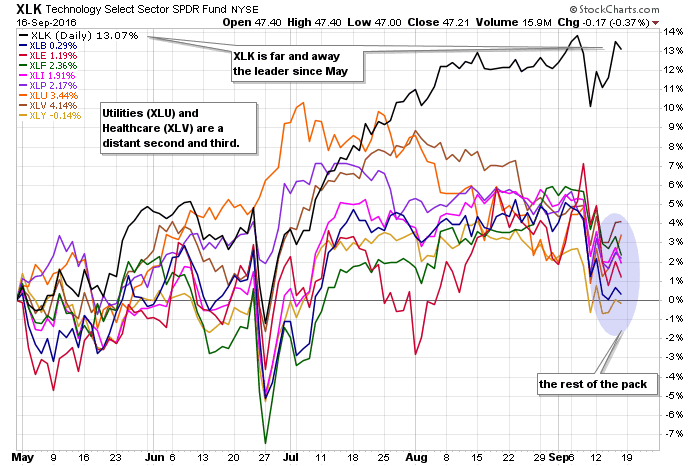
There is the tech sector, and then there is the rest of the stock market. It is not that bad, but the tech sector is clearly head and shoulders above the other sectors. This is true with the Technology SPDR (XLK) and the EW Technology ETF (RYT). The first SharpChart...
READ MORE
MEMBERS ONLY
Tech Leads and Establishes Key Watch Level - Cisco Turns Indecisive - Biotechs Perk Up - 3 Big Biotechs to Watch
by Arthur Hill,
Chief Technical Strategist, TrendInvestorPro.com
Technology ETFs Establish Key Levels to Watch .... Semis and Networking ETFs Follow Suit .... Cisco Forms a Pair of Inside Days .... A Big Counter-Trend Advance in XLE .... Crude Remains in Long-term Downtrend .... Biotech SPDR Holds its Breakout .... Three Big Biotechs to Watch .... //// ....
Technology ETFs Establish Key Levels to Watch
The technology...
READ MORE
MEMBERS ONLY
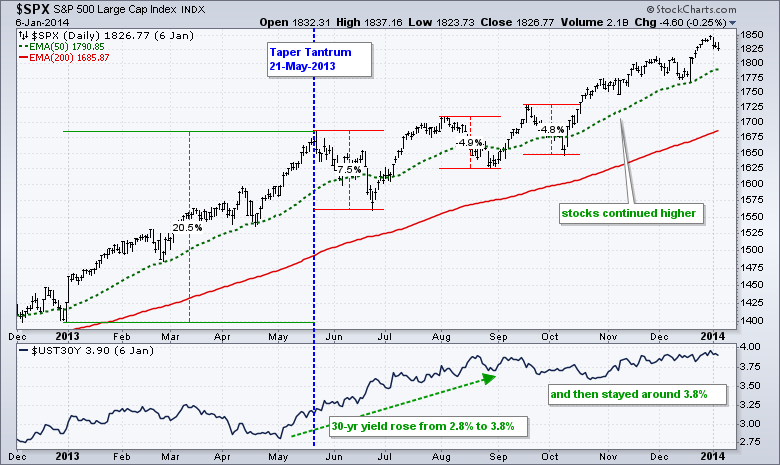
Putting the Pullback into Perspective - Revisiting the Taper Tantrum - XES and XLE Go Separate Ways - Radware Breaks Free
by Arthur Hill,
Chief Technical Strategist, TrendInvestorPro.com
Revisiting the 2013 Taper Tantrum .... Stocks Entitled to a Correction .... Oversold within an Uptrend .... Watching Inside Days in XLY and XLI .... XLE and XES Go their Separate Ways .... Exxon and Chevron Lead XLE Lower .... Radware Breaks Out as Icon Firms .... //// ....
Revisiting the 2013 Taper Tantrum
Many analysts are comparing the...
READ MORE
MEMBERS ONLY
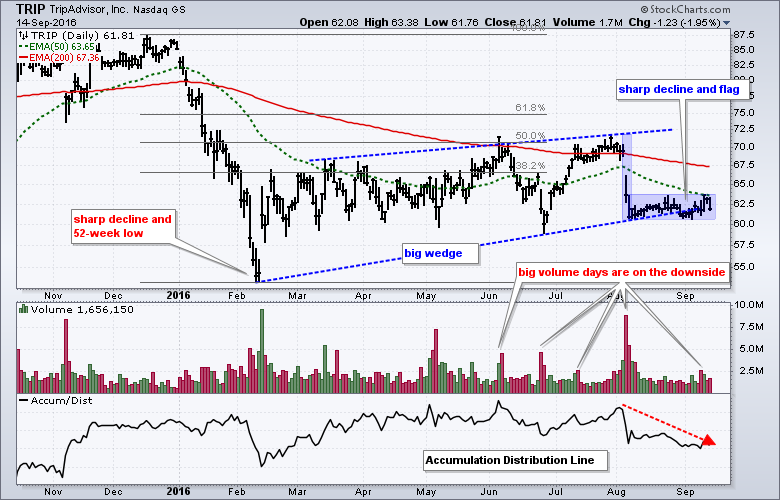
A Bad Chart Review for TripAdvisor
by Arthur Hill,
Chief Technical Strategist, TrendInvestorPro.com
The chart for TripAdvisor (TRIP) shows bearish patterns on two different timeframes and the stock looks poised for a breakdown. First, note that the long-term trend is down because the 50-day EMA is well below the 200-day EMA. Also notice that the stock hit a 52-week low with the sharp...
READ MORE
MEMBERS ONLY
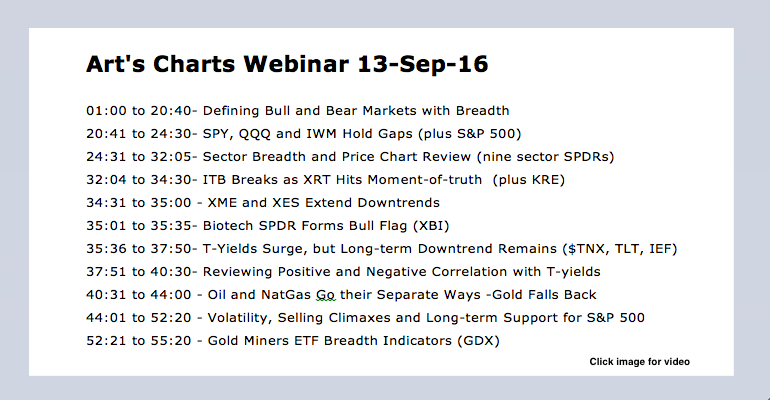
Defining Bull and Bear Market Environments with Breadth Indicators - Webinar Video
by Arthur Hill,
Chief Technical Strategist, TrendInvestorPro.com
Webinar Video (here) -- Art's Charts ChartList (here)
Gap and Volatility Hold .... Measuring Broad Market Breadth .... Using AD Percent for Early Warning .... New Highs Lag in S&P 500 .... Vast Majority of Stocks Still Trending Up .... Putting it All Together .... Discretionary and Staples Weigh on Sector Table...
READ MORE
MEMBERS ONLY
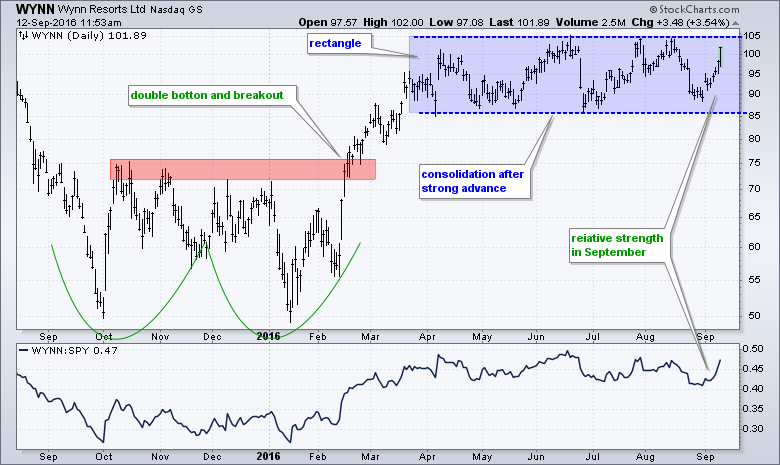
Wynn Resorts Bucks the Selling Pressure
by Arthur Hill,
Chief Technical Strategist, TrendInvestorPro.com
It is always interesting to find out which stocks advance when the market falls sharply, such as Friday. The S&P 500 was down over 2% with heavy selling pressure, but 11 stocks managed to buck the selling pressure and close higher on Friday. How's that for...
READ MORE
MEMBERS ONLY
Measuring Selling Climaxes - A Pullback or More? - 3 Items to Mark Next Support - Testing a Mean Reversion System
by Arthur Hill,
Chief Technical Strategist, TrendInvestorPro.com
Comparing the Current Decline with Prior Events .... Measuring Selling Climaxes .... Just a Pullback or More? .... Three Items Marking Next Support for the S&P 500 .... Putting EMA Crosses to the Test .... Mean Reversion Systems have Positive Expectancy .... //// ....
Comparing the Current Decline with Prior Events
The major index ETFs broke...
READ MORE
MEMBERS ONLY
Marking Pullback Support for S&P 500 - Apple Diverges from Fab Five - XLY Shows Internal Weakness - Friday Food for Thought
by Arthur Hill,
Chief Technical Strategist, TrendInvestorPro.com
Marking Pullback Support for the S&P 500 .... QQQ Stalls as Apple Lags the Fab Five .... Apple Falls on High Volume .... Alphabet and Microsoft Hold above Breakouts .... Amazon and Facebook are the Clear Leaders .... XLY Shows Internal Weakness .... Five Consumer Discretionary Stocks Showing Weakness .... Friday Food for Thought .... //// ....
Marking...
READ MORE
MEMBERS ONLY
A Stealth Correction - An Impressive New High Parade - XBI vs IBB - XOP vs XES - ChartList Update
by Arthur Hill,
Chief Technical Strategist, TrendInvestorPro.com
A Stealth Correction ... Stocks to Watch on the Art's Charts ChartList ... An Impressive Parade of New Highs ... XBI Successfully Tests Breakout ... XOP is Outperforming XES ... Volatility Calendar ... //// ...
A Stealth Correction
A stock or ETF can correct with a pullback, a trading range or a combination of the two....
READ MORE
MEMBERS ONLY
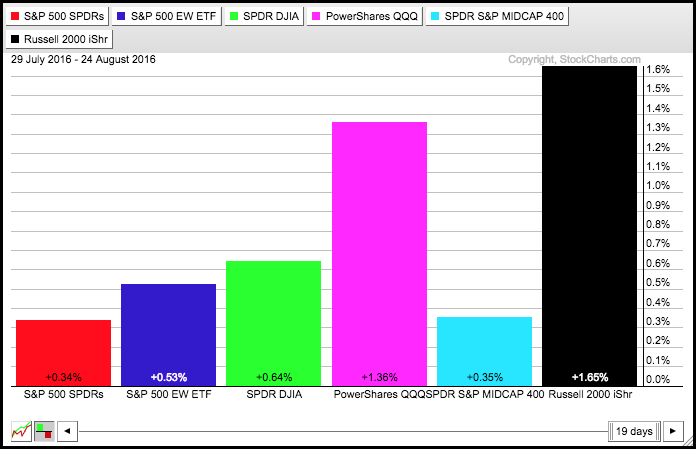
2016 is becoming the Year of Small Caps
by Arthur Hill,
Chief Technical Strategist, TrendInvestorPro.com
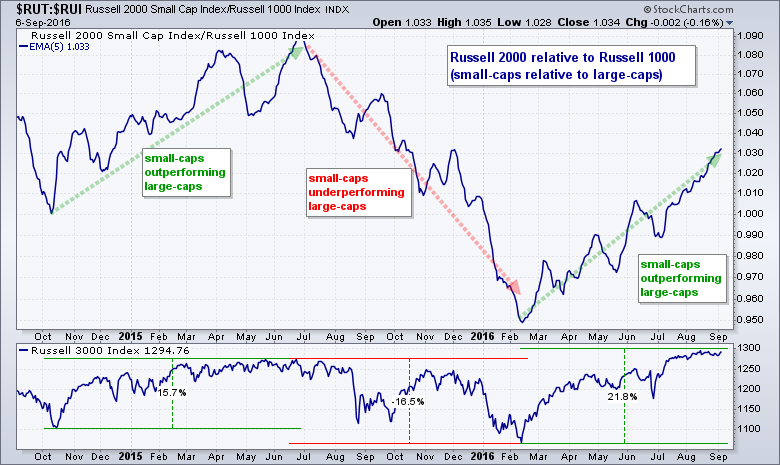
The year started weak for small-caps, but their fortunes quickly turned around in February and this group is now leading the market. The chart below shows the Russell 2000 relative to the Russell 1000 using the price relative ($RUT:$RUI ratio). The Russell 2000 represents the 2000 smallest stocks in...
READ MORE
MEMBERS ONLY
Small and Micros Lead - The Volatility Calendar - Charting the Ultra VIX ETN - Webinar Video
by Arthur Hill,
Chief Technical Strategist, TrendInvestorPro.com
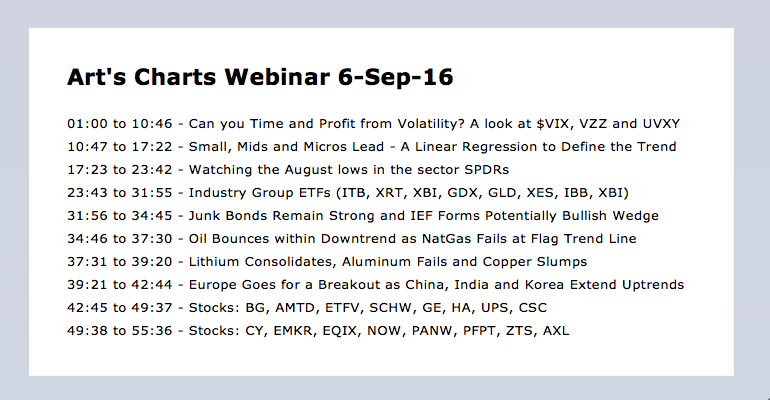
Click here for Webinar recording .... Linear Regression Defines the Trend .... Small, Mid and Micro Lead the Charge .... IWM Works its Way Higher .... The Volatility Calendar .... Is it Possible to Profit from Volatility? .... Webinar Preview .... //// ...
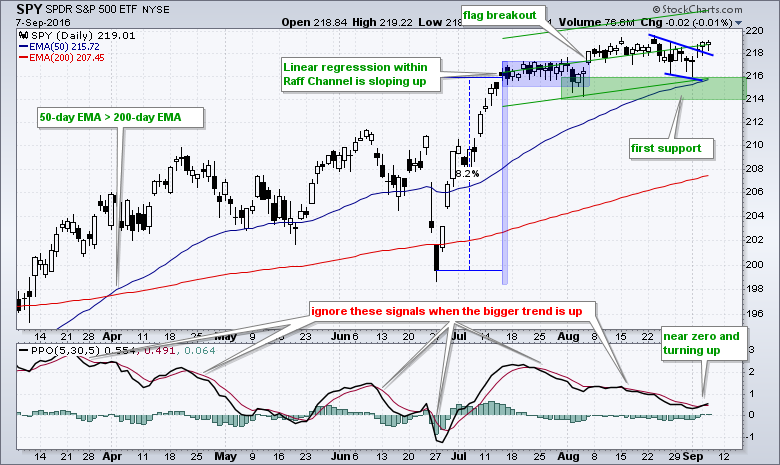
Linear Regression Defines the Trend
The S&P 500 SPDR (SPY) remains with a slow...
READ MORE
MEMBERS ONLY
Intel Leads Semis with a 52-week High
by Arthur Hill,
Chief Technical Strategist, TrendInvestorPro.com
Semiconductors are leading the charge in tech stocks as the Semiconductor SPDR (XSD) extends its gains and notches another 52-week high this week. Note that the ETF is up around 15% the last three months and it is one of the top performing industry group ETFs. The Semiconductor iShares (SOXX)...
READ MORE
MEMBERS ONLY
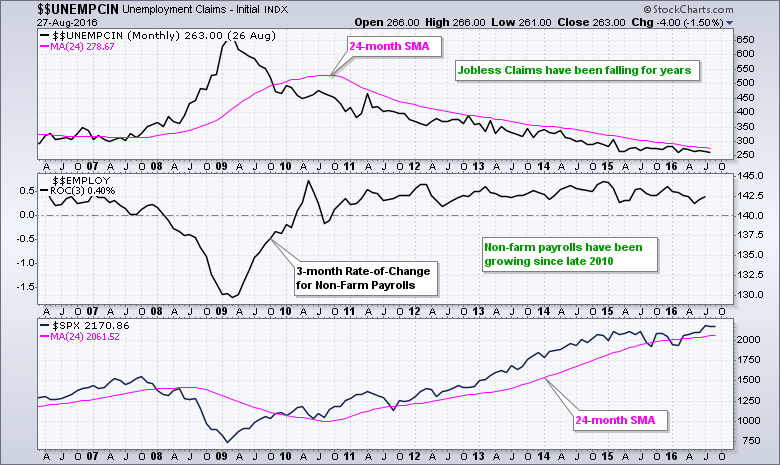
Taking Emotion Out of the Jobs Report - Weekly SPY Chart Remains Strong - Breadth Indicators Soften
by Arthur Hill,
Chief Technical Strategist, TrendInvestorPro.com
Taking the Emotion out of Jobless Claims and Non-Farm Payrolls .... No Issues with Weekly SPY Chart .... Backtest Review for Key EMA Crossover .... ChartCon Strategy Preview .... QQQ Stalls with Very Tight Range .... Small-caps and Large-caps Continue to Outperform .... AD Percent Stalls along with Indexes .... New Highs Wane, but New Lows Remain...
READ MORE
MEMBERS ONLY
Treasury Yields are Driving REITs and Banks in Opposite Directions - A Look at the Finance SPDR Split
by Arthur Hill,
Chief Technical Strategist, TrendInvestorPro.com
REITs and Banks go their Separate Ways // Financial Services Starts to Outperform // Real Estate Starts to Underperform // Notes on XLRE and XLFS // REITs are Negatively Correlated to Treasury Yields // Banks are Positively Correlated to Yields //// .....
REITs and Banks go their Separate Ways
Standard and Poor's is removing REITs...
READ MORE
MEMBERS ONLY
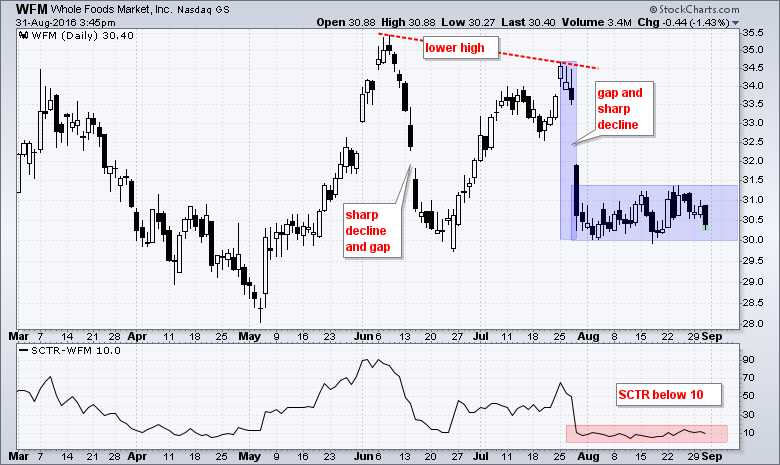
Second Shoe Looks Poised to Drop for Whole Foods
by Arthur Hill,
Chief Technical Strategist, TrendInvestorPro.com
It has been a rough summer for Whole Foods Market (WFM) as the stock plunged in June and late July. Both declines were sharp and featured big gaps. The stock did bounce between the two declines, but formed a lower high in late July. Most recently, WFM has been consolidating...
READ MORE
MEMBERS ONLY
Slow and Steady Winning the Race - Small-caps and Offensive Sectors Leading - 30-yr Yield Balks - Webinar Video
by Arthur Hill,
Chief Technical Strategist, TrendInvestorPro.com
Webinar Recording ---- Webinar ChartList
SPY and MDY are Barely Positive this Month // RSI(5) and the Dreaded Double Dip // The Noose Continues to Tighten for Treasuries // How Yields Effect Gold, Utilities and Finance // US 10-yr Yields Sticks Out // XLF and KRE Maintain Breakouts // XLU and IYR Forge Bullish Setups...
READ MORE
MEMBERS ONLY
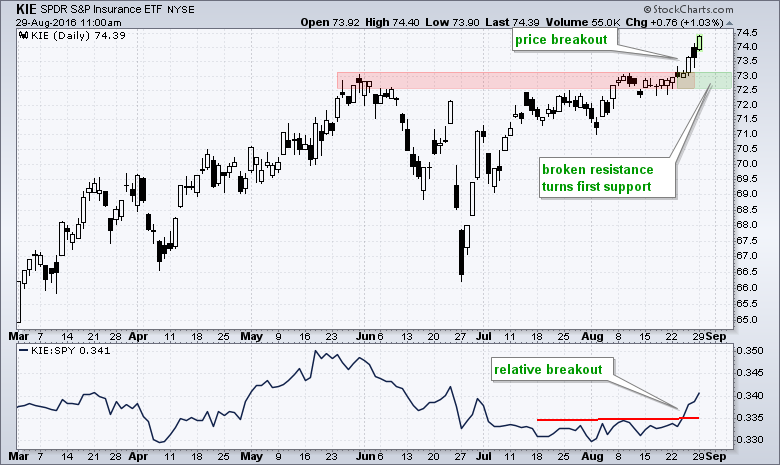
Insurance SPDR Leads Finance Related ETFs
by Arthur Hill,
Chief Technical Strategist, TrendInvestorPro.com
Stocks in the finance sector have been strong the last four days with the Insurance SPDR (KIE) showing chart leadership. Note that the Finance SPDR (XLF), Broker-Dealer iShares (IAI) and Regional Bank SPDR (KRE) are all up over the past week, but KIE is the only one trading at a...
READ MORE
MEMBERS ONLY
RSI and the Dreaded Double Dip - Gold, Utilities and Banks Key Off Treasuries - XLF and KRE Hold Breakouts
by Arthur Hill,
Chief Technical Strategist, TrendInvestorPro.com
SPY and MDY are Barely Positive this Month // RSI(5) and the Dreaded Double Dip // The Noose Continues to Tighten for Treasuries // How Yields Effect Gold, Utilities and Finance // US 10-yr Yields Sticks Out // XLF and KRE Maintain Breakouts // XLU and IYR Forge Bullish Setups // Gold Breaks, but Becomes Oversold...
READ MORE
MEMBERS ONLY
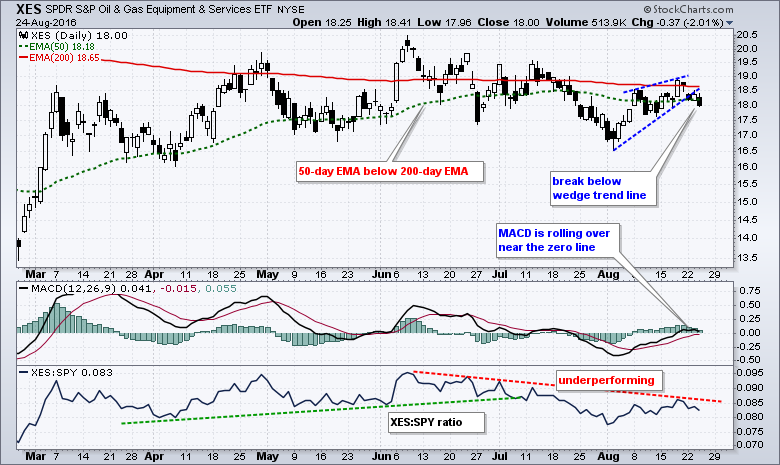
Oil & Gas Equip & Services SPDR Breaks Wedge and Underperforms
by Arthur Hill,
Chief Technical Strategist, TrendInvestorPro.com
The Oil & Gas Equip & Services SPDR (XES) looks vulnerable because the bigger trend is down and the ETF just broke a wedge trend line. The chart shows the 50-day EMA (green) below the 200-day EMA (red) and this suggests that a long-term downtrend remains underway. The ETF got...
READ MORE
MEMBERS ONLY
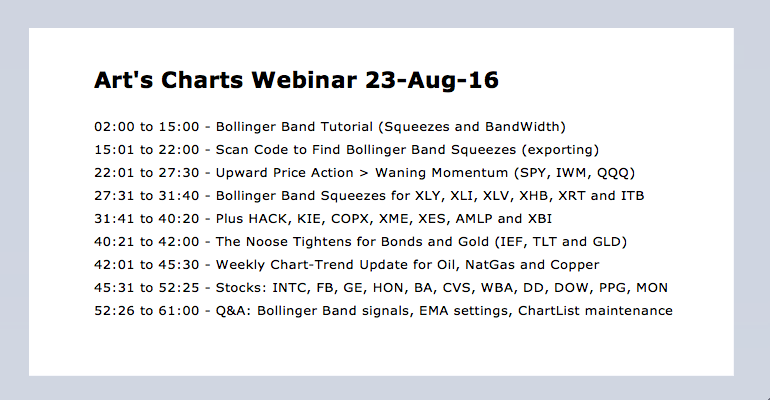
Price Action vs Momentum - All about Bollinger Band Squeezes (KRE, XLF, XSD) - Scanning for Squeezes - Webinar Video
by Arthur Hill,
Chief Technical Strategist, TrendInvestorPro.com
Click here for the webinar video recording
The Song Remains the Same for SPY // Upward Price Action > Waning Momentum // IWM Continues to Lead // Bollinger Band Squeezes for KRE and XLF // Beware of the Head Fake // Adding a Trend Condition // Scanning for Bollinger Band Squeezes // Webinar Preview //// .....
The Song Remains...
READ MORE
MEMBERS ONLY
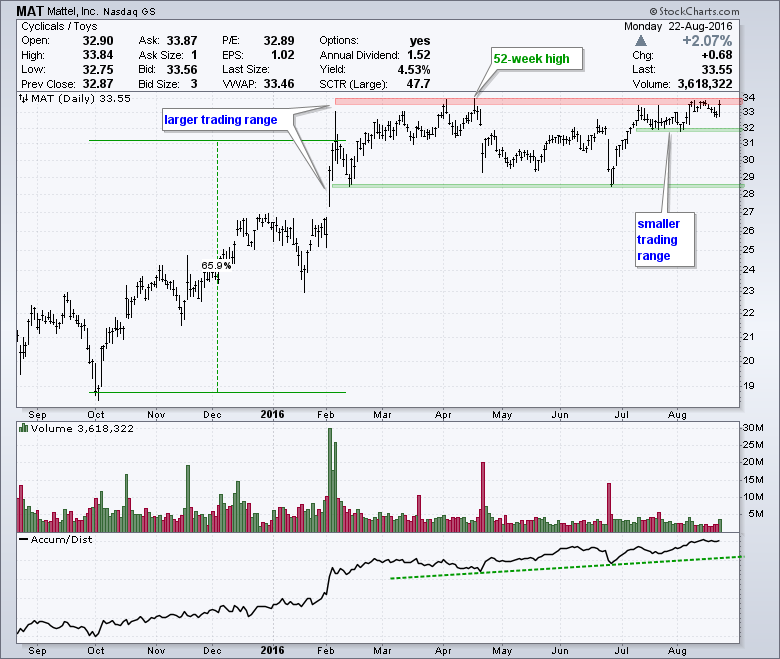
Mattel Challenges Resistance with Signs of Accumulation
by Arthur Hill,
Chief Technical Strategist, TrendInvestorPro.com
Mattel (MAT) led the market from early October to early February with a 65 percent advance and then moved into a large consolidation the last six months. More recently, the stock surged off support in late June and then formed a smaller consolidation near resistance. Notice that the stock advanced...
READ MORE
MEMBERS ONLY
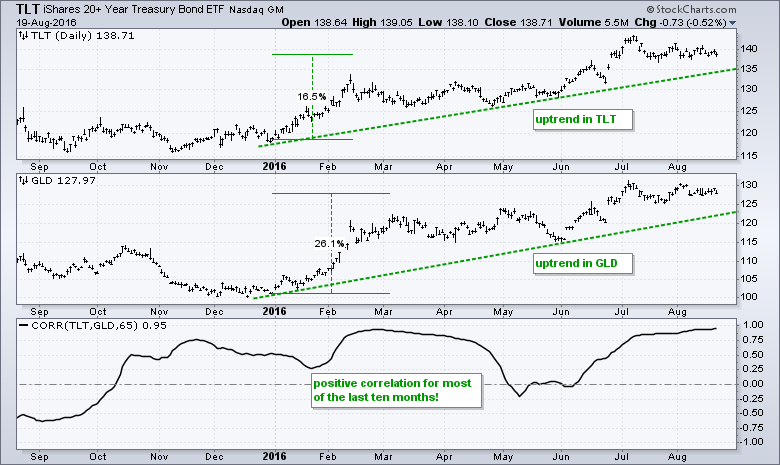
The Squeeze Play is on for the Gold and T-Bond ETFs
by Arthur Hill,
Chief Technical Strategist, TrendInvestorPro.com
The Gold SPDR (GLD) and the 20+ YR T-Bond ETF (TLT) are two of the best performing asset class ETFs this year and both remain in clear uptrends. GLD is up over 26% year-to-date and TLT is up around 16%. One would not expect bonds and gold to be leading...
READ MORE
MEMBERS ONLY
Bandwidth Hits Multi-year Low for S&P 500 - Bull Signal Remains Active for Band Squeeze on Russell 2000
by Arthur Hill,
Chief Technical Strategist, TrendInvestorPro.com
All Time Highs Set the Tone // Four Indecisive Weeks for the S&P 500 EW Index // Bandwidth Hits Lowest Level in over 10 Years // S&P 500 Clears Upper Band // Russell 2000 Remains on Bull Signal //// .....
All Time Highs Set the Tone
The major stock indexes have traded...
READ MORE