MEMBERS ONLY
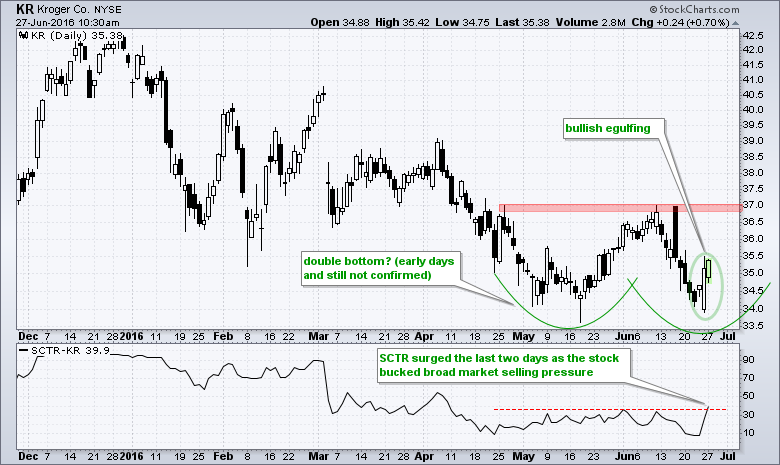
Kroger Follows Through on Engulfing Pattern
by Arthur Hill,
Chief Technical Strategist, TrendInvestorPro.com
Stocks were hit hard on Friday and again early Monday, but Kroger (KR) bucked the selling pressure with a bullish engulfing on Friday and further gains early Monday. Even though the overall trend for KR remains down, a double bottom could be forming as the stock gets its second bounce...
READ MORE
MEMBERS ONLY
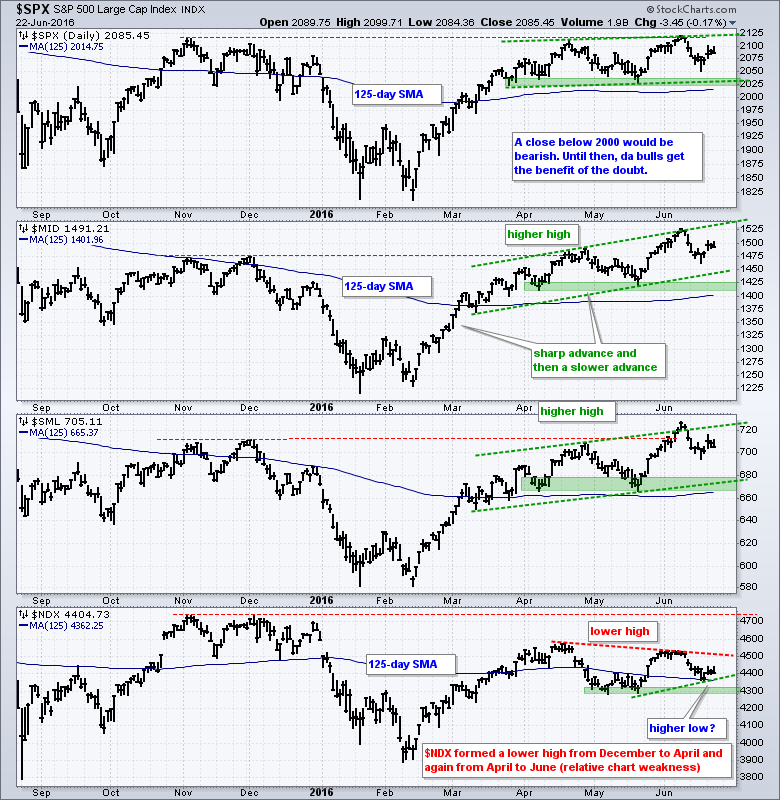
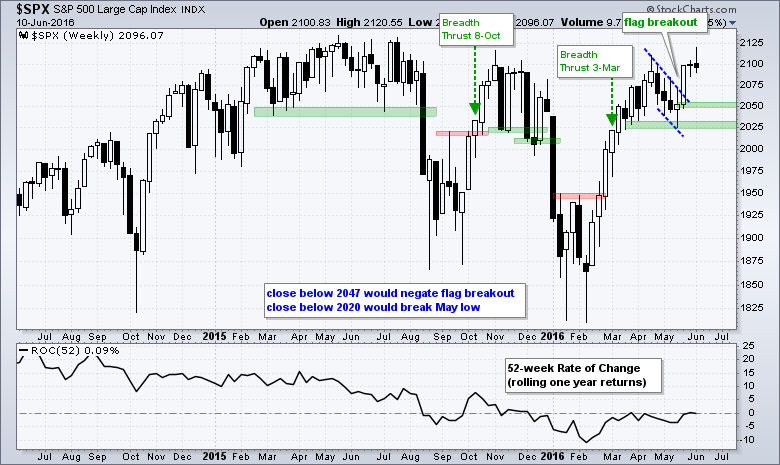
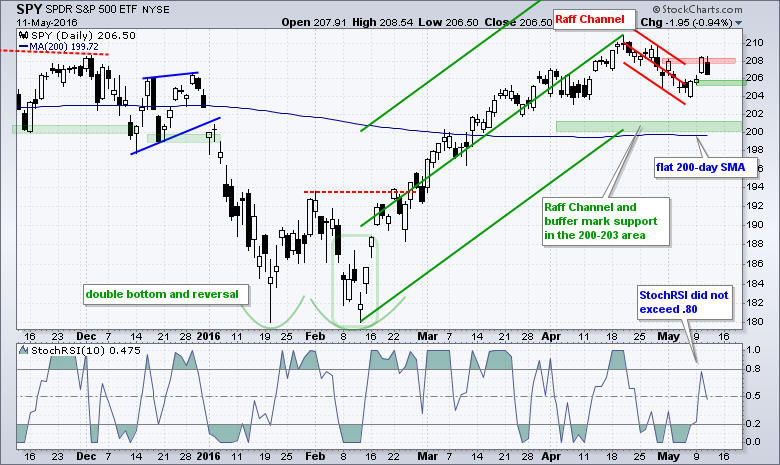
Flag Breakout Fails for $SPX - Breaking down the Breadth Indicators - Finance Sector and Nasdaq 100 Weaken Considerably
by Arthur Hill,
Chief Technical Strategist, TrendInvestorPro.com
Flag Breakout Fails for S&P 500 // AD Percent Remains on a Bull Signal // New Lows have yet to Expand // %Above 200-day Near Bearish Signal for Nasdaq 100 // Consumer Discretionary Remains the Weakest Sector // Finance Sector Weakens Considerably //// .....
Friday's sharp decline is just a blip on the...
READ MORE
MEMBERS ONLY
SystemTrader - Testing the PPO Strategy - Reducing Drawdowns with Trend Filters - Increasing Returns with a Dip
by Arthur Hill,
Chief Technical Strategist, TrendInvestorPro.com
.... Testing the PPO Strategy
.... Beware of Survivorship Bias
.... Setting the Ground Rules
.... Putting Three PPOs to the Test
.... Reducing Drawdowns with Trend Filters
.... Boosting Returns with a Pullback Rule
.... Backtesting the Trend Filters and the Dip
.... Testing the Original PPO Strategy
.... Final Thoughts .....
Testing the PPO Strategy
Today I will...
READ MORE
MEMBERS ONLY
S&P 500 Set for Key Support Test - French and German Stocks Fare Worse than UK Stocks - Smoothing Volatility
by Arthur Hill,
Chief Technical Strategist, TrendInvestorPro.com
Keep Calm and Carry On // S&P 500 Set for Key Support Test // FTSE Gets Turned Inside Out with Volatility // Smoothing out the Volatility // French and German Markets Bear the Brunt //// .....
Keep Calm and Carry On
The markets are reacting violently to the Brexit vote and one could even...
READ MORE
MEMBERS ONLY
Channels Still Rising - Bear Trap Springs in 10-yr Yield - What Does a High Volume Spinning Top Mean? - 5 Annotated Stock Charts to Watch
by Arthur Hill,
Chief Technical Strategist, TrendInvestorPro.com
Keep Your Eye on the Rising Channels // Small-caps and Mid-caps are Leading // Healthcare and Finance Not doing That Bad // 10-yr Yield Springs a Bear Trap // Rising Yields Could Lift Banks // What does a High Volume Spinning Top Suggest? // Five Annotated Stock Charts worth Watching //// ......
Keep Your Eye on the Rising...
READ MORE
MEMBERS ONLY
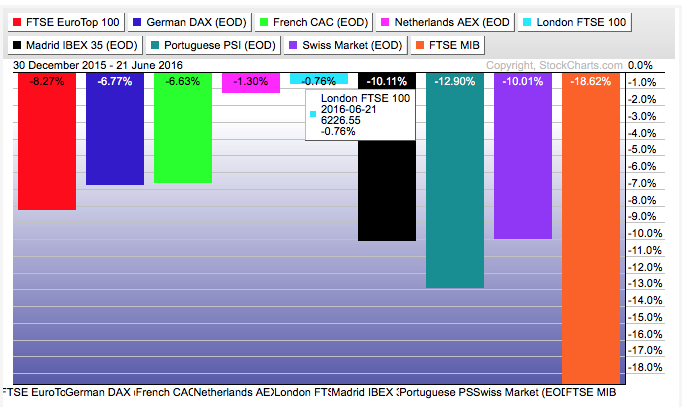
London FTSE is the Best Performing European Index in 2016
by Arthur Hill,
Chief Technical Strategist, TrendInvestorPro.com
The London FTSE is still down year-to-date, but it is the best performing index in Europe for 2016. The PerfChart below shows year-to-date performance for nine European stock indexes. The London FTSE is in the middle (light blue) and down less than 1% this year. In comparison, the Madrid IBEX...
READ MORE
MEMBERS ONLY
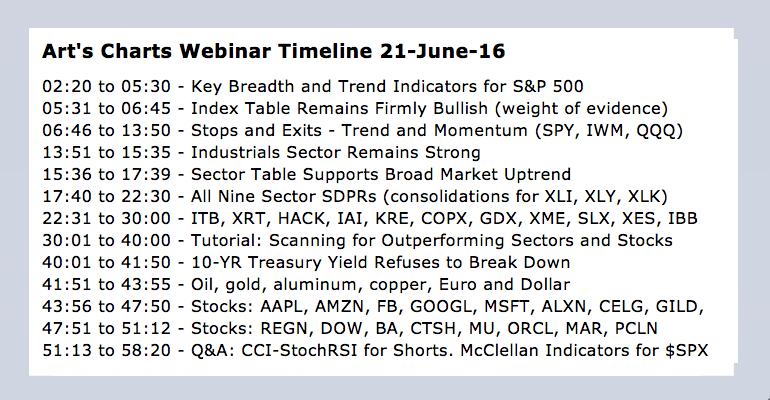
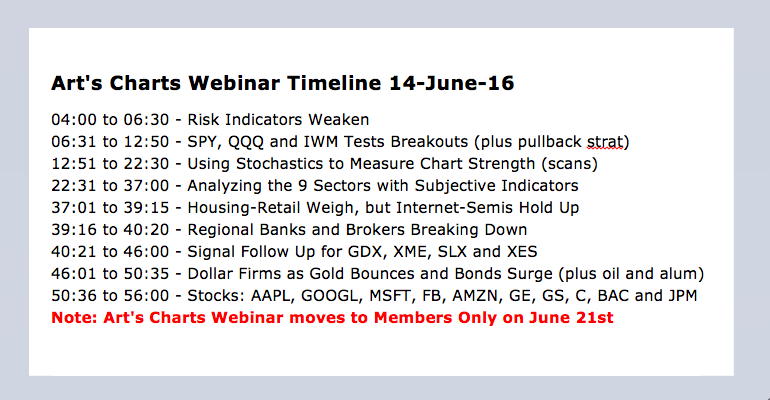
Stops and Exits - Advance Slows, but Doesn't Reverse - Sector Table Supports Bull Market - Webinar Video
by Arthur Hill,
Chief Technical Strategist, TrendInvestorPro.com
Thinking about Stops and Exits // Surge and Zigzag Advance // Small-caps Continue to Lead // Brexit, the FTSE and the Pound // Industrials Sector Remains Strong // Sector Table Supports Broad Market Uptrend // Index Table Remains Firmly Bullish // Webinar Preview // Scan Code for Outperformance //// .....
Thinking about Stops and Exits
Before getting into some broad...
READ MORE
MEMBERS ONLY
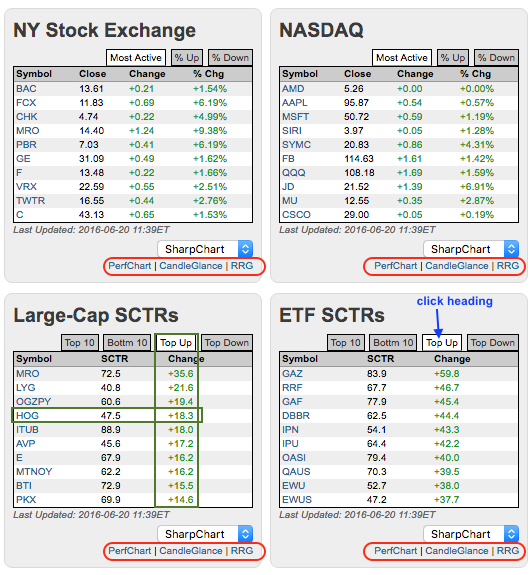
HOG Makes Big Relative and Absolute Moves
by Arthur Hill,
Chief Technical Strategist, TrendInvestorPro.com
Chartists looking for the movers and shakers of the day need look no further than the StockCharts home page. Tables for most actives and SCTRs can be found midway down on the left-hand side. These tables can be viewed by Top 10, Bottom 10, Top Up and Top Down (click...
READ MORE
MEMBERS ONLY
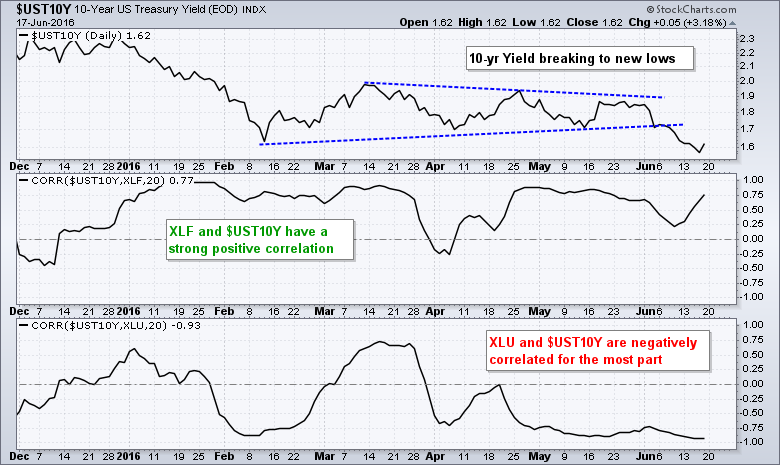
Finance and Utilities Part Ways as Rates Surge
by Arthur Hill,
Chief Technical Strategist, TrendInvestorPro.com
A sharp decline in Treasury yields is lifting the Utilities SPDR (XLU) and weighing on the Finance SPDR (XLF). First, let's look at the correlations to better understand the relationships. The chart shows the 10-yr Treasury yield in the top window and the Correlation Coefficients in the lower...
READ MORE
MEMBERS ONLY
SystemTrader - Testing Two Short-Term Moving Average Systems - Do Trend Filters Add Value?
by Arthur Hill,
Chief Technical Strategist, TrendInvestorPro.com
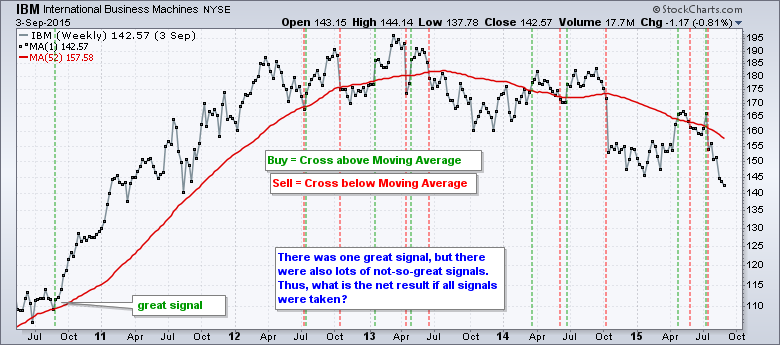
SystemTrader // Review of the Golden Cross Tests // Testing Short-term Moving Averages // A Basic 10-50 SMA Cross // Testing the Classic 13-34 EMA Cross // Does a Trend Filter Improve Results? // Final Thoughts //// ........
Last week I tested the golden cross for five major stock indexes and optimized these two moving averages to see...
READ MORE
MEMBERS ONLY
Using Vortex with SPY - Finance Weighs - Wild Ride in Tech ETFs - Aluminum ETF Surges to High of Year
by Arthur Hill,
Chief Technical Strategist, TrendInvestorPro.com
Finance Sector Weighs on Broader Market // Using Vortex Indicators with SPY // QQQ Lags with Lower High // A Choppy Advance for IWM // 5-yr Yield hits 2016 Low // Oil Falls within Rising Channel // New High, New Low and Back Again // Large-cap Techs Weigh on XLK // Aluminum Surges to High of the Year...
READ MORE
MEMBERS ONLY
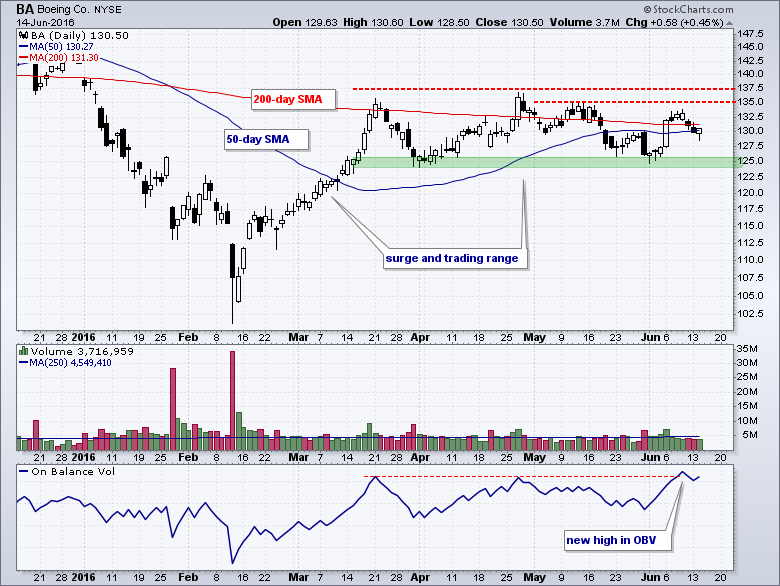
Key Moving Averages Converge as Boeing shows Signs of Accumulation
by Arthur Hill,
Chief Technical Strategist, TrendInvestorPro.com
Boeing has been stuck in a trading range since late March and signs of accumulation suggest an upside breakout. On the price chart, notice that BA surged from the 102 area to 135 from mid February to mid March. The stock was certainly entitled to a consolidation after a 30+...
READ MORE
MEMBERS ONLY
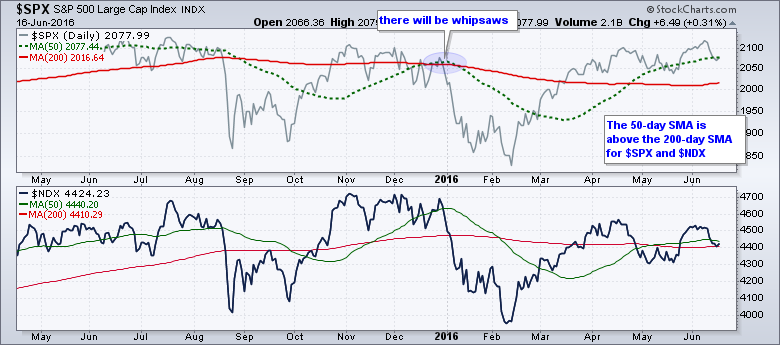
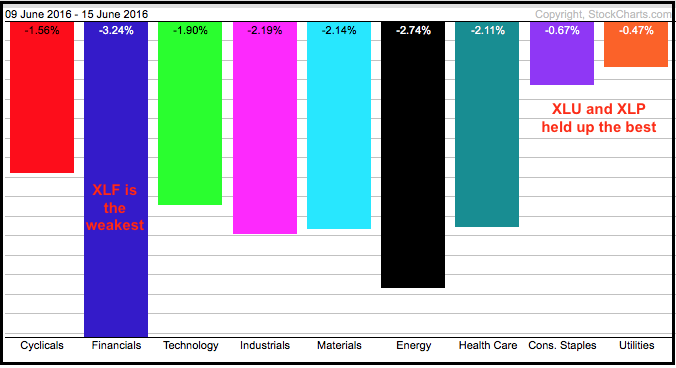
Weight of the Evidence Says? - Ranking the 9 Sectors - Using Stochastics to Evaluate Price Action
by Arthur Hill,
Chief Technical Strategist, TrendInvestorPro.com
A Weight of the Evidence Approach // Consumer Discretionary Remains the Weakest Link // Finance Sector Struggles // Technology Does the Splits // Staples and Utilities Lead with New Highs // Ranking the Nine Sectors // Evaluating Price Action with the Stochastic Oscillator // Webinar Preview //// .....
A Weight of the Evidence Approach
I will break down the...
READ MORE
MEMBERS ONLY
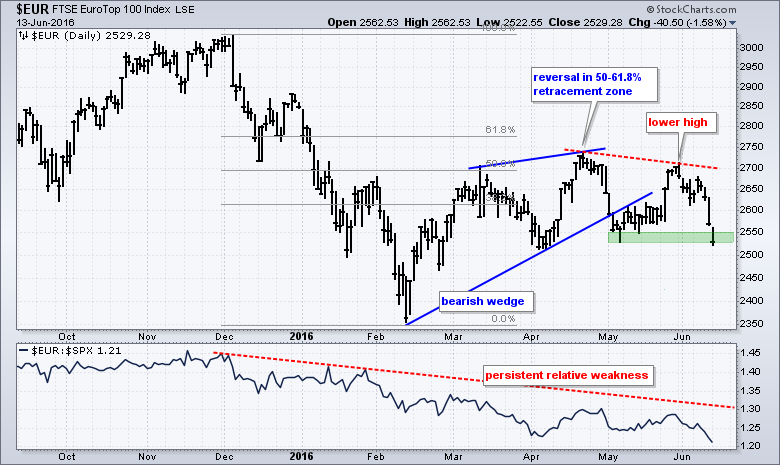
Eurotop 100 Breaks Key Levels and Leads Lower
by Arthur Hill,
Chief Technical Strategist, TrendInvestorPro.com
Large-caps in Europe continue to underperform large-caps in the US and the EuroTop 100 ($EUR) is breaking down on the price chart. First, the price chart shows $EUR falling sharply from December to mid February and then recovering 50-61.8% of this decline with a bounce back to the 2700-2750...
READ MORE
MEMBERS ONLY
Perspective on Failed Rally - New Highs Expand, but Breadth Takes a Hit - T-Yield Plunge Shakes the Markets
by Arthur Hill,
Chief Technical Strategist, TrendInvestorPro.com
Perspective on Last Week's Failed Rally // Lower High Takes Shape for Nasdaq 100 // Russell 2000 Earned the Right to Correct // Broad Selling hits key Breadth Indicator // New Highs Actually Expanded Last Week // Plunge in Yields Shakes up the Markets // .....
Perspective on Last Week's Failed Rally
Stocks...
READ MORE
MEMBERS ONLY
SystemTrader - Testing the Golden Cross with the Nasdaq 100 and Russell 2000 - Do Short Positions Add Value?
by Arthur Hill,
Chief Technical Strategist, TrendInvestorPro.com
SystemTrader - Tweaking the Golden Cross // Testing Other Indexes // Testing the Golden Cross with Short Positions // Testing with Exponential Moving Averages // The Pitfalls of Optimization // Optimizing the Long-term Moving Average Cross // The Russell 2000 is a Different Beast // Final Thoughts //// ........
Last week I tested a trading system using the golden...
READ MORE
MEMBERS ONLY
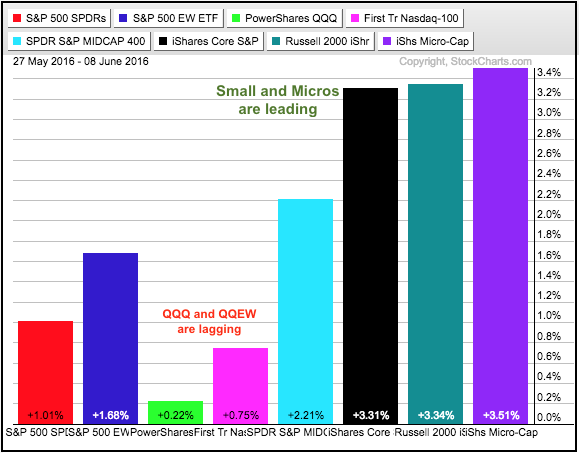
Big Techs Weigh on QQQ - MSFT, GOOGL and APPL Hit Gap Zones - Small Cap New Highs Surge - 8 Stocks to Watch
by Arthur Hill,
Chief Technical Strategist, TrendInvestorPro.com
Small and Micros Continue to Lead // Big Techs Weigh on QQQ // QQQ Extends Stall // SPY Hits a New High // IWM Leaves the others in the Dust // 4 of 5 Small-cap Sector ETFs Hit New Highs // Most New Highs since June // Stocks of Interest: TJX, FCX, GS, CVS, DIS, F, ADP,...
READ MORE
MEMBERS ONLY
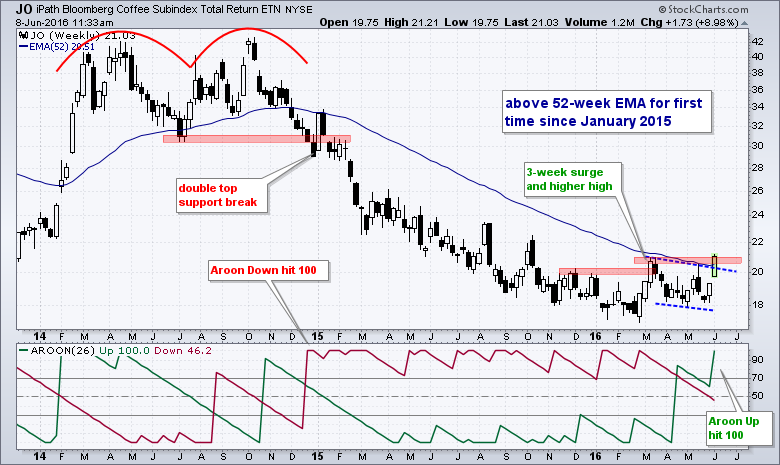
JO Makes a Big Jump
by Arthur Hill,
Chief Technical Strategist, TrendInvestorPro.com
The Coffee ETF (JO) is one of leading commodity ETFs this week with an 8+ percent gain in just three days. The chart shows JO trending lower from the October 2014 peak until the February 2014 trough. JO then surged with a sharp three week advance that exceeded 20 and...
READ MORE
MEMBERS ONLY
Healthcare and Industrials Lead New High List - Managing a Long Trade - Webinar Video
by Arthur Hill,
Chief Technical Strategist, TrendInvestorPro.com
Midcaps Lead %Above 200-day EMA // High-Low Lines Continue to Rise // Healthcare and Industrials Lead New High List // Sectors Reflect Broad Market Strength // XLE and XLB Extend Breakouts // Metals & Mining and Oil & Gas Equip & Services SPDRs Extend Signals // Webinar Preview //// ....
Midcaps Lead %Above 200-day EMA
Stock market breadth...
READ MORE
MEMBERS ONLY
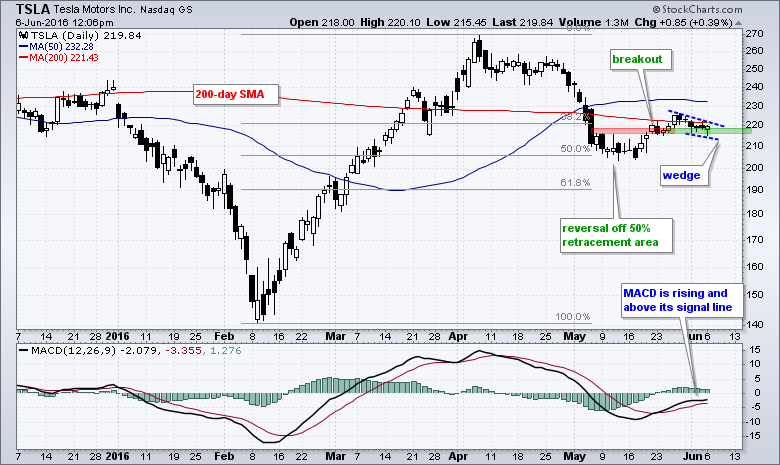
Tesla Battles Key Moving Average as Momentum Improves
by Arthur Hill,
Chief Technical Strategist, TrendInvestorPro.com
Tesla was hit hard in early May, but the stock managed to reverse near the 50% retracement and a bullish wedge is taking shape near the 200-day simple moving average. The stock surged from 140 to 270 from mid February to early April. This was a 90% advance in less...
READ MORE
MEMBERS ONLY
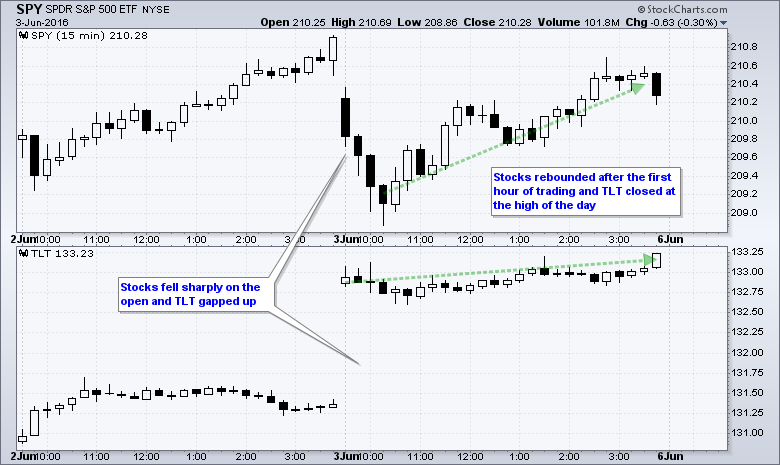
Stocks Bounce after Weak Open - Small and Mid Caps Lead - XLI and XLE in the Spotlight
by Arthur Hill,
Chief Technical Strategist, TrendInvestorPro.com
Stocks Bounce after Weak Open // SPY Remains In Trend // IWM Continues to Lead // XLE and XLI are in the Spotlight //// ....
Stocks Bounce after Weak Open
By now we are all aware of the big miss in the employment report. This miss triggered strong buying pressure in Treasury bonds and Treasury...
READ MORE
MEMBERS ONLY
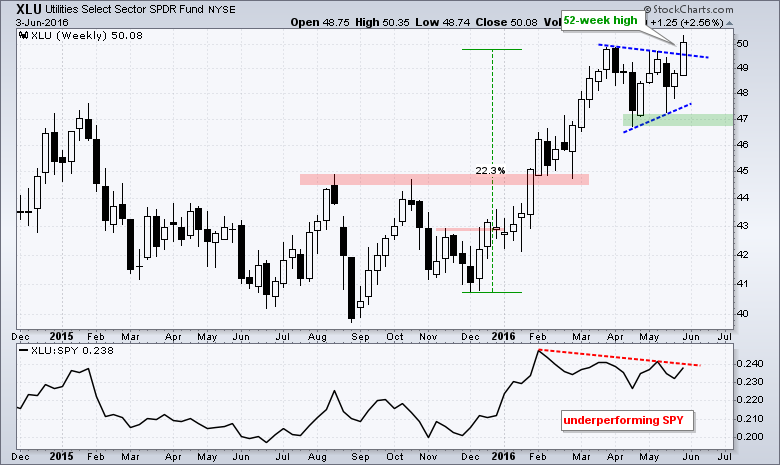
Employment Miss Triggers Breakout in the Utilities SPDR
by Arthur Hill,
Chief Technical Strategist, TrendInvestorPro.com
Even though the Utilities SPDR (XLU) has been underperforming SPY since February, it sports the strongest chart of the nine sector SPDRs. How can that be? XLU is the only sector to hit a 52-week high this week. The sector cannot be that weak when it is trading at a...
READ MORE
MEMBERS ONLY
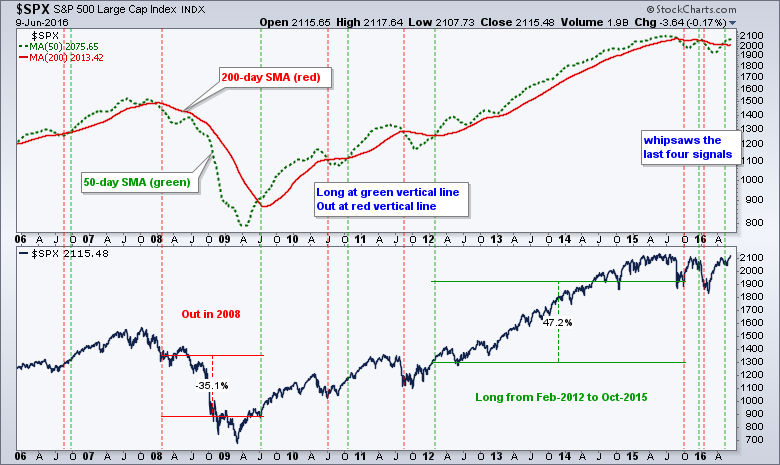
SystemTrader - Crossing to the Dark Side - Key Performance Metrics - Quantifying the Golden Cross for the S&P 500
by Arthur Hill,
Chief Technical Strategist, TrendInvestorPro.com
SystemTrader // Crossing Over to the Dark Side! // Key Performance Metrics // Setting the Benchmark // Quantifying the Golden Cross // Risk-adjusted Returns versus Drawdowns // Winners versus Losers // Ratio Metrics // Backtesting Even Further
I have scrutinized charts for years, if not decades, and now I am making a step towards quantitative analysis. The Dark...
READ MORE
MEMBERS ONLY
IWM Leads the Big 3 - Techs Lead New High List - 10-yr Yield Winds Tight - 10 Stock Setups
by Arthur Hill,
Chief Technical Strategist, TrendInvestorPro.com
Small and Mid Caps Lead // SPY and QQQ Remain In Trend // IWM Leads with Higher High // Utes and Staples Lag, but don't Exactly Drag // Technology Leads New High List // HACK Challenges Prior Highs // 10-YR Treasury Yield Winds Tight // A Small Decline on High Volume // 10 Stocks with Bullish...
READ MORE
MEMBERS ONLY
Aroon Brothers Gear Up for a Signal in Oracle
by Arthur Hill,
Chief Technical Strategist, TrendInvestorPro.com
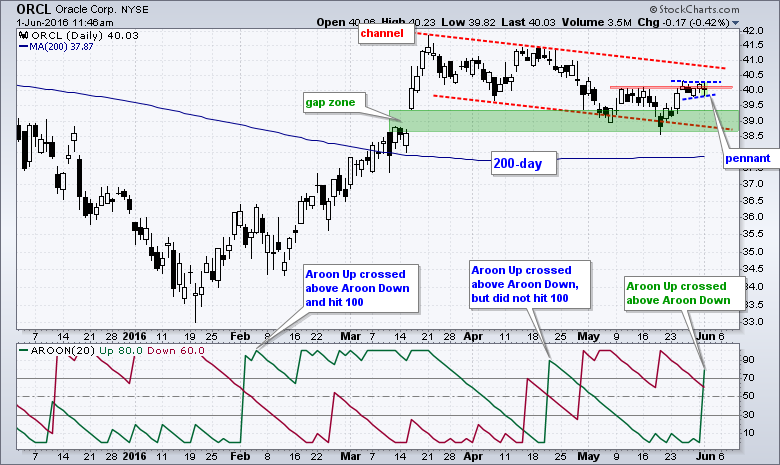
Oracle broke above its 200-day moving average back in early March and then pulled back over the last ten weeks. There are signs that this pullback is ending because Aroon Up just surged above Aroon Down. Developed by Tushar Chande, Aroon means "dawn's early light" in...
READ MORE
MEMBERS ONLY
Key AD Line Hits New High - The CCI-StochRSI Strategy - 5 Sectors Spring to Life - Webinar Recording
by Arthur Hill,
Chief Technical Strategist, TrendInvestorPro.com
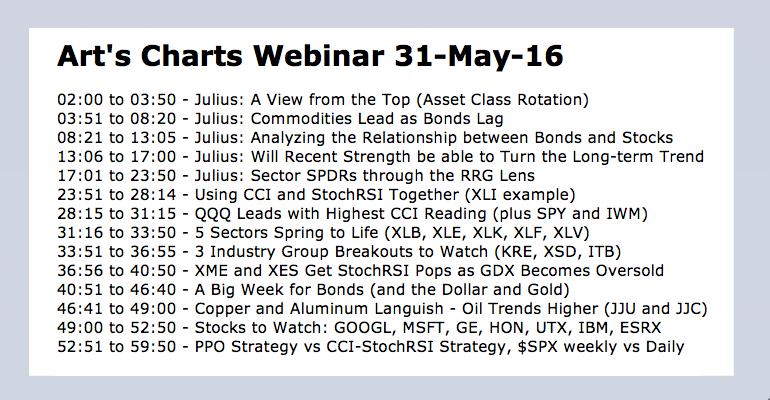
4 AD Lines Hitting New Highs // SPY Surges with Gaps // Using CCI and StochRSI Together (XLI example) // QQQ Leads with Highest CCI Reading // 5 Sectors Spring to Life // 3 Industry Group Breakouts to Watch // XME and GDX Become Short-term Oversold // Oil & Gas Equip & Services SPDR Holds Support Bounce...
READ MORE
MEMBERS ONLY
SPY Volatility Expansion is Bullish - Mid-caps Lead New High List - Sector Scorecard - Video
by Arthur Hill,
Chief Technical Strategist, TrendInvestorPro.com
SPY Volatility Expansion is Bullish // High-Low Lines Turn Back Up // Mid-caps Lead New High List // Sectors Reflect Broad Market Strength // Consumer Discretionary is the Only Weak Link // EW Technology ETF Challenges Highs // Staples and Utilities Stall within Uptrends // Friday Food For Thought //// ....
SPY Volatility Expansion is Bullish
Last Friday I...
READ MORE
MEMBERS ONLY
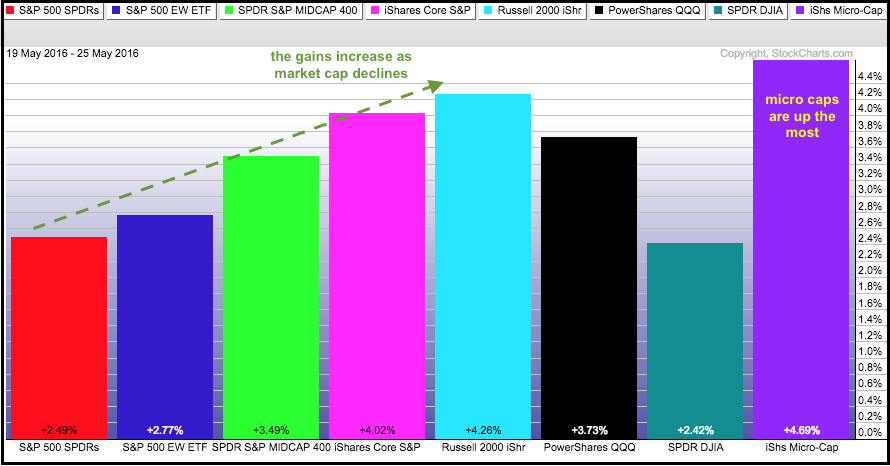
Small and Micros Lead the Way - Sector Performance Says Risk On - Gaps Fuel the Breakouts - 4 Pullback-Pop Candidates
by Arthur Hill,
Chief Technical Strategist, TrendInvestorPro.com
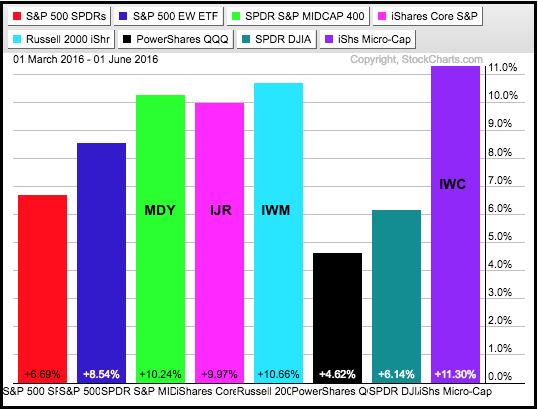
Small and Micros Lead the Way // Sector Performance Says Risk On // Gaps Fuel the Breakouts in QQQ, SPY and IWM // Materials and Finance Lead Sector SPDRs // Equal-weight Finance Leads with Higher High // Metals & Mining SPDR Gets Momentum Pop // Oil & Gas Equip & Services SPDR Surges off Support // Scanning...
READ MORE
MEMBERS ONLY
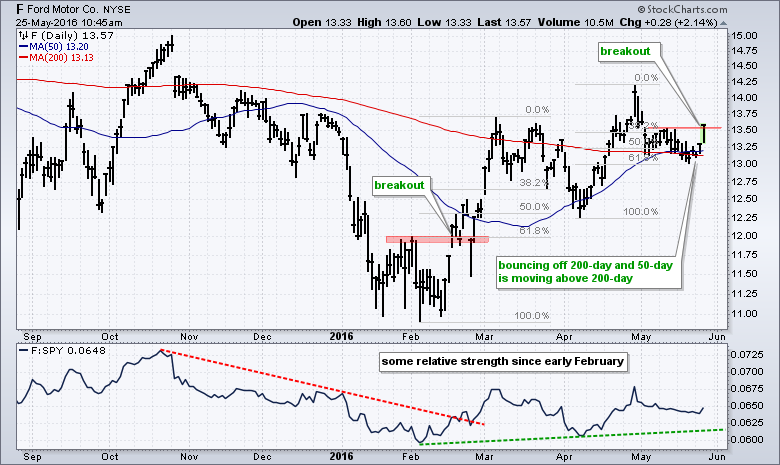
Two Steps Forward and One Step Backward for Ford
by Arthur Hill,
Chief Technical Strategist, TrendInvestorPro.com
Ford is making a big statement today with a successful test of the 200-day moving average and a break above the mid May high. The chart shows Ford (F) surging in February for its first breakout at 12. After exceeding 13.50, the stock retraced 50-62% with a pullback to...
READ MORE
MEMBERS ONLY
Small Gaps Could End Pullbacks - When to Pull the Trigger? - Scanning for Pullbacks within an Uptrend - Webinar Video
by Arthur Hill,
Chief Technical Strategist, TrendInvestorPro.com
ÂÂ
Small Gaps Could Signal End to Pullbacks // When to Pull the Trigger? // Money Moves out of Safe-haven Bonds // Finance Remains in the Spotlight // Regional Banks Take the Lead // Webinar Preview //// ...........
Small Gaps Could Signal End to Pullbacks
The short-term trends remain down, but I am seeing signs that these...
READ MORE
MEMBERS ONLY
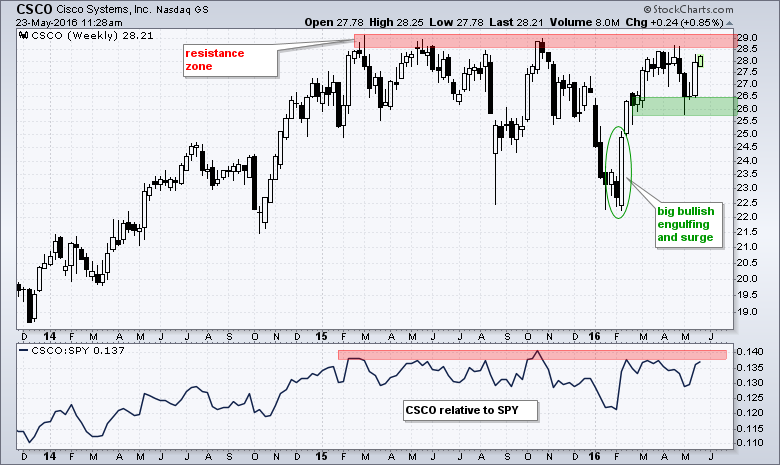
The Next Big Tech Stock to Watch for a New High
by Arthur Hill,
Chief Technical Strategist, TrendInvestorPro.com
Stocks hitting 52-week highs are in clear uptrends and they are the market leaders. I am not going to feature a stock hitting a new high today, but rather look at one that has a good chance of hitting a new high in the coming weeks. The weekly chart below...
READ MORE
MEMBERS ONLY
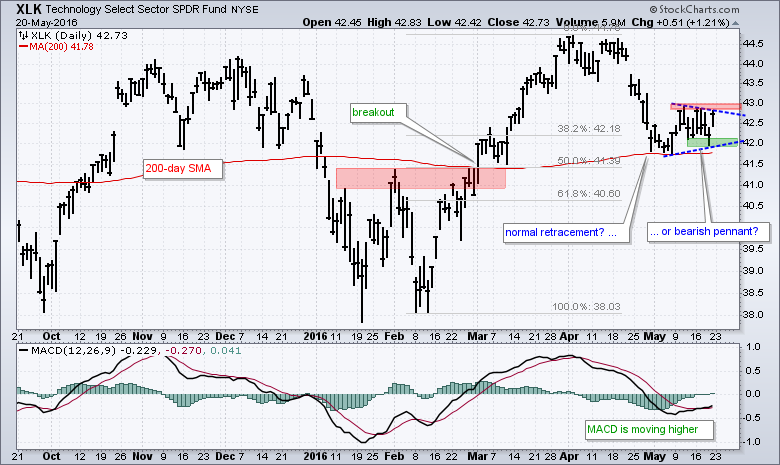
XLK Shows Signs of Life as Key Moving Average Holds
by Arthur Hill,
Chief Technical Strategist, TrendInvestorPro.com
It has been a wild ride for the Technology SPDR (XLK) since August, but the ETF is showing signs of strength by holding the 200-day moving average in May. The red line shows the 200-day SMA dissecting the chart in the 41.5-42 area. Note that XLK broke above this...
READ MORE
MEMBERS ONLY
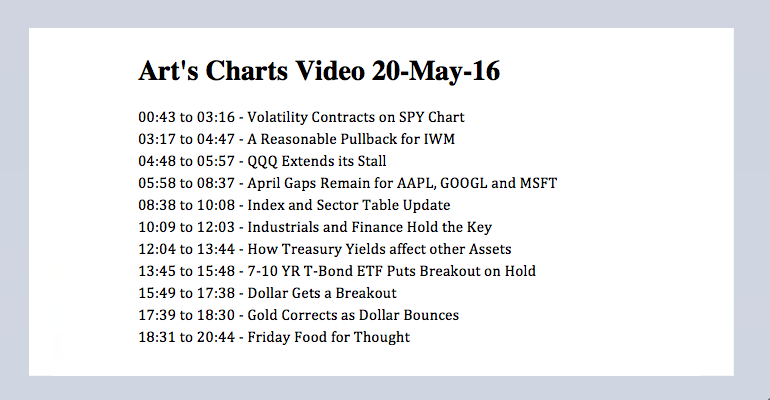
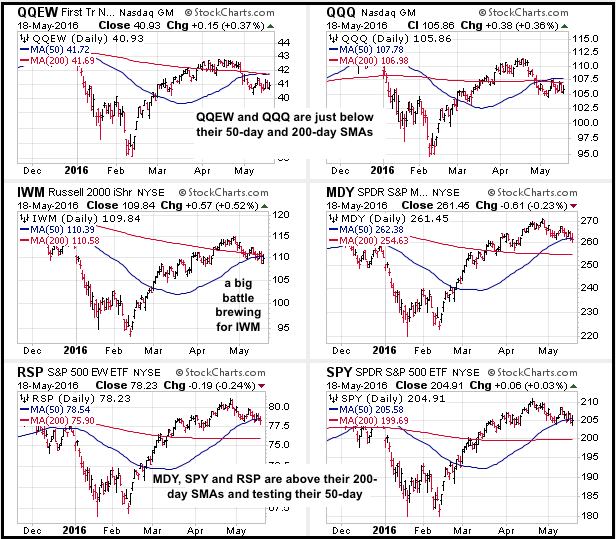
Volatility Contracts on Pullback - QQQ Stalls - Treasury Yields can Effect other Assets - Dollar Gets Breakout
by Arthur Hill,
Chief Technical Strategist, TrendInvestorPro.com
Volatility Contracts on SPY Chart // QQQ Extends its Stall // April Gaps Remain for AAPL, GOOGL and MSFT // A Reasonable Pullback for IWM // Index and Sector Table Update // Industrials and Finance Hold the Key // How Treasury Yields affect other Assets // 7-10 YR T-Bond ETF Puts Breakout on Hold // Dollar Gets a...
READ MORE
MEMBERS ONLY
Small-caps Gear up for Big Test - Using %B for Setups - Treasuries Signal Risk On
by Arthur Hill,
Chief Technical Strategist, TrendInvestorPro.com
Small-caps Gear Up for Big Test // Using %B to Identify Oversold Conditions // Indicators Overshoot for QQQ // IWM Remains with a Bullish Setup // Intraday or End-of-day Signals? // Treasuries Signal Risk On // XLF Surges as KRE and IAI Break Out //// ...........
Small-caps Gear Up for Big Test
Today I will show QQQ, SPY...
READ MORE
MEMBERS ONLY
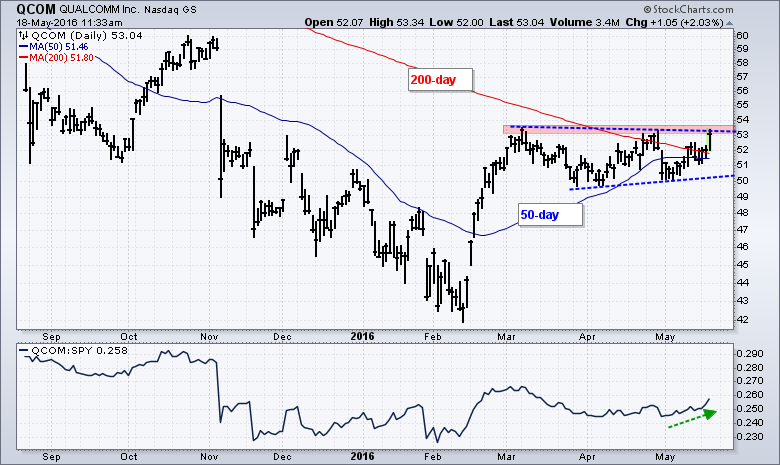
QualCom Battles Two Key Moving Averages
by Arthur Hill,
Chief Technical Strategist, TrendInvestorPro.com
QualCom has been going nowhere since early March, but a breakout may be in the making as the stock distances itself from two key moving averages. The chart shows QCOM with the 50-day and 200-day SMAs in the 51-52 area. The stock has bounced between 50 and 53 since early...
READ MORE
MEMBERS ONLY
Tech Offsets Finance - Correction Remains Mild - Watching Bonds for Risk - 2 Tech ETFs Showing Strength
by Arthur Hill,
Chief Technical Strategist, TrendInvestorPro.com
Mixed Up May as Tech offsets Finance // Mild Correction Extends for SPY // QQQ Reflects Strength in Tech // Watching Bonds for Clues on Risk Appetite // Adding an Exit Strategy to the PPO Signals // Watching Regional Banks, Semis and Homebuilders // Finance Sector Fails to Pop // SKYY and IGV Show Relative Strength //// ...........
Mixed...
READ MORE
MEMBERS ONLY
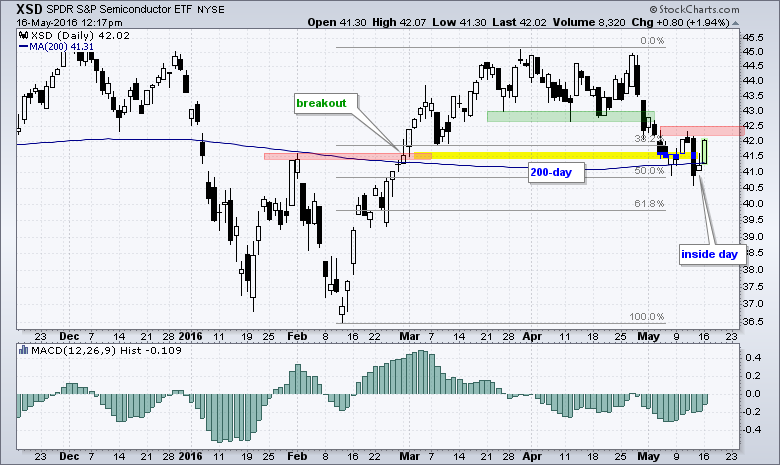
Semiconductor SPDR Bounces off Key Moving Average
by Arthur Hill,
Chief Technical Strategist, TrendInvestorPro.com
The Semiconductor SPDR (XSD) is one the leading industry-group ETFs at midday on Monday with a gain of around 2%. A look at the chart shows this big gain coming at a potential support or reversal zone. First, notice that XSD broke resistance with a big move in February. Broken...
READ MORE
MEMBERS ONLY
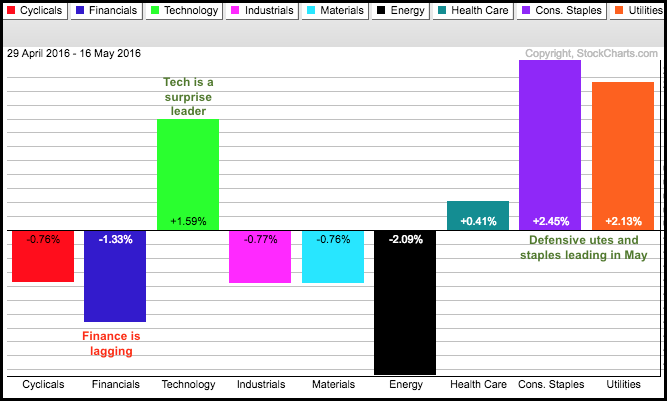
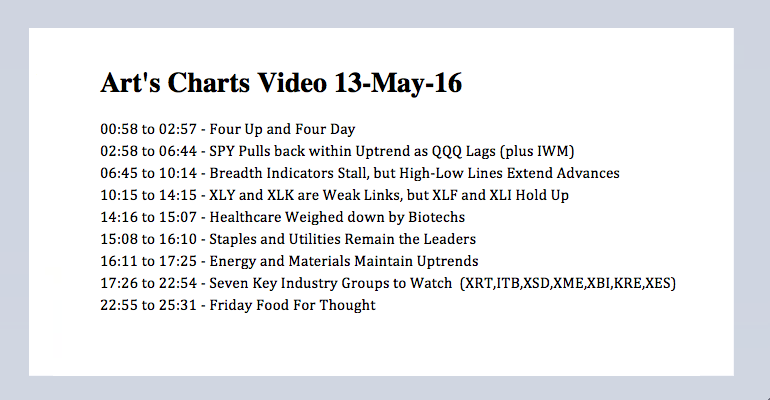
The Weight of the Evidence - Staples and Utes Lead - Finance and Industrials counter Retail and Semis - Video
by Arthur Hill,
Chief Technical Strategist, TrendInvestorPro.com
SPY Pulls back within Uptrend // QQQ Battles Support and Lags // Breadth Indicators Stall // High-Low Lines Extend Advances // Sector Table Remains Bullish // Consumer Discretionary and Technology are the Weak Links // Finance and Industrials are Holding Up // Healthcare Weighed down by Biotechs // Staples and Utilities Remain the Leaders // Energy and Materials Maintain...
READ MORE
MEMBERS ONLY
Testing the Gaps - Daily Breadth Measures - Treasuries Reflect Risk Off Mode - 7 Stocks with Potentially Bullish Setups
by Arthur Hill,
Chief Technical Strategist, TrendInvestorPro.com
SPY Tests the Gap // Giving QQQ a Little Wiggle Room // Broad Selling in Finance and Consumer Discretionary // XLF and XLI Test Breakout Resolve // Treasuries Reflect Risk-off Mode // Seven Stocks with Bullish Setups to Watch //// ...........
SPY Tests the Gap
The S&P 500 SPDR (SPY) gapped up on Tuesday and...
READ MORE
MEMBERS ONLY
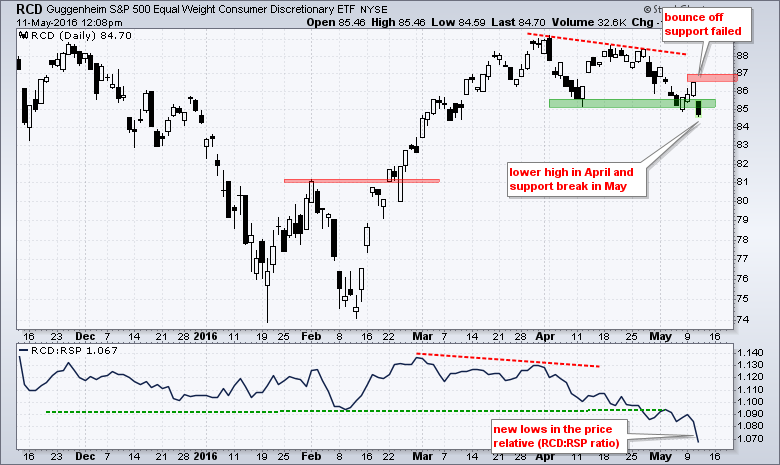
Retailers Weigh on Consumer Discretionary Sector
by Arthur Hill,
Chief Technical Strategist, TrendInvestorPro.com
The EW Consumer Discretionary ETF (RCD) got a bounce off support Monday-Tuesday, but gave it all back on Wednesday and broke support with a sharp decline. The chart shows the ETF forming a lower high in April and ultimately breaking support on Wednesday with a gap down. This makes for...
READ MORE