MEMBERS ONLY
Technology SPDR Becomes a Leader
by Arthur Hill,
Chief Technical Strategist, TrendInvestorPro.com
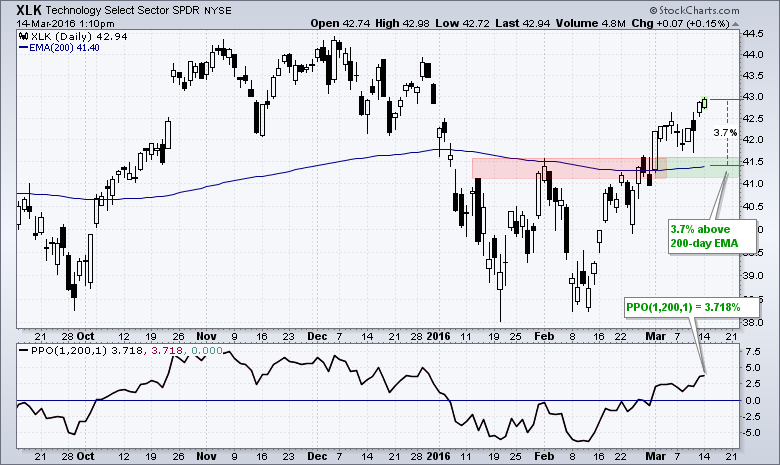
Chartists can measure relative performance by comparing the price to a moving average. In particular, I am going to measure the percentage above or below the 200-day EMA using the Percentage Price Oscillator (PPO). The PPO (1,200,1) measures the percentage difference between the 200-day EMA and the current...
READ MORE
MEMBERS ONLY
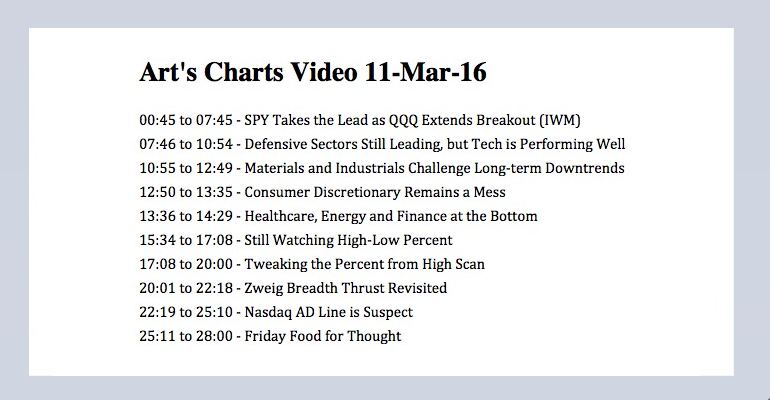
SPY Takes the Lead - XLK Performs Well - Revisiting the Zweig BT - Nasdaq AD Line is Suspect
by Arthur Hill,
Chief Technical Strategist, TrendInvestorPro.com
SPY Takes the Lead as QQQ Extends Breakout // Defensive Sectors Still Leading, but Tech is Performing Well // Materials and Industrials Challenge Long-term Downtrends // Consumer Discretionary Remains a Mess // Healthcare, Energy and Finance Round out the Bottom // Still Watching High-Low Percent // Tweaking the Percent from High Scan // Zweig Breadth Thrust Revisited...
READ MORE
MEMBERS ONLY
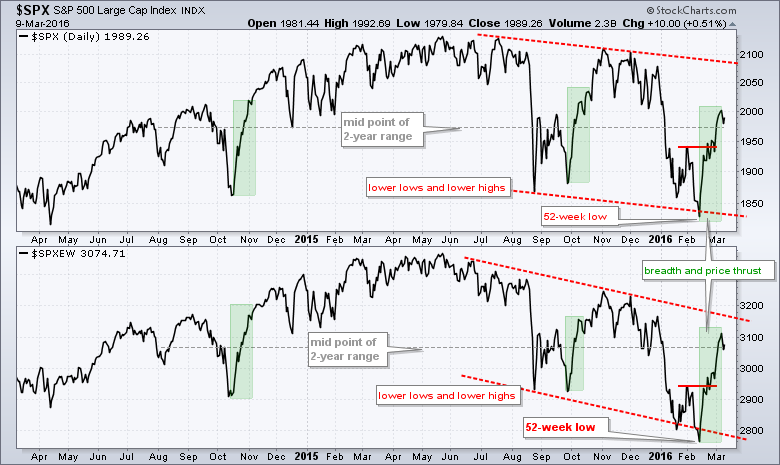
S&P Battles 2K - ST Uptrends Hold - Yen Tests Support - 6 Stocks to Watch
by Arthur Hill,
Chief Technical Strategist, TrendInvestorPro.com
S&P 500 Battles 2K // Majority of Stocks above 200-day // Short-term Uptrends Hold // Watching Bonds and Yields Closely // Gold and the Yen // Three High and Tight Flags in Tech Sector // Stock Setups and Breakouts // CA, CSCO, DTLK, MSFT, ABBV and FRGI // //
S&P 500 Battles 2K
There is...
READ MORE
MEMBERS ONLY
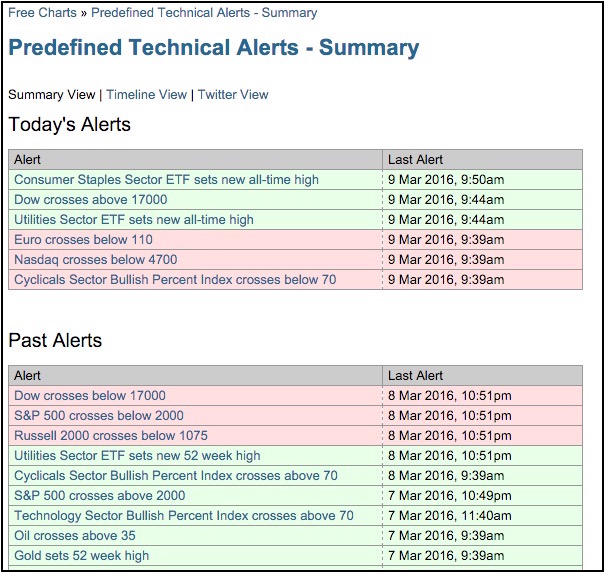
Consumer Staples and Utilities Pop Up on Technical Alerts Page
by Arthur Hill,
Chief Technical Strategist, TrendInvestorPro.com
Two of the nine sector SPDRs hit new 52-week highs today (March 9th) - and I bet you can figure out which ones. The image below comes from the pre-defined technical alerts page. Notice that we had three bullish alerts (green) and three bearish (red). The Consumer Staples SPDR (XLP)...
READ MORE
MEMBERS ONLY
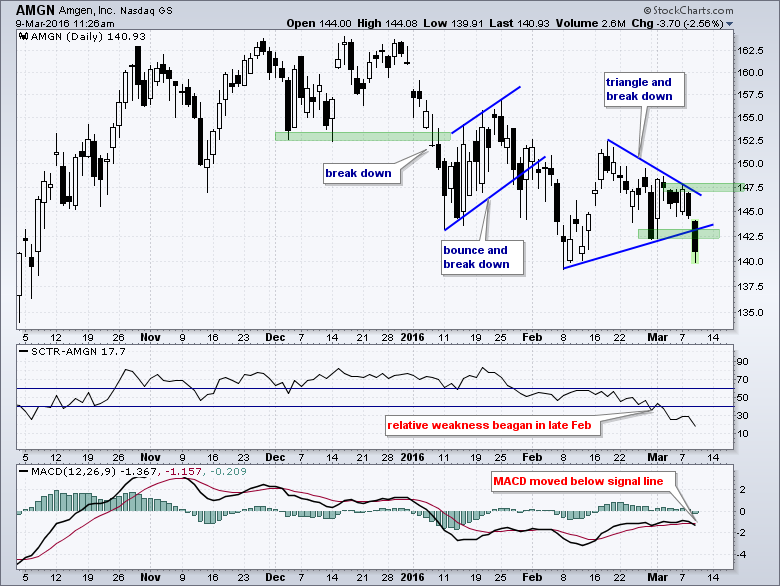
Relative Performance Breakdown Precedes Price Breakdown for Amgen
by Arthur Hill,
Chief Technical Strategist, TrendInvestorPro.com
The Biotech iShares (IBB) is one of the weakest industry group ETFs and the HealthCare SPDR (XLV) is one of the weakest sector SPDRs right now. Amgen is part of both and the stock broke down with a sharp decline the last two days. The price chart shows AMGN with...
READ MORE
MEMBERS ONLY
The Great Debate - Bond Trends Favorable for Stocks - Precious Metal Breakouts - Webinar Recording
by Arthur Hill,
Chief Technical Strategist, TrendInvestorPro.com
The Great Debate Rages // SPY Maintains Short-term Uptrend // QQQ Sputters // IWM Continues to Lead // Bond Trends Favor Stocks // April Crude Breaks Prior High // Gold, Platinum and Silver Hold Breakouts // Ranking the Sectors on 6-month Performance // XLU and XLP Still Leading // XLF and XLV Lagging // Webinar Preview ////
The Great Debate Rages...
READ MORE
MEMBERS ONLY
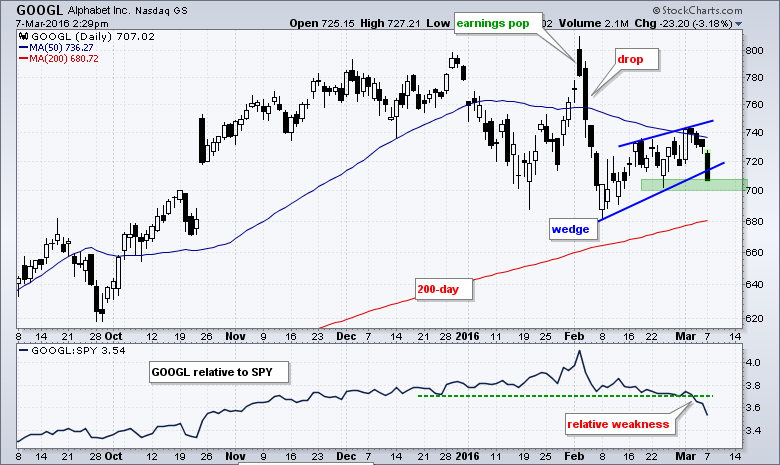
Alphabet Fails at Key Moving Average and Underperforms
by Arthur Hill,
Chief Technical Strategist, TrendInvestorPro.com
Alphabet (GOOGL) is weighing on the Nasdaq 100 ETF as it fails at the 50-day simple moving average and the price relative breaks down. The six month candlestick chart shows GOOGL surging to 800 after earnings and then immediately falling back below 700 in early February. The stock market got...
READ MORE
MEMBERS ONLY
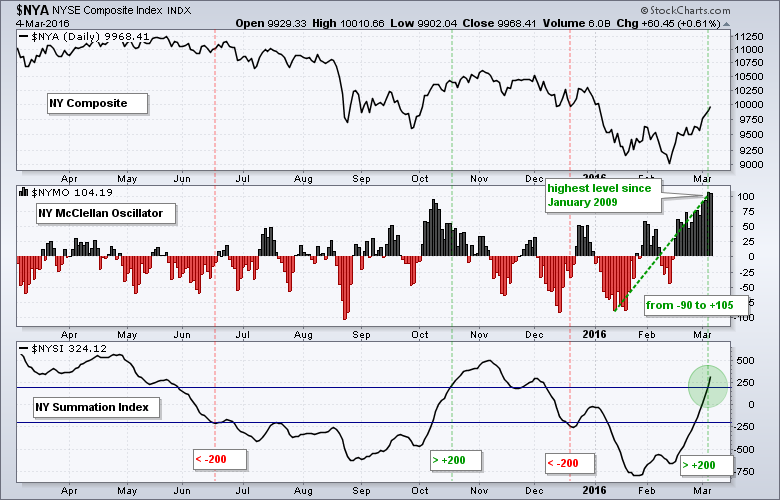
A Double-edged Sword for the McClellan Oscillators
by Arthur Hill,
Chief Technical Strategist, TrendInvestorPro.com
The McClellan Oscillators for the NYSE and Nasdaq surged over the last few weeks and hit multi-year highs. Medium-term, I would consider this breadth surge bullish. Short-term, however, it creates an overbought condition that could lead to a pullback or consolidation in stocks. Despite this double-edged sword, the medium and...
READ MORE
MEMBERS ONLY
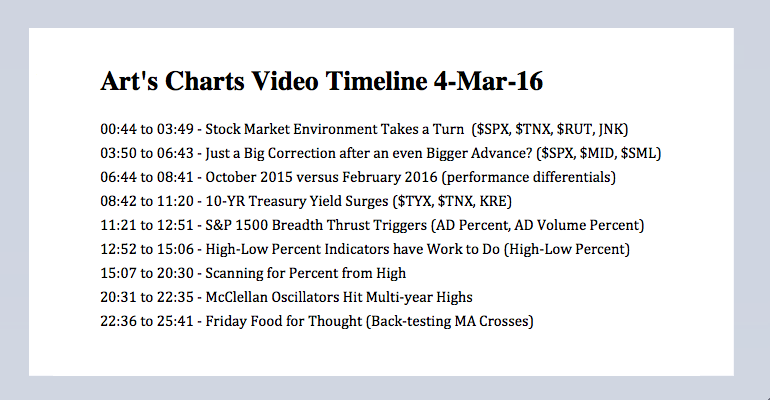
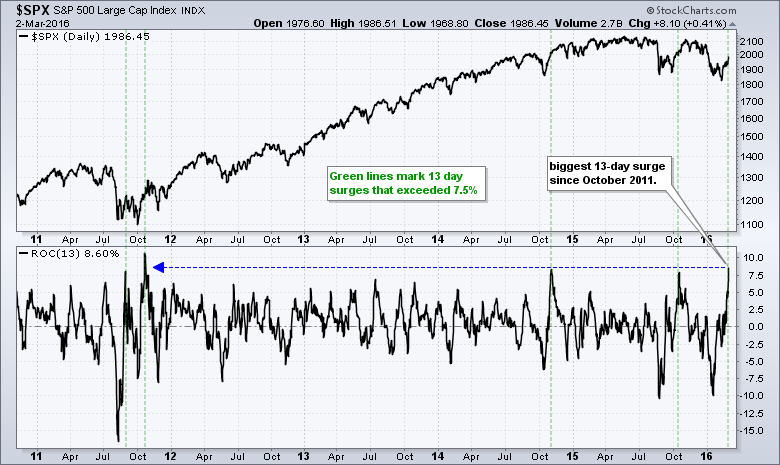
Market Environment Turns - October vs February - Breadth Thrust Triggers
by Arthur Hill,
Chief Technical Strategist, TrendInvestorPro.com
Stock Market Environment Takes a Turn // Just a Big Correction after an even Bigger Advance? // October 2015 versus February 2016 // 10-YR Treasury Yield Surges // S&P 1500 Breadth Thrust Triggers // High-Low Percent Indicators have Work to Do // McClellan Oscillators Hit Multi-year Highs // Friday Food for Thought ////
Stock Market Environment...
READ MORE
MEMBERS ONLY
Breadth Remains Strong - 4 Sector SPDRs above 200-day - Gold, Silver and Platinum Setups
by Arthur Hill,
Chief Technical Strategist, TrendInvestorPro.com
13 Days that Shook the Market // Bullish Breadth Thrust Nears // Checking the Signals in 2011 (again) // Still Hanging out in No Man's Land // All Nine Sector SPDRs in Short-term Uptrends // Bullish Continuation Patterns in Precious Metals // Nothing but Downtrend for Oil and NatGas ////
13 Days that Shook the...
READ MORE
MEMBERS ONLY
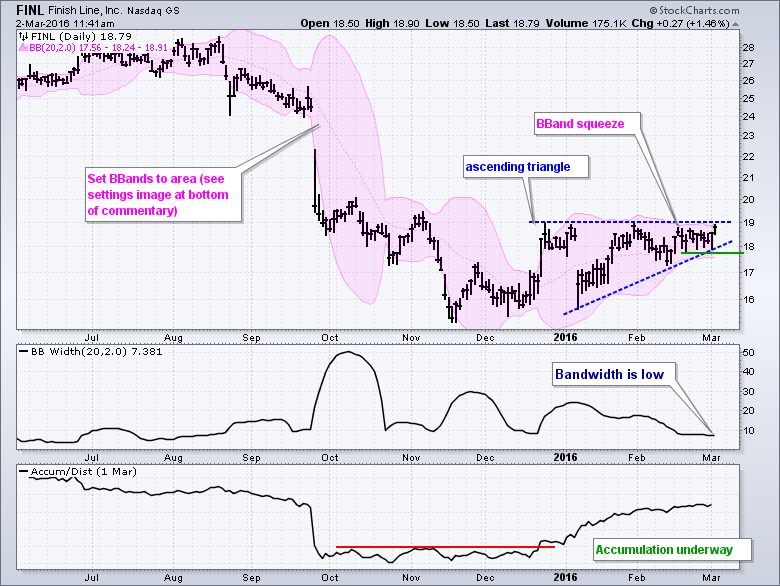
The Squeeze Play is on for Finish Line
by Arthur Hill,
Chief Technical Strategist, TrendInvestorPro.com
2015 was a rough year for Finish Line and the Retail SPDR (XRT) as both fell rather sharply. FINL was down over 20% and XRT fell over 8%. 2016 is shaping up a bit different because FINL is up around 2% year-to-date and XRT turned positive on Tuesday. Furthermore, FINL...
READ MORE
MEMBERS ONLY
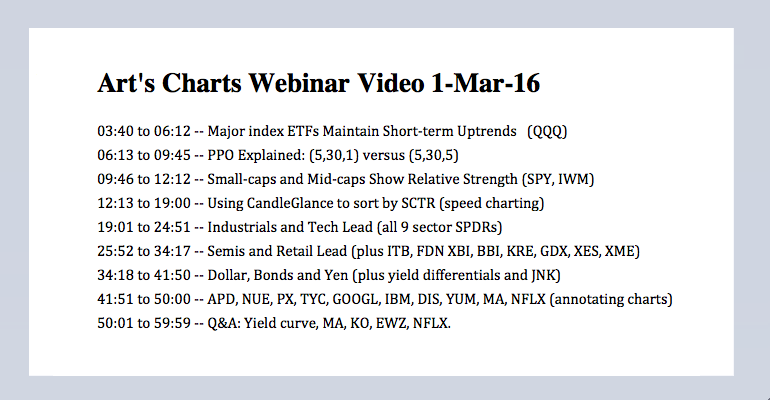
ST Uptrends Hold - Small-Mid Caps Outperform - Credit Improves - Webinar Video
by Arthur Hill,
Chief Technical Strategist, TrendInvestorPro.com
Major index ETFs Maintain Short-term Uptrends // Small and Mid Caps Show Relative Strength // Sentiment is Quite Bearish // Credit Conditions are Improving (JNK, LQD, TLT) // Keep an Eye on Safe Haven Assets (GLD,FXY,TLT) // Relative Weakness in Finance Sector Remains a Concern ////
Major index ETFs Maintain Short-term Uptrends
The major...
READ MORE
MEMBERS ONLY
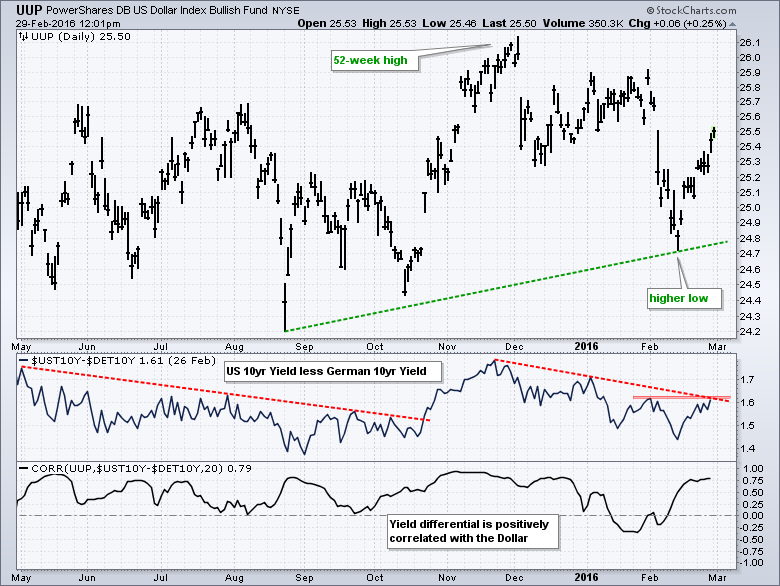
US-German Yield Differential Drives the Dollar ETF
by Arthur Hill,
Chief Technical Strategist, TrendInvestorPro.com
The chart for the US Dollar ETF (UUP) is bit of a mess, but I think the overall trend is up and the US-German yield differential looks poised to move higher. The main chart window shows UUP hitting a multi-month high with the October-November surge. The ETF then fell with...
READ MORE
MEMBERS ONLY
Breadth Thrust Falls Short - In the Retracement Zone - 3 Keys to ST Uptrend
by Arthur Hill,
Chief Technical Strategist, TrendInvestorPro.com
Breadth Thrust Falls Short // Setting a Potential Reversal Zone // 3 Keys to Short-term Uptrend // Bearish PPO Setups // Confirming the Short-term Trend with Breadth // XLK and XLY Tests Falling 200-day // XLE Remains the Weakest // XLP Forms Outside Reversal ////
Breadth Thrust Falls Short
We are still in a bear market environment. Breadth...
READ MORE
MEMBERS ONLY
Violent Ranges - Breadth Picks Up - SPY Leads with Breakout - Finance Lags
by Arthur Hill,
Chief Technical Strategist, TrendInvestorPro.com
A Most Violent Range // SPY is first to Clear Prior High // Watching for the Bullish Breadth Thrust // S&P 500 Leads High-Low Percent // Signal Pecking Order // Following Crude and Junk // Consumer Discretionary and Industrials Come Alive // Finance and Energy Remain Laggards // Friday Food for Thought ////
A Most Violent Range...
READ MORE
MEMBERS ONLY
Short-term Weight of the Evidence - Discretionary and Retail Lead - Wedges in XLI and XLB - Gold-Bonds-Yen
by Arthur Hill,
Chief Technical Strategist, TrendInvestorPro.com
Setting Short-term Support for the big 3 // Short-term Breadth Remains Bullish // Next Two Days Could Hold the Key for Breadth // Equal-weight, Small-caps and Mid-caps Take the Lead // Consumer Discretionary and Retail Outperform // Junk Bonds Get a Bounce // Bonds, Gold and the Yen // Rising Wedges in XLI and XLB // Stocks of...
READ MORE
MEMBERS ONLY
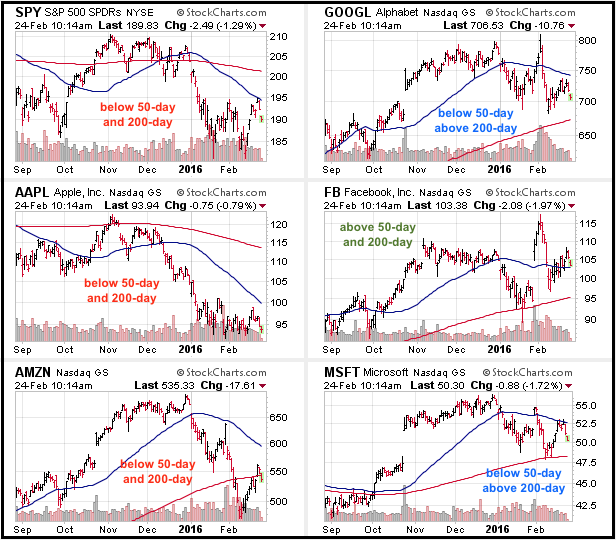
Four of the Big Five Tech Stocks Remain Weak
by Arthur Hill,
Chief Technical Strategist, TrendInvestorPro.com
Five stocks dominate the Nasdaq 100 ETF (QQQ) and traders should keep a close eye on these when trading or investing in QQQ. Apple (10.97%), Alphabet (9.34%), Microsoft (8.5%), Amazon (5.39%) and Facebook (4.98%) account for almost 40% of QQQ. After Facebook, the next biggest...
READ MORE
MEMBERS ONLY
SPY Hits Moment of Truth - %Above 20-day Gets OB - Dissecting the PPO Strategy - Webinar Recording
by Arthur Hill,
Chief Technical Strategist, TrendInvestorPro.com
SPY Hits Moment of Truth // %Above 20-day EMA Becomes Overbought // Oil is Still in a Downtrend // Reviewing the PPO Strategy // Reconciling the PPO with the Price Chart // Webinar Preview
SPY Hits Moment of Truth
It was another day and another gap as SPY closed at its highest level since early...
READ MORE
MEMBERS ONLY
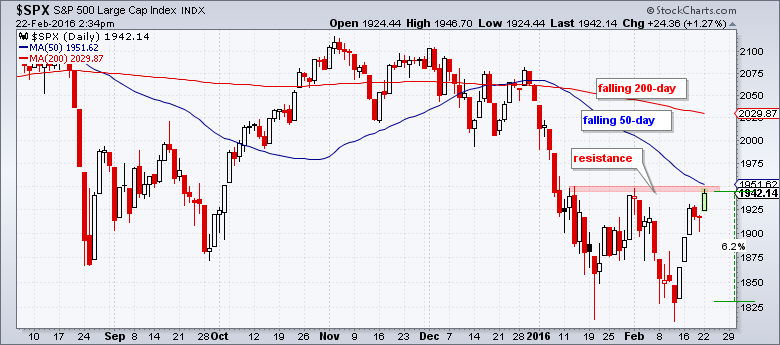
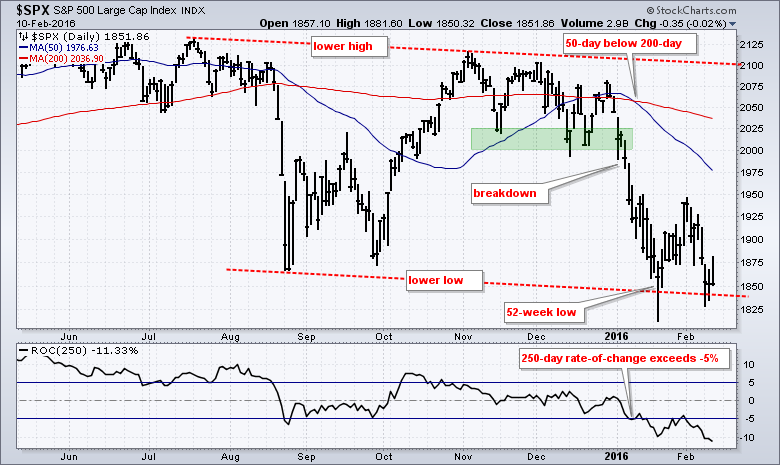
S&P 500 Nears First Test
by Arthur Hill,
Chief Technical Strategist, TrendInvestorPro.com
The S&P 500 is setting up for its first test as it nears resistance in the 1950 area. The chart below shows the index below the falling 200-day SMA and the 50-day SMA below the 200-day SMA. The overall trend here is clearly down, but the ~6% rally...
READ MORE
MEMBERS ONLY
Breadth Surge Falls Short - Another Gap to Mind - 4 Stock Charts
by Arthur Hill,
Chief Technical Strategist, TrendInvestorPro.com
Breadth Surge Falls Short of Bullish Signal // Another Gap to Mind // Stocks of Interest (CHKP, FB, SYK, UNH) ////
The long-term evidence remains bearish, but the short-term evidence turned bullish with the reversals and gaps in mid February. As noted in Friday's commentary, I use a three-prong approach to...
READ MORE
MEMBERS ONLY
Honeywell Leads the Industrials SPDR. Is GE Next?
by Arthur Hill,
Chief Technical Strategist, TrendInvestorPro.com
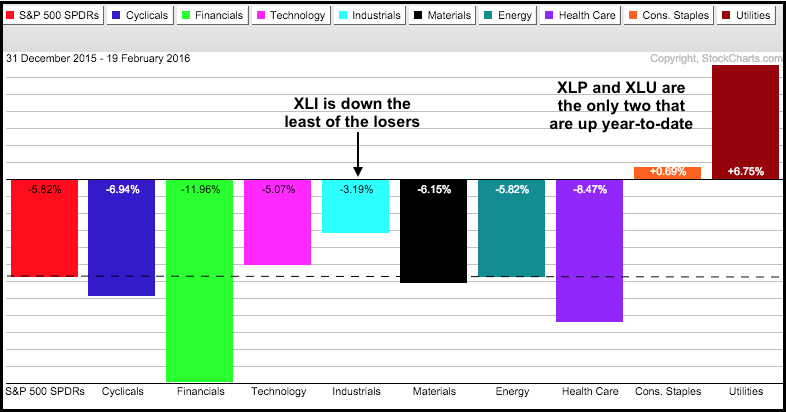
It has been a rough year for most of the stock market with seven of the nine sector SPDRs down year-to-date. The Consumer Staples SPDR (XLP) is up .69% and the Utilities SPDR (XLU) is up a whopping 6.75%. Among the seven negative sectors, the Industrials SPDR (XLI) is...
READ MORE
MEMBERS ONLY
3-Prong Approach - Weight of Evidence - Key Negative Correlations for XLU - XLK Firms
by Arthur Hill,
Chief Technical Strategist, TrendInvestorPro.com
Three Prong Approach // Major Index Trends Remain Down // Breadth Indicators remain Net Bearish // Some Risk Indicators Stabilize, but have yet to Turn Up // Staples and Utilities Still Holding Up // XLP Struggles since Market Peak // XLU Benefits from Two Negative Correlations // A Bounce within a Downtrend for XLU // XLK Battles Support...
READ MORE
MEMBERS ONLY
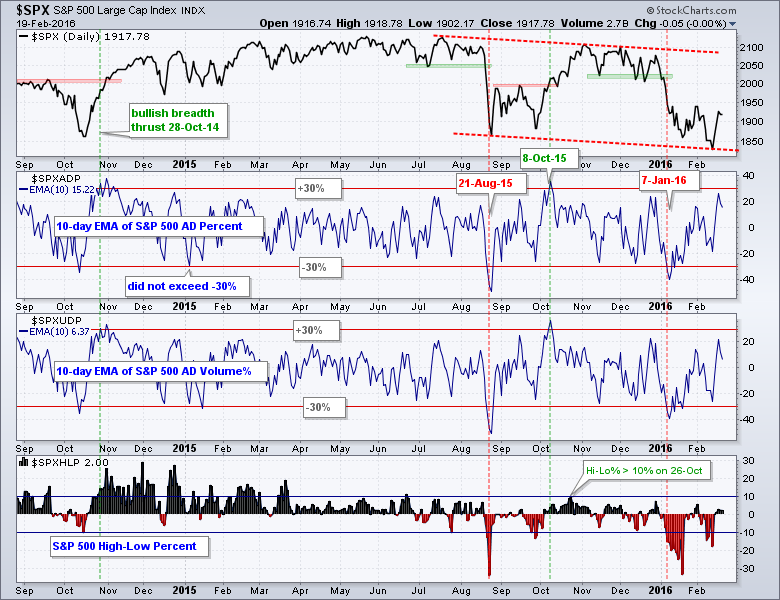
Putting 3 Days into Perspective - What Breadth Thrusts Look Like - Measuring Money Flow
by Arthur Hill,
Chief Technical Strategist, TrendInvestorPro.com
Putting the 3-day Surge into Perspective // The Concept of the Zweig Breadth Thrust // Don’t forget Nasdaq Stocks // A Weight of the Evidence Approach to Breadth Thrusts // Measuring Money Flow Thrusts with AD Volume Percent // Final Confirmation with High-Low Percent // The Bottom Line ////
Putting the 3-day Surge into Perspective
A...
READ MORE
MEMBERS ONLY
A Troika of Bullish Signals for Taiwan Semi
by Arthur Hill,
Chief Technical Strategist, TrendInvestorPro.com
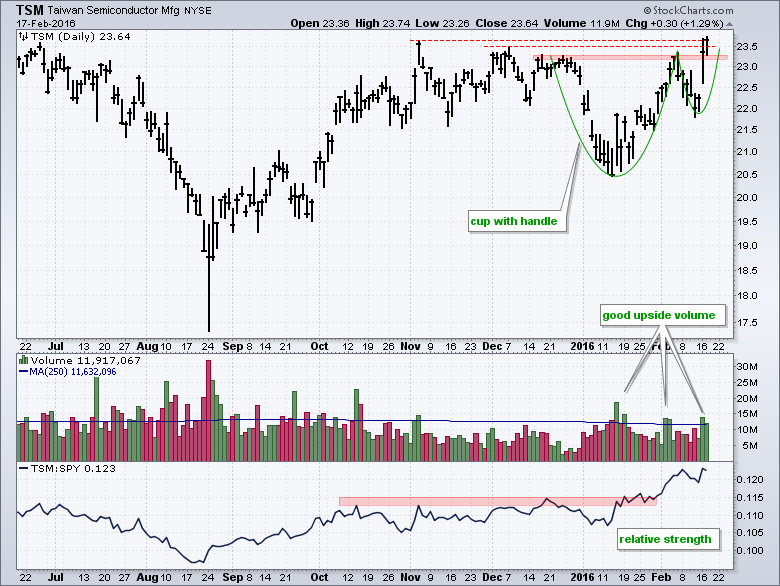
Taiwan Semiconductor is breaking out of a bullish pattern with good volume and the stock is showing relative strength. The price chart shows a cup-with-handle forming from December to mid-February. This is a bullish continuation pattern that was popularized by William O'Neil. There are three resistance levels marked...
READ MORE
MEMBERS ONLY
Mind the Gaps and the Island - 2011 Double Bottom - Key Stocks in XLE, XLB & XLI
by Arthur Hill,
Chief Technical Strategist, TrendInvestorPro.com
SPY Heads for First Retracement // A Look at the 2011 Double Bottom Bounce // QQQ Forges an Island Reversal // Energy, Materials and Industrials Lead Short-term Bounce // Charting the Key Stocks in XLE, XLB and XLI // XOM, CVX, SLB, DD, DOW, MON, GE, HON, MMM ////
Mind the Gaps
SPY followed through on...
READ MORE
MEMBERS ONLY
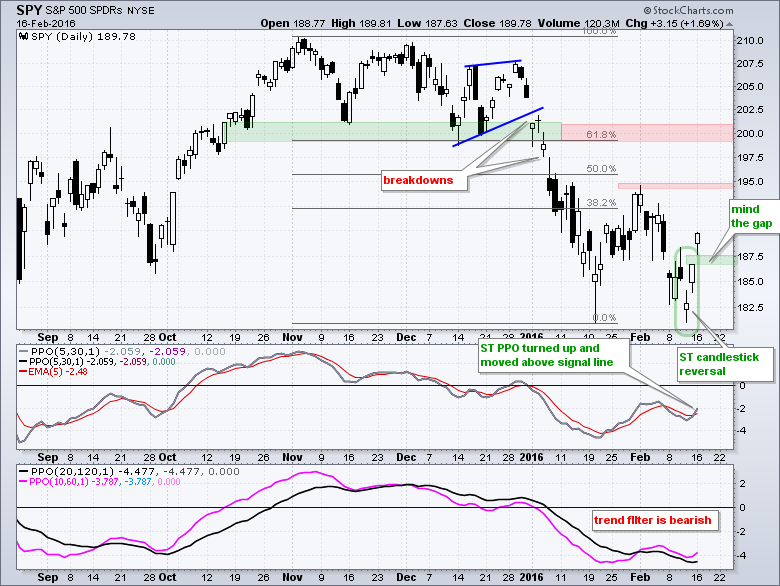
Long-term Trend Review - SPY Forges Candlestick Reversal - Oil - Webinar Recording
by Arthur Hill,
Chief Technical Strategist, TrendInvestorPro.com
Keep the Long-term Trends in Mind // A Candlestick Reversal for SPY // XLP Triggers Bullish PPO Signal // Brent versus WTI // Webinar Preview ////
Keep the Long-term Trends in Mind
The long-term trends are down for SPY, QQQ and IWM, but a short-term reversal pattern last week and a gap on Monday could...
READ MORE
MEMBERS ONLY
New Lows across US, Asia & Europe - Measuring Participation w/ %Above 50-day
by Arthur Hill,
Chief Technical Strategist, TrendInvestorPro.com
52-week Lows Reinforce Downtrends // Downtrends in Five Key Asian Markets // Italy and Spain Lead Europe to New Lows // Lower Lows all Around in the US // Using the %Above 50-day EMA to Gauge Participation // Using the %Above 50-day EMA to Rank Performance // Friday Food for Thought
52-week Lows Reinforce Downtrends
The...
READ MORE
MEMBERS ONLY
The Realities of Support, Oversold Conditions, Hiding Places, Correlations and Cash in Bear Markets
by Arthur Hill,
Chief Technical Strategist, TrendInvestorPro.com
Trend Trumps All Else // Forget about Support Levels in a Downtrend // Oversold Can Become Even More Oversold // Elevator Down Stairs Higher // Few Places to Hide // Correlations Rise in a Bear Market // Cash is a Real Position // A Penny Saved is Worth more Than a Penny Earned ////
Stocks are getting slammed...
READ MORE
MEMBERS ONLY
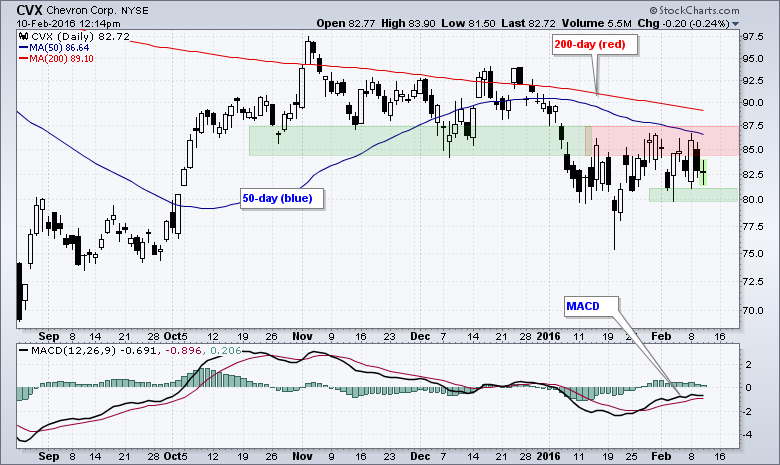
Chevron Stalls out Below Two Key Moving Averages
by Arthur Hill,
Chief Technical Strategist, TrendInvestorPro.com
Chevron (CVX) is a long-term downtrend and looks vulnerable to another leg lower. The price chart shows CVX trading below the falling 200-day moving average and below the 50-day moving average. Also notice that the 50-day is below the 200-day. These relationships indicate that the long-term trend is down. The...
READ MORE
MEMBERS ONLY
Gaps and Wedge Breaks Remain for SPY, QQQ and IWM
by Arthur Hill,
Chief Technical Strategist, TrendInvestorPro.com
Before looking at the short-term situation for SPY, QQQ and IWM, let's review the bigger trends using the S&P 500 and Russell 2000. Some things are open for debate in the stock market, but I don't think there is much debate on the long-term...
READ MORE
MEMBERS ONLY
Risk-On Sectors Stumble - Those Pesky Hammers - Webinar Recording
by Arthur Hill,
Chief Technical Strategist, TrendInvestorPro.com
Trend is Not Everything, it's... // Those Pesky Hammers // New Lows in Key Sectors // Even Healthcare is not Healthy // Long-term Laggards Become Short-term Leaders // Staples Start Feeling the Heat ////
Trend is Not Everything, it's...
If Vince Lombardi were a trend follower, he would probably say: "trend...
READ MORE
MEMBERS ONLY
Three Big Sectors Hit New Lows for the Year
by Arthur Hill,
Chief Technical Strategist, TrendInvestorPro.com
There are nine sectors in the S&P 500 SPDR (SPY) and their weights range from 2.82% (materials) to 20.17% (technology). The technology sector is around seven times bigger than the materials sector and this means that not all sectors affect the S&P 500 the...
READ MORE
MEMBERS ONLY
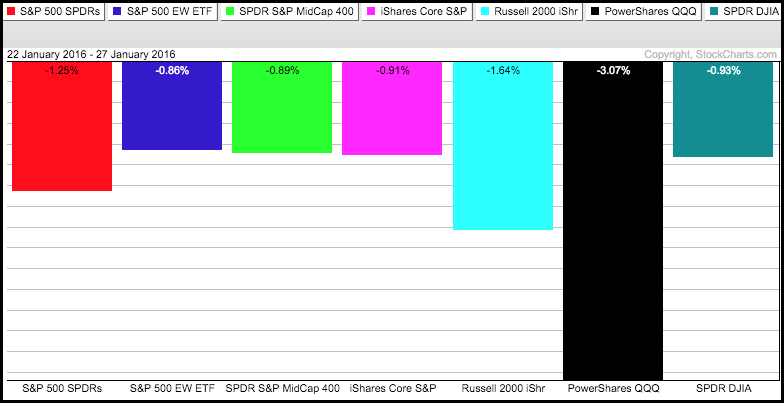
Small-caps, Finance and Tech Weigh on Market
by Arthur Hill,
Chief Technical Strategist, TrendInvestorPro.com
After sharp declines the first two weeks of the year, the stock market turned into one mixed up beast the last three weeks. The PerfChart below shows three-week performance for the seven major index ETFs. All seven were down 6+ percent the first two weeks of the year, but four...
READ MORE
MEMBERS ONLY
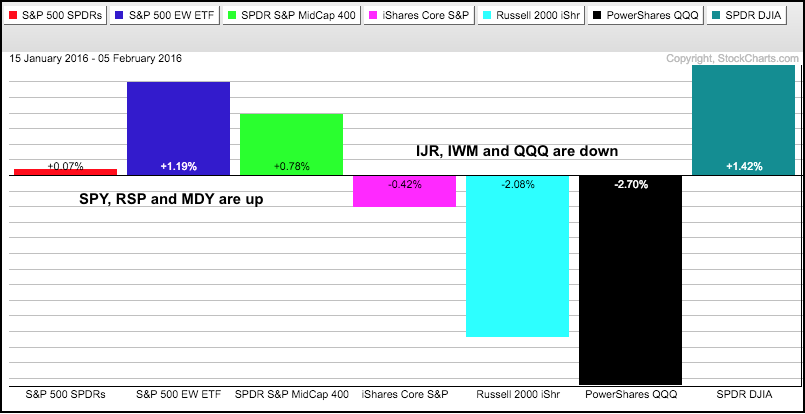
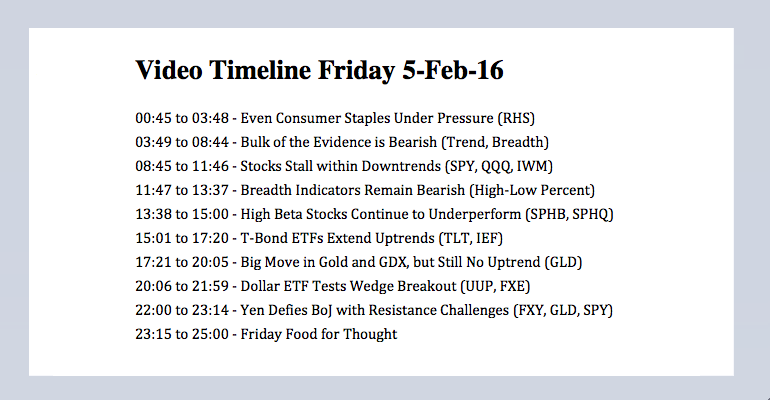
Staples Under Pressure - Weight of Evidence - Beta vs Quality - Gold-Dollar-Yen
by Arthur Hill,
Chief Technical Strategist, TrendInvestorPro.com
Even Consumer Staples are Under Pressure // Bulk of the Evidence is Bearish // Stocks Stall within Downtrends // Breadth Indicators Remain Bearish // High Beta Stocks Continue to Underperform // T-Bond ETFs Extend Uptrends // Big Move in Gold and GDX, but Still No Uptrend // Dollar Negates Wedge Breakout // Yen Defies BoJ with Resistance Challenges...
READ MORE
MEMBERS ONLY
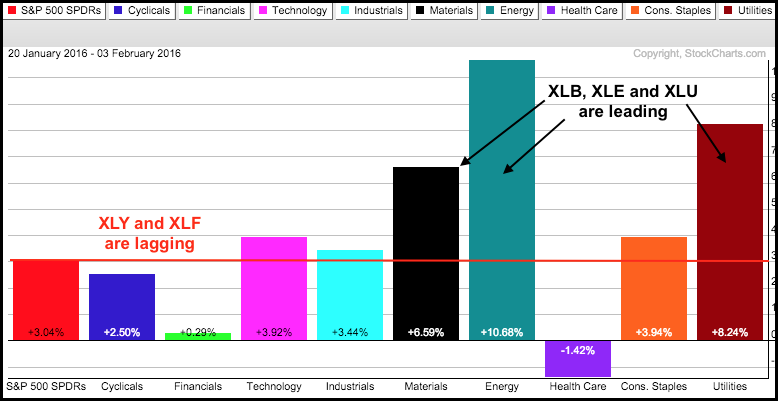
Wrong Sectors Leading - Key Industries Lagging - Testing the Wedges - XLU and the PPO Strategy
by Arthur Hill,
Chief Technical Strategist, TrendInvestorPro.com
Wrong Sectors Leading // Key Industry Groups Lagging // Is the FORCE Bullish or Bearish? // Testing Wedge Support (SPY, QQQ, IWM) // Overview of the Nine Sector SPDRs // Oversold Bounces for Housing and Semis // Showing Patience with the Gold Miners ETF (and gold) ////
Wrong Sectors Leading
The stock market is in the midst...
READ MORE
MEMBERS ONLY
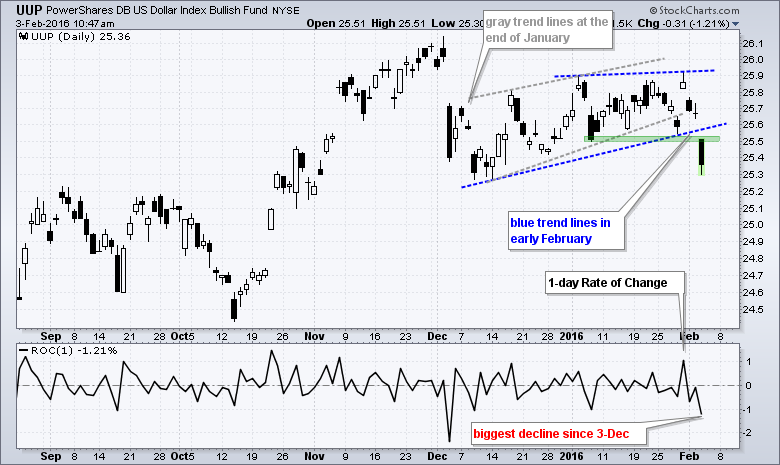
Dollar Breaks Wedge Support, but How Bearish is It?
by Arthur Hill,
Chief Technical Strategist, TrendInvestorPro.com
The US Dollar ETF (UUP) is getting whacked on Wednesday and breaking its January lows. The trading day is not over yet, but the Dollar is on pace for its biggest daily decline since early December. On the price chart below, notice how UUP fell sharply in early December and...
READ MORE
MEMBERS ONLY
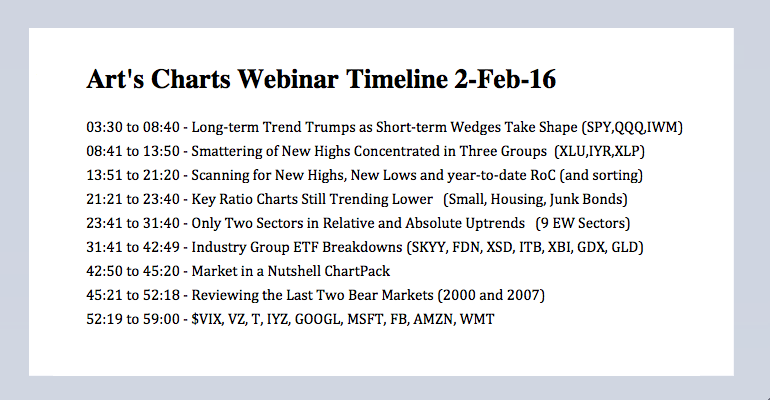
Downtrend Holds Trump - New Highs in 3 Groups - Webinar Recording
by Arthur Hill,
Chief Technical Strategist, TrendInvestorPro.com
Long-term Trend Trumps // Short-term Wedges Taking Shape // Key Ratio Charts Still Trending Lower // Smattering of New Highs // New Highs Concentrated in Three Groups // Relative and Absolute Uptrends // Webinar Highlights ////
Long-term Trend Trumps
Stocks firmed in mid January as the major index ETFs formed big hammers and we even saw some...
READ MORE
MEMBERS ONLY
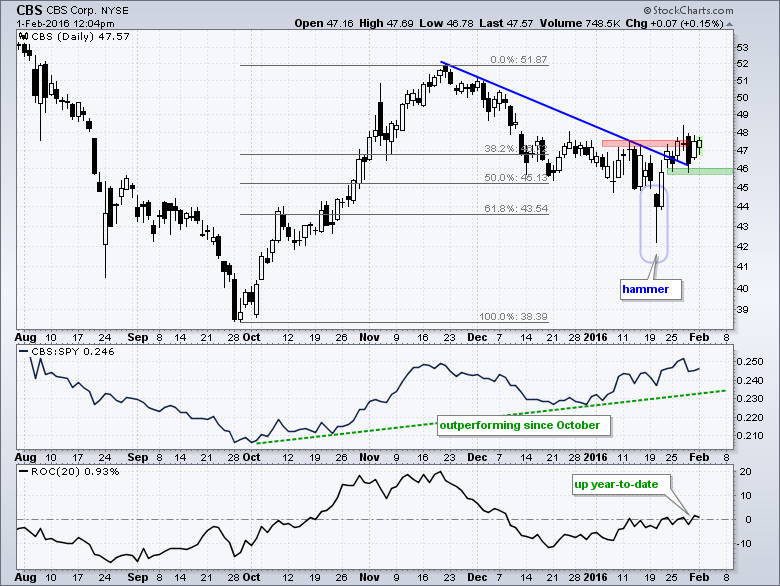
CBS Attempts to Buck Broad Market Selling Pressure
by Arthur Hill,
Chief Technical Strategist, TrendInvestorPro.com
It was a rough January for stocks, but CBS held up quite well and shows a bullish looking chart. On the price chart, CBS sports a classic surge-correct-breakout sequence. First, the stock advanced over 20% with a move from ~39 to ~52. Second, the stock corrected by retracing around 62%...
READ MORE
MEMBERS ONLY
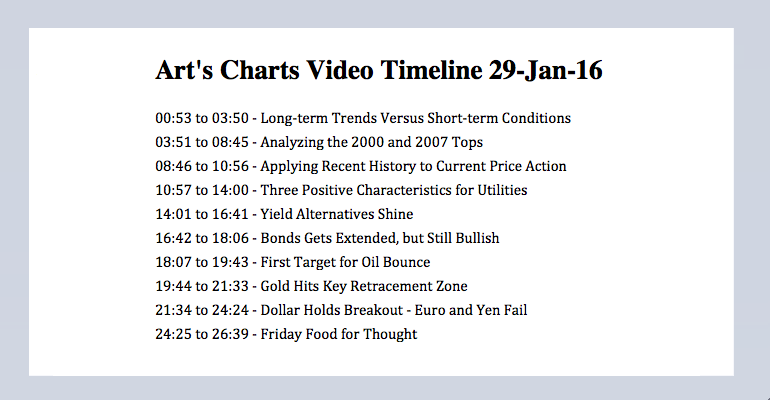
Trend versus Condition - 2000 and 2007 Tops versus Now - Video
by Arthur Hill,
Chief Technical Strategist, TrendInvestorPro.com
Long-term Trends Versus Short-term Conditions // Analyzing the 2000 and 2007 Tops // Applying Recent History to Current Price Action // Three Positive Characteristics for Utilities // Yield Alternatives Shine // Bonds Gets Extended, but Still Bullish // First Target for Oil Bounce // Gold Hits Key Retracement Zone // Dollar Holds Breakout - Euro and Yen Fail...
READ MORE
MEMBERS ONLY
IWM and QQQ Lead Lower - Market Between a Big Rock and a Hard Place
by Arthur Hill,
Chief Technical Strategist, TrendInvestorPro.com
Small-caps and Large-techs Lead Lower // SPY Fails to Follow Through // QQQ Nears 52-week Low // Dragonfly Doji versus the Hammer // Between a Huge Rock and a Hard Place (FDN, SMH, IGV, SKYY, IGN, XBI, ITB, KRE) ////
QQQ and IWM Lead Lower
Last week's hammers remain on the weekly charts...
READ MORE