MEMBERS ONLY
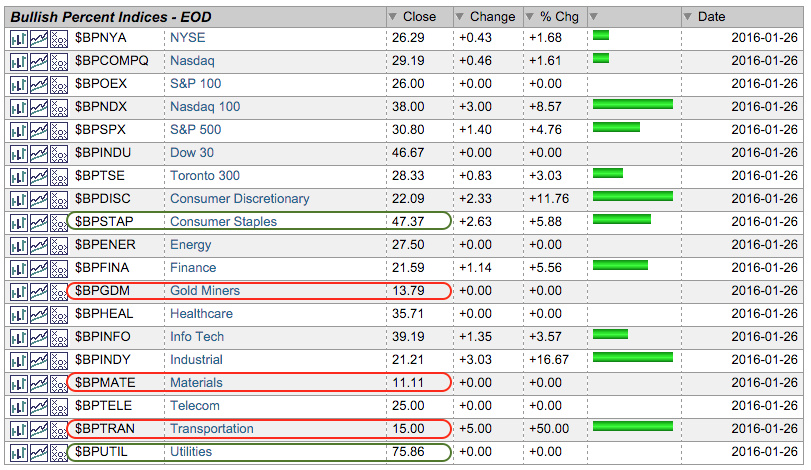
Only One Bullish Percent Index is above 50%
by Arthur Hill,
Chief Technical Strategist, TrendInvestorPro.com
The selling pressure this year was broad enough to push all but one of the Bullish Percent Indexes below 50%, and most below 30%. Note that StockCharts tracks the Bullish Percent Index (BPI) for the ten sectors, several broad market indexes and the Gold Miners Index. The image below comes...
READ MORE
MEMBERS ONLY
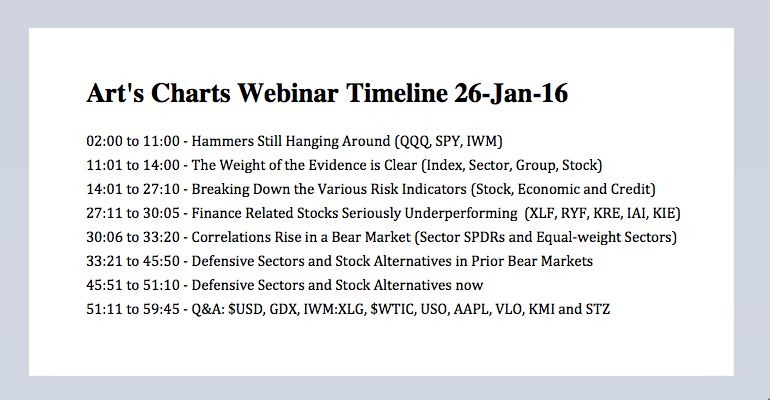
Hammers Still Hanging Around - Rising Correlations in Bear Markets
by Arthur Hill,
Chief Technical Strategist, TrendInvestorPro.com
Hammers Still Hanging Around // The Weight of the Evidence is Clear // Correlations Rise in a Bear Market // Defensive Sector Performance in Prior Bear Market // Performance of Stock Alternatives in Prior Bear Market // Webinar Highlights ////
Hammers Still Hanging Around
There was no follow-through to last week's hammers as stocks...
READ MORE
MEMBERS ONLY
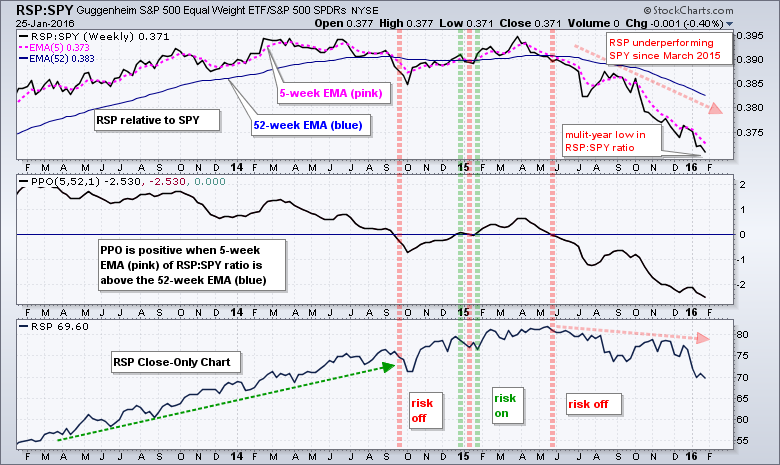
Equal-weight S&P 500 Continues to Reflect Risk Aversion
by Arthur Hill,
Chief Technical Strategist, TrendInvestorPro.com
Among other ways, chartists can measure the risk appetite in the stock market by comparing the performance of the Equal-weight S&P 500 ETF (RSP) with the S&P 500 SPDR (SPY). RSP represents the average stock in the S&P 500 and the performance of small...
READ MORE
MEMBERS ONLY
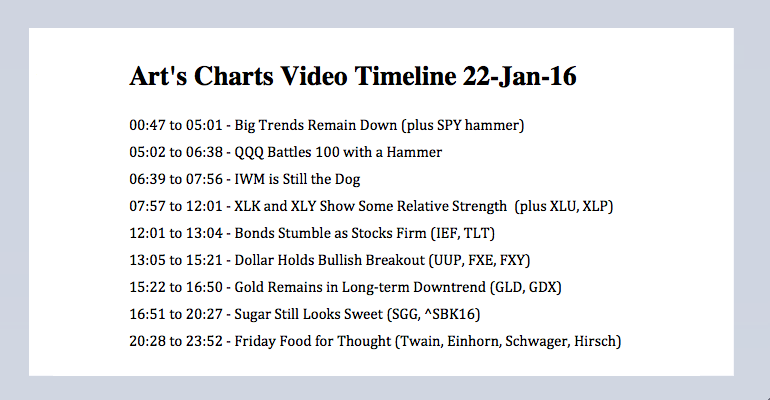
IWM Continues to Lag - QQQ and XLK form Big Hammers - Dollar-Gold-Sugar
by Arthur Hill,
Chief Technical Strategist, TrendInvestorPro.com
Big Trends Remain Down // IWM is Still the Dog // QQQ Battles 100 with a Hammer // XLK and XLY Show Some Relative Strength // Bonds Stumble as Stocks Firm // Dollar Holds Bullish Breakout // Gold Remains in Long-term Downtrend // Sugar Still Looks Sweet // Friday Food for Thought ////
Big Trends Remain Down
The bulk...
READ MORE
MEMBERS ONLY
Understanding Bear Market Bounces, Patterns, Signals and Retracements
by Arthur Hill,
Chief Technical Strategist, TrendInvestorPro.com
Candles Show Firming, but Closes say Otherwise // Trading Counter-trend Patterns and Signals in Bear Markets // Using Retracements to Anticipate Counter-trend Peaks // Understanding ZigZag Extensions ////
Candles Show Firming, but Closing Prices say Otherwise
There is certainly a lot of chatter concerning Wednesday's intraday reversal. The S&P 500...
READ MORE
MEMBERS ONLY
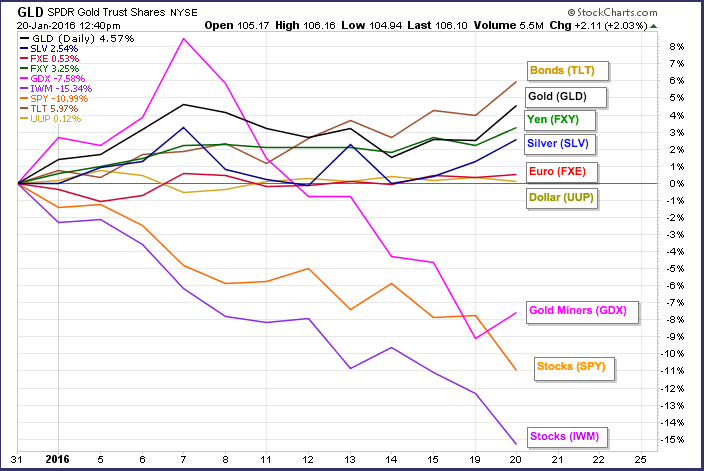
Gold Surges as Market Swoons, but Miners remain Weak
by Arthur Hill,
Chief Technical Strategist, TrendInvestorPro.com
The Gold SPDR (GLD) and the Silver ETF (SLV) continue to attract money as alternatives to stocks and other commodities. GLD and SLV were down rather sharply in 2015, but both are up year-to-date in 2016. GLD is up over 4% and SLV is up just over 2%. In contrast,...
READ MORE
MEMBERS ONLY
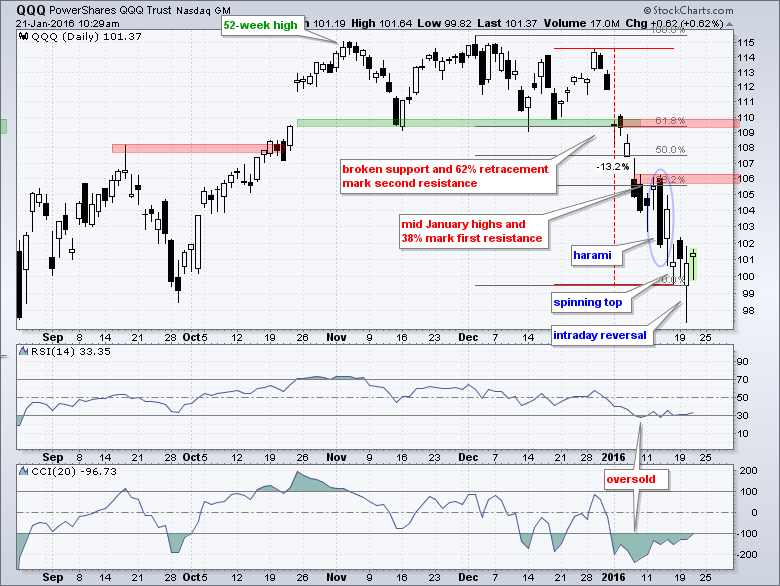
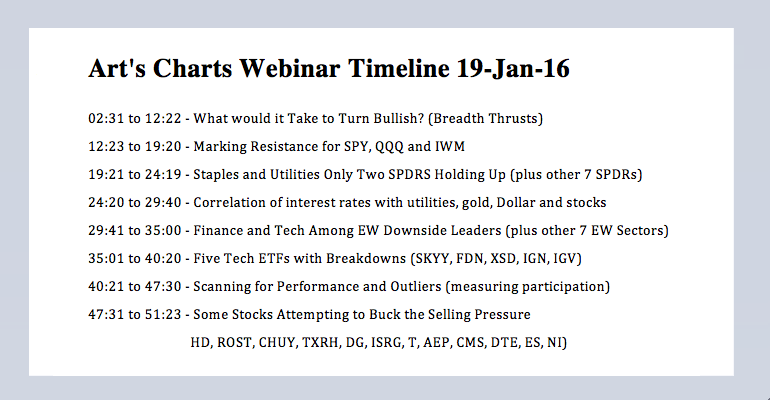
Why Bearish and What would it Take to Turn Bullish Again? - Webinar Video
by Arthur Hill,
Chief Technical Strategist, TrendInvestorPro.com
SPY Sets up Oversold Bounce // QQQ Firms with Spinning Top // What Would it take to Turn Bullish? // Finance and Tech Among the Downside Leaders // Webinar Highlights //// SPY Sets up Oversold Bounce // QQQ Firms with Spinning Top // What Would it take to Turn Bullish? // Finance and Tech Among the Downside Leaders...
READ MORE
MEMBERS ONLY
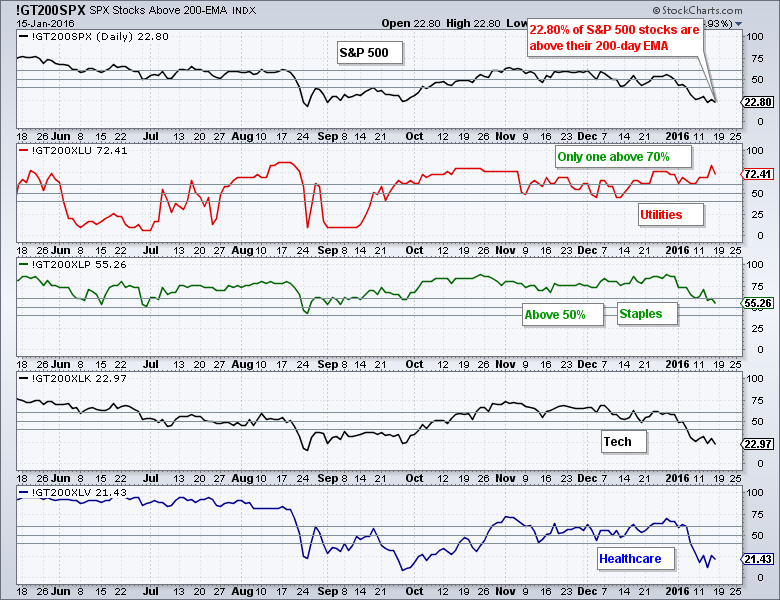
Using %Above 200-day to Rank Sectors and Define the Market Environment
by Arthur Hill,
Chief Technical Strategist, TrendInvestorPro.com
Chartists can use the percentage of stocks above the 200-day EMA to rank the sectors based on component trends. Using this breadth indicator, we can separate the weak sectors from the strong and get a good idea of the current market environment. I am working under the assumption that a...
READ MORE
MEMBERS ONLY
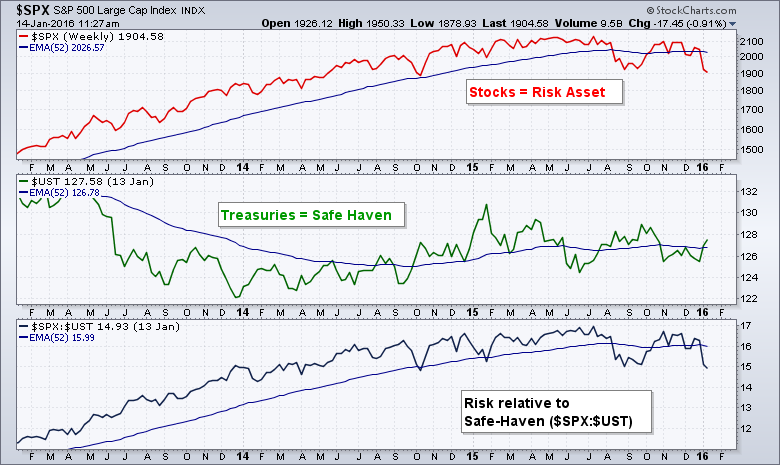
Finding Negative Correlations - Bonds and Yen Surge - Friday Food for Thought
by Arthur Hill,
Chief Technical Strategist, TrendInvestorPro.com
Finding Negative Correlations // Major Indices Remain in Bear Mode // New Lows Surge as Selling Expands // Bond ETFs Extend Support Bounce // Dollar Stalls after Breakout // Yen Traces out Rounding Bottom // Gold Forms Short-term Bull Flag // Friday Food for Thought ////
Finding Negative Correlations
Stocks were hammered again on Friday morning as the...
READ MORE
MEMBERS ONLY
Measuring Stock, Economic and Credit Risk - Negativity Abounds - Stress Index Holds Up
by Arthur Hill,
Chief Technical Strategist, TrendInvestorPro.com
High Beta Stocks Versus High Quality Stocks // Equal-weight versus Large-caps // Small-caps versus Mega-caps // Charting the Economy with Four ETFs // Junk versus Investment Grade and Treasuries // TED Spread Surges // Charting the Financial Stress Index // Conclusions ////
Introduction
Measuring the risk appetite in the financial markets can help investors with their portfolio allocations....
READ MORE
MEMBERS ONLY
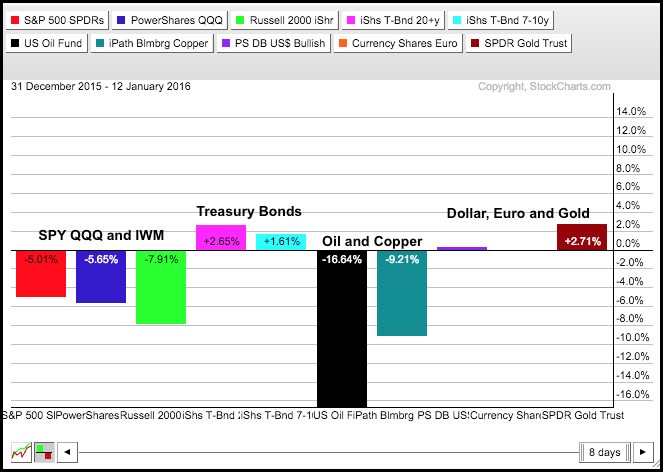
Gold, Dollar and Bonds Lead in 2016
by Arthur Hill,
Chief Technical Strategist, TrendInvestorPro.com
The year is young, but we are already seeing money move from relative risk (stocks) to relative safety (bonds). The PerfChart below shows the performance for ten intermarket ETFs year-to-date (12 January close). The histogram format makes it easy to spot the winners and the losers. The USO Oil Fund...
READ MORE
MEMBERS ONLY
Bearish Trend Filter for SPY - Tracking the Short S&P 500 ETF - Webinar Recording
by Arthur Hill,
Chief Technical Strategist, TrendInvestorPro.com
Nasdaq 100 Still Stands Out // Bearish Environment for SPY // Tracking the ProShares Short S&P 500 // Webinar Highlights (Scans!) ////
Chartists can get an overview of the "market" by charting the S&P 1500, S&P 500, S&P MidCap 400, S&P Small-Cap...
READ MORE
MEMBERS ONLY
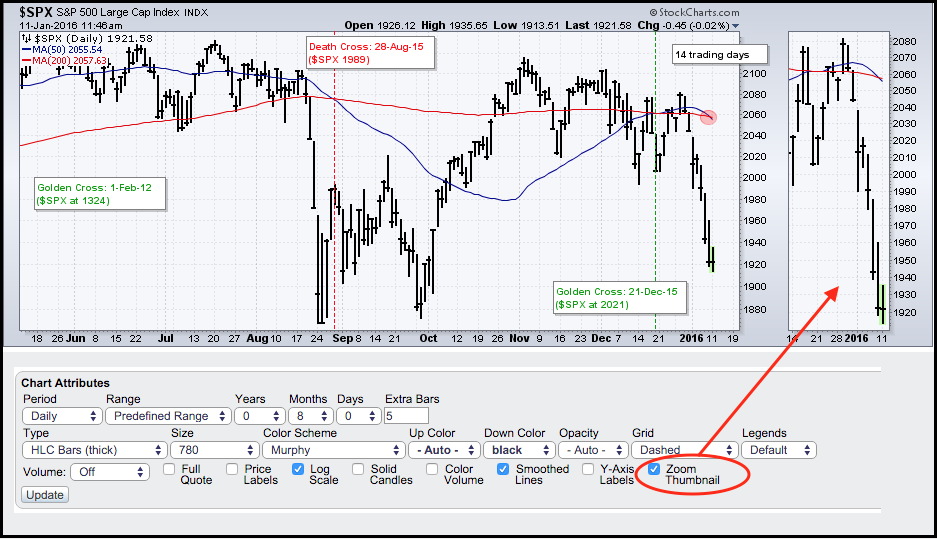
Another Death Cross Looms for the S&P 500
by Arthur Hill,
Chief Technical Strategist, TrendInvestorPro.com
Stocks took it on the chin over the last two weeks with the S&P 500 falling over 7% in just seven trading sessions (30-Dec to 8-Jan). The depth of this decline forced the 50-day moving average down and it is currently below the 200-day moving average. This death-cross,...
READ MORE
MEMBERS ONLY
IWM Hits New Low - High-Low Indicator Triggers for $SPX - Watch the Yen
by Arthur Hill,
Chief Technical Strategist, TrendInvestorPro.com
Large-caps Crack // S&P 500 Breaks 2K with Ease // IWM Hits 52-week Low // Using the Stochastic Oscillator to Gauge Price Levels // Small-caps and Mid-caps Lead New Low List // High-Low Percent Triggers for S&P 500 // IEF Holds Breakout as TLT Struggles // A Wild Ride for the Greenback // Watch...
READ MORE
MEMBERS ONLY
Don't Blame China - Sector Shift Hurts Large-caps - Treasuries Outperform
by Arthur Hill,
Chief Technical Strategist, TrendInvestorPro.com
Don't Blame China for December // Sector Shift Defines Large-cap Breakdown // Industrials and Finance Leading Lower // XRT and ITB Break Down Further // Gold Miners ETF Bounces off Support // Treasuries Surge and Outperform ////
Don't Blame China for December
Stocks extended their 2016 plunge with further losses early Thursday....
READ MORE
MEMBERS ONLY
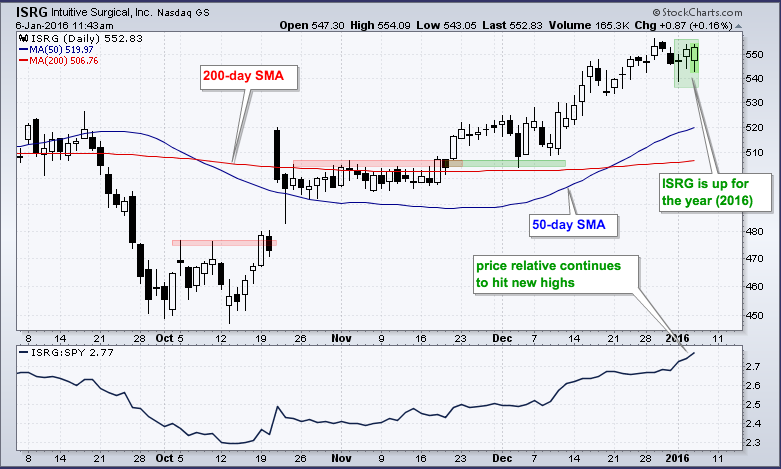
Intuitive Surgical Gets off to a Strong Start
by Arthur Hill,
Chief Technical Strategist, TrendInvestorPro.com
Not many stocks are currently up year to date and those that are show good relative strength in the face of broad selling pressure. Of the 1500 stocks that make up the S&P 500, S&P MidCap 400 and S&P Small-Cap 600, I count around...
READ MORE
MEMBERS ONLY
Webinar Video - Last 3 Sectors Standing - Dollar Gets Bull Signal
by Arthur Hill,
Chief Technical Strategist, TrendInvestorPro.com
A Tale of Two S&P 500 Indices // The Last Three Sectors Standing // Sector Breadth Tilts Bearish // Index High-Low Indicators Remain Split // Short-term Bullish Signal for Dollar // Treasury Trading Turns Dull // Webinar Video ////
The easiest way to visualize the current split in the market is by comparing the S&...
READ MORE
MEMBERS ONLY
Gold Stocks and ETFs Buck the Selling Pressure
by Arthur Hill,
Chief Technical Strategist, TrendInvestorPro.com
Stocks were hit hard on the open of the first trading day of 2016 with the vast majority falling, and falling sharply. There were a few pockets of strength and chartists can find these using the tables on the home page (midway down). The screenshot, which was taken around 9:...
READ MORE
MEMBERS ONLY
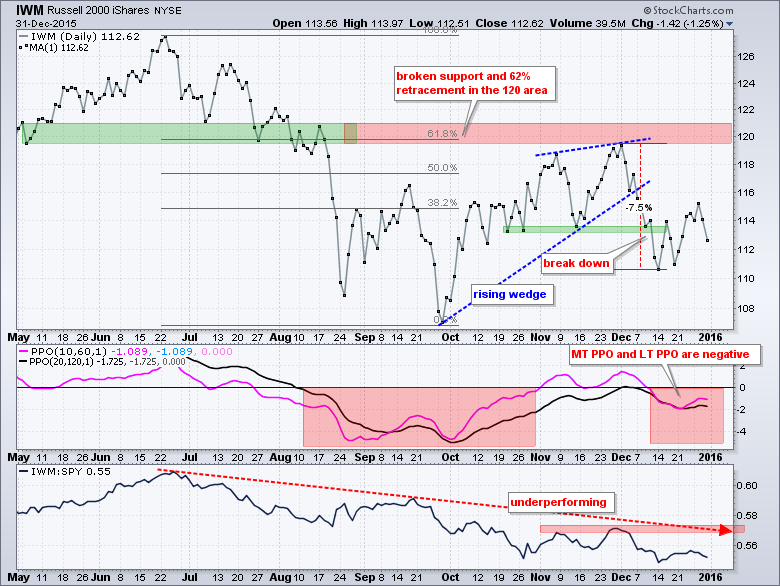
Small and Mid Caps Struggle - IWM Breaks Down - SPY Sets Up Important Test
by Arthur Hill,
Chief Technical Strategist, TrendInvestorPro.com
Once again, we have small-caps and mid-caps breaking down and weighing on the market. This is nothing new because the Russell 2000 iShares (IWM) and S&P MidCap SPDR (MDY) have been lagging the S&P 500 SPDR (SPY) and Nasdaq 100 ETF (QQQ) for the last six...
READ MORE
MEMBERS ONLY
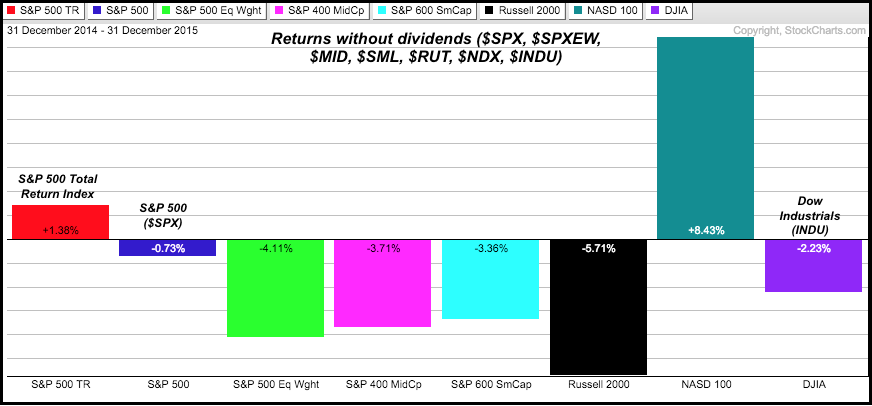
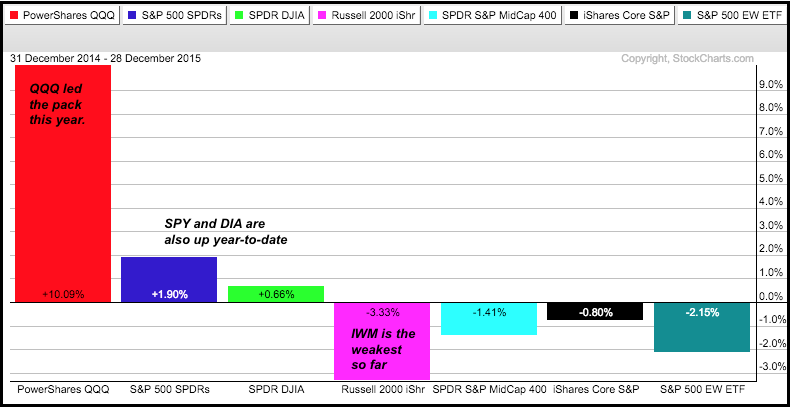
Do Dividends Matter?
by Arthur Hill,
Chief Technical Strategist, TrendInvestorPro.com
Depending on how you measure it, the stock market was up, down or flat in 2015. It also depends on what you call the stock market. Is it the S&P 500, S&P 500 Equal-Weight Index, the Dow, the Russell 2000, the Nasdaq? Truth be told, it...
READ MORE
MEMBERS ONLY
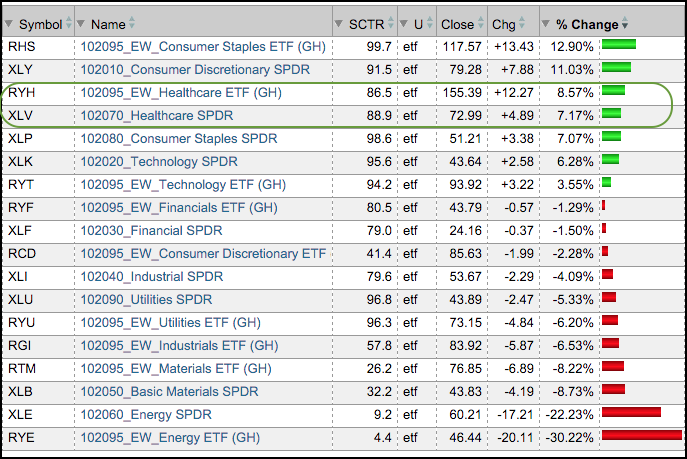
A Good Year for Healthcare, Staples and Technology
by Arthur Hill,
Chief Technical Strategist, TrendInvestorPro.com
2015 has been about as mixed as a market can get. This split market can be seen by looking at two versions of the S&P 500. The Large-cap S&P 500 SPDR (SPY) is up around 2.5% over the past year and the Equal-weight S&...
READ MORE
MEMBERS ONLY
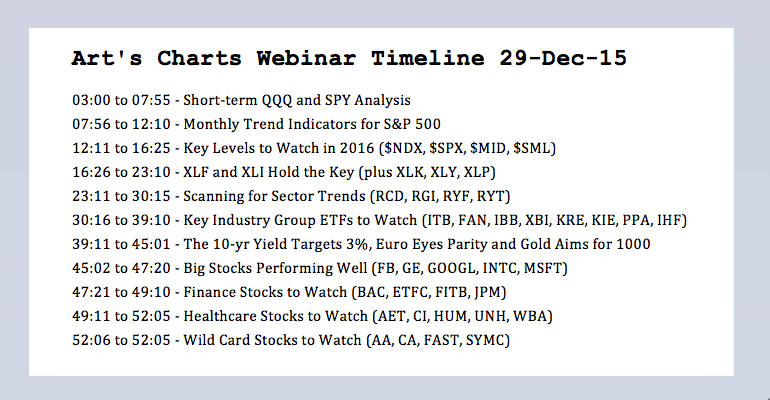
Key Levels in 2016 - SPX Remains Close to Highs - Gold, Bonds and Dollar
by Arthur Hill,
Chief Technical Strategist, TrendInvestorPro.com
Monthly Trend Indicators for S&P 500 // Key Levels to Watch in 2016 ($NDX, $SPX, $MID, $SML) // The 10-yr Yield Targets 3% // Euro Eyes Parity // Gold Aims for 1000 // Webinar Topics, ETFs and Stocks ////
Today's commentary and webinar will use long-term charts to extrapolate some trends that...
READ MORE
MEMBERS ONLY
QQQ and SPY Hold Short-term Reversals
by Arthur Hill,
Chief Technical Strategist, TrendInvestorPro.com
This is just a short update for the Nasdaq 100 ETF (QQQ) and the S&P 500 SPDR (SPY). I will post a 2016 preview later today using monthly charts to extrapolate some bigger trends at work. The daily and weekly trend indicators are bullish for both SPY and...
READ MORE
MEMBERS ONLY
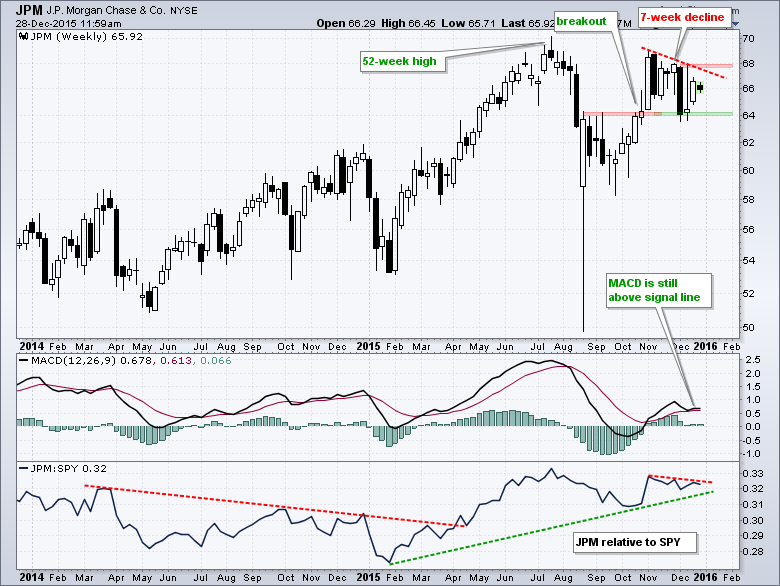
JP Morgan Chase Battles to Hold Breakout
by Arthur Hill,
Chief Technical Strategist, TrendInvestorPro.com
The Finance SPDR (XLF) and big banks led the market surge from late September to early November, but turned into laggards over the last seven weeks. JP Morgan Chase (JPM) personifies big bank performance with a breakout around 64 and a seven-week pullback that is testing this breakout zone. This...
READ MORE
MEMBERS ONLY
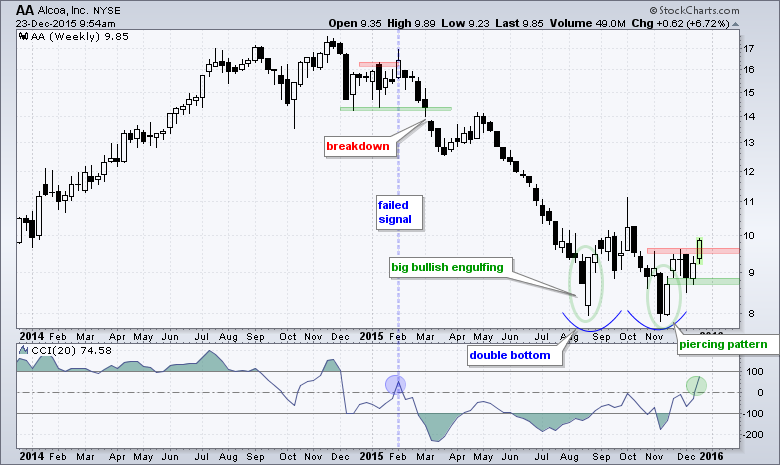
Alcoa Perks Up as CCI Breaks into Positive Territory
by Arthur Hill,
Chief Technical Strategist, TrendInvestorPro.com
Alcoa is showing early signs of relative strength and momentum is improving as the Commodity Channel Index (CCI) breaks into positive territory for the first time since February. 2015 was clearly a rough year as the stock fell over 35% from January to August. The overall trend is down, but...
READ MORE
MEMBERS ONLY
The Battle for 2K - 5 Stocks Holding QQQ Up - 5 Biotechs Keeping IBB Strong
by Arthur Hill,
Chief Technical Strategist, TrendInvestorPro.com
Was it that Bad last Week? // E-mini Continues Battle with 2K // QQQ Holds above Support Zone // Five Reasons for Relative Strength in QQQ // Healthcare Still Holding Up // Biotech iShares Holds Gap // Five Strong Biotechs and One at Support // Best Wishes.... ////
Was it that Bad last Week?
I will post a...
READ MORE
MEMBERS ONLY
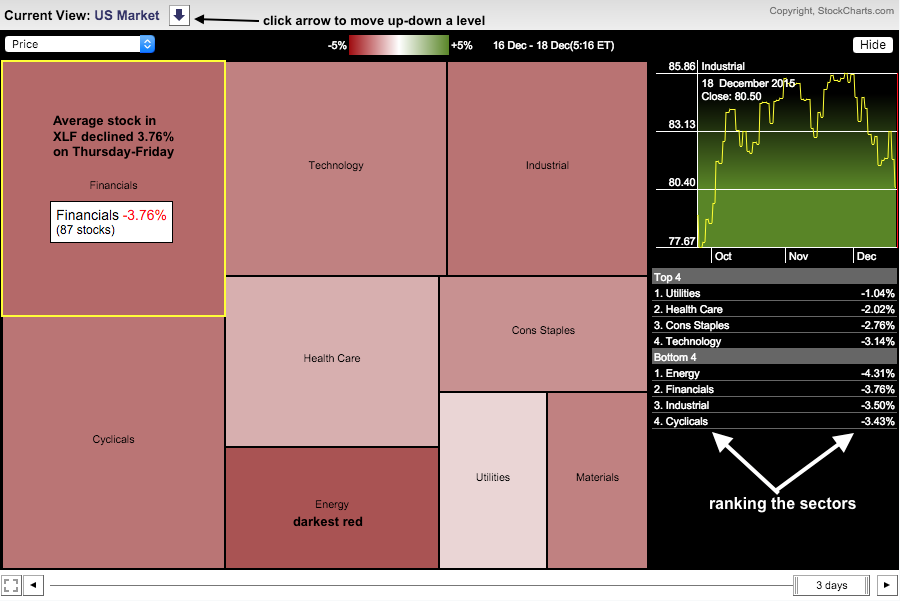
MarketCarpet Shows A Few Stocks Bucking the Selling Pressure
by Arthur Hill,
Chief Technical Strategist, TrendInvestorPro.com
Stocks were hit hard on Thursday and Friday with most closing down sharply. There were a few gainers amongst the carnage and chartists can use the MarketCarpet to find such stocks. First, note that the S&P 500 was down 3.26% on Thursday-Friday and down .34% for the...
READ MORE
MEMBERS ONLY
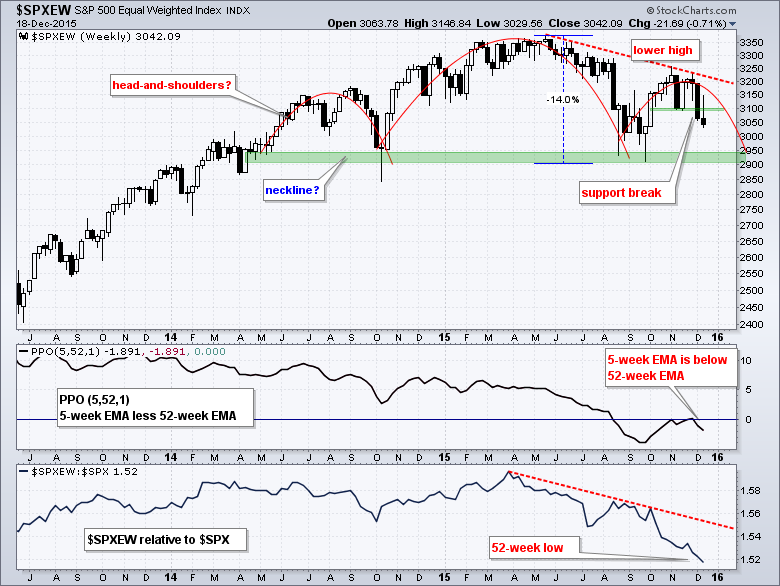
Equal-weight SPX Leads the Way with Big Bearish Pattern
by Arthur Hill,
Chief Technical Strategist, TrendInvestorPro.com
The S&P 500 Equal-Weight Index ($SPXEW) continues to underperform the market-cap weighted S&P 500 and its downtrend resumed with a break down in mid November. On the price chart, the index broke below its mid November low with a long black candlestick, made an attempt to...
READ MORE
MEMBERS ONLY
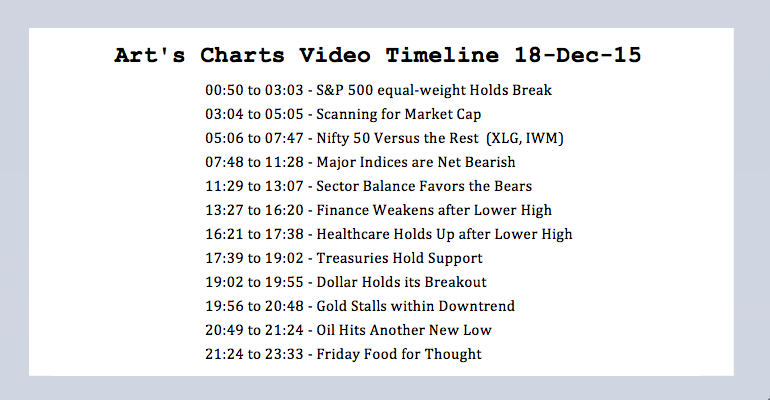
Weighing the Stock Market Evidence - Nifty Fifty Outperforms - Healthcare Holds
by Arthur Hill,
Chief Technical Strategist, TrendInvestorPro.com
S&P 500 equal-weight Holds Break // Nifty 50 Versus the Rest // Major Indices are Net Bearish // Sector Balance Favors the Bears // Finance Weakens after Lower High // Healthcare Holds Up after Lower High // Treasuries Hold Support and Uptrend // Dollar Holds its Breakout // Gold Stalls within Downtrend // Oil Hits Another New...
READ MORE
MEMBERS ONLY
Perfect Storm Gets Derailed - Bearish Engulfing Patterns Counter Punch
by Arthur Hill,
Chief Technical Strategist, TrendInvestorPro.com
Monday we saw a perfect storm come together for a short-term bounce. The S&P 500 was short-term oversold after a sharp decline, the index was near support from the mid November low and the seasonal patterns turned bullish on the 10th trading day of December. These items were...
READ MORE
MEMBERS ONLY
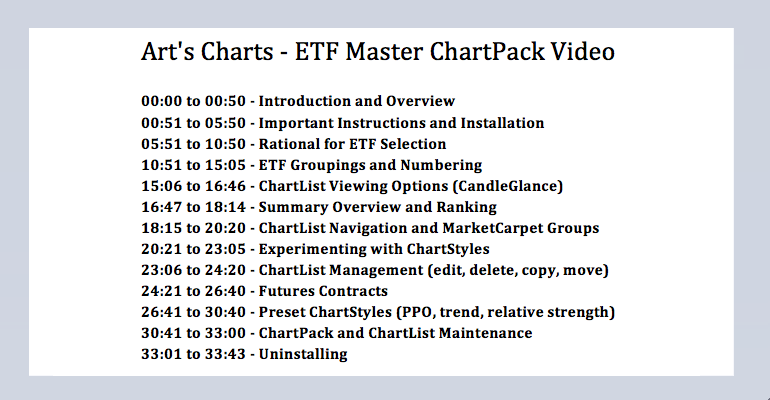
Take Your ETF Analysis to the Next Level with the ETF Master ChartPack
by Arthur Hill,
Chief Technical Strategist, TrendInvestorPro.com
Introduction and Overview // Important Instructions and Installation // Focus, Diversity and Passivity // ETF Sponsors // ETF Groupings and Numbering // ChartList Viewing Options (Summary, Candles, Carpets) // ChartStyles and Indicators // Final Thoughts and Installation Link //
Introduction and Overview
The ETF Master ChartPack contains over 300 ETFs sorted in a logical framework to enhance the...
READ MORE
MEMBERS ONLY
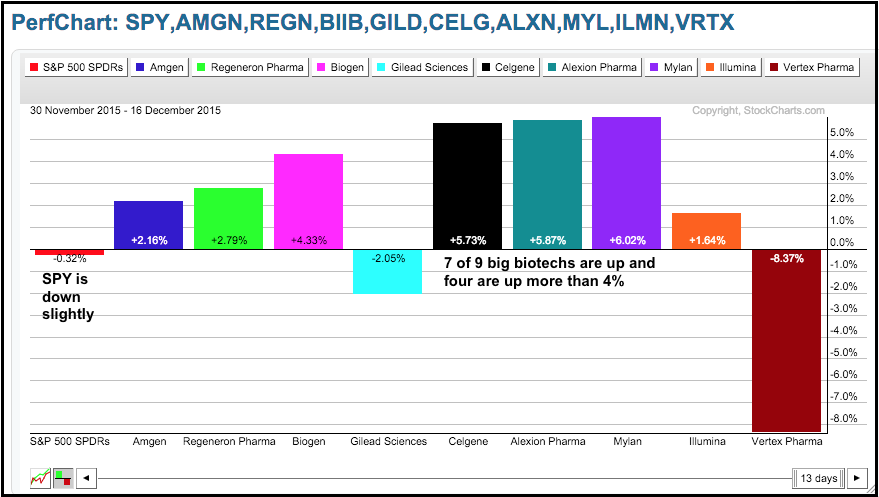
Big Biotechs Lead in December
by Arthur Hill,
Chief Technical Strategist, TrendInvestorPro.com
December got off to a rough start for the broader market, but several big biotechs bucked the selling pressure and moved higher. The Perfchart below shows December performance for SPY and the nine biggest biotechs in the Biotech iShares (IBB). SPY is down a fraction over this period and this...
READ MORE
MEMBERS ONLY
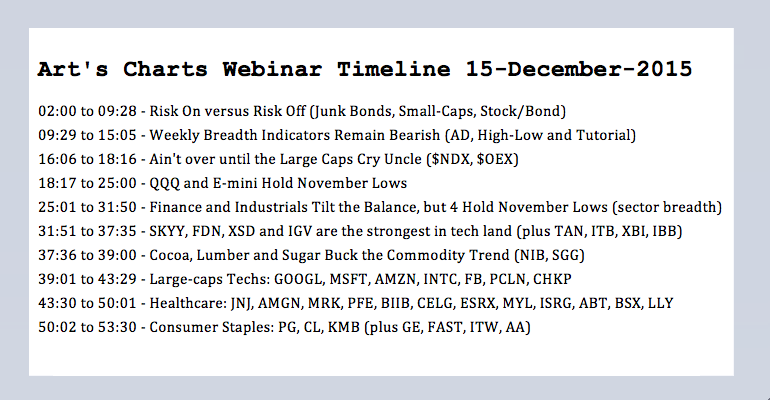
Emini Holds 2K - QQQ Still Leads - Weekly Breadth Indicators - Webinar Recording
by Arthur Hill,
Chief Technical Strategist, TrendInvestorPro.com
E-mini Tests 2000 Again // QQQ Holding above November Low // Small, Mids and Equals Extend Suffering // Weekly Breadth Indicators Remain Bearish // Finance and Industrials Tilt the Balance // Webinar Topics ////
Pockets of Strength?
The evidence for the broad stock market turned bearish last week and there are clearly some big pockets of...
READ MORE
MEMBERS ONLY
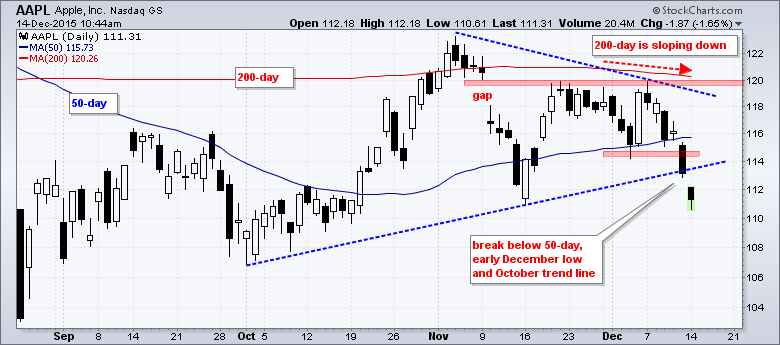
Apple Fails at One Moving Average and Breaks Another
by Arthur Hill,
Chief Technical Strategist, TrendInvestorPro.com
Apple shows signs of a long-term downtrend because it failed at a key long-term moving average and just broke a medium-term moving average. The daily candlestick shows AAPL gapping down in early November, trying to fill that gap with a bounce in mid November and ultimately failing with a peak...
READ MORE
MEMBERS ONLY
Finance Weighs - SPY/QQQ Trend Filters - Seasonality and Oversold Conditions
by Arthur Hill,
Chief Technical Strategist, TrendInvestorPro.com
Finance Weighs with Sharp Decline // SPY and QQQ Trend Filters Still Bullish // Seasonal Patterns Point to Bottom This Week // Mind the Gap and Short-term Downtrend ////
Finance Weighs with Sharp Decline
There were some medium-term and long-term bearish developments last week, but the stock market could bounce because it is short-term...
READ MORE
MEMBERS ONLY
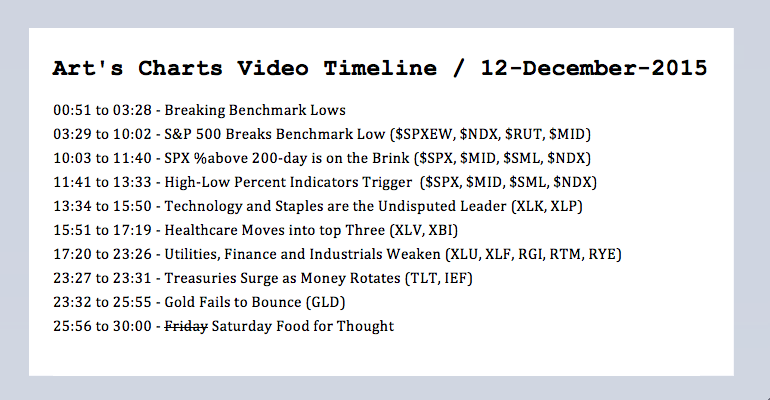
Breaking Benchmark Lows - Breadth Indicators Turn - Gold Fails to Bounce
by Arthur Hill,
Chief Technical Strategist, TrendInvestorPro.com
S&P 500 Breaks Benchmark Low // SPX %Above 200-day Is on the Brink // High-Low Percent Indicators Trigger // Technology is Undisputed Leader // Healthcare Moves into top Three // EW Consumer Discretionary Breaks Down // Treasuries Surge as Money Rotates // Gold Fails to Bounce // Friday Food for Thought ////
S&P 500 Breaks...
READ MORE
MEMBERS ONLY
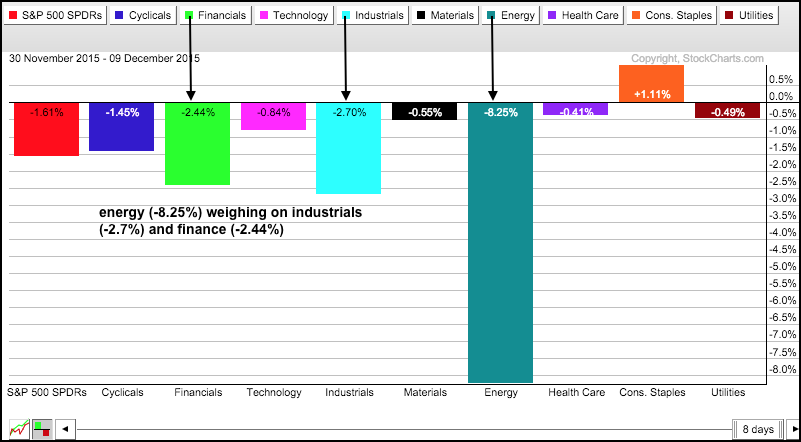
Energy Weighs on 2 Key Sectors - SPY Puts the PPO to the Test - 11 Stock Setups
by Arthur Hill,
Chief Technical Strategist, TrendInvestorPro.com
Energy Weighs on Two Key Sectors // SPY Puts the PPO to the Test // IWM Hits Moment-of-truth // Relative weakness in Small and Mid Caps Persists // XLF and RYF Tests November Lows // Regional Bank SPDR Breaks Support // XLI and RGI Exceed November Lows // Four Inside Days for IBB // Stocks of Interest (11)...
READ MORE
MEMBERS ONLY
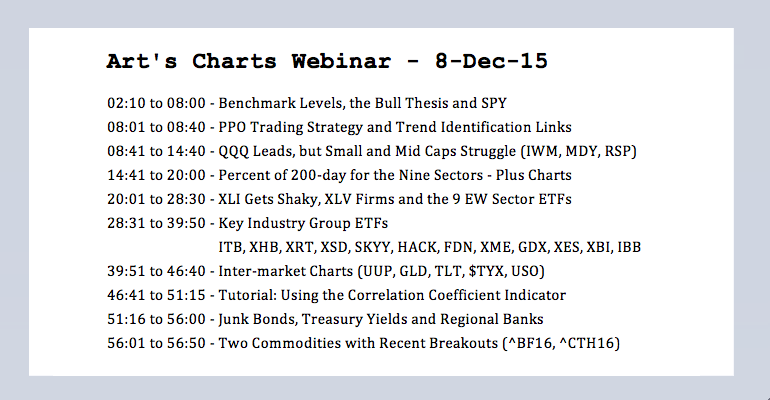
The One Key Level - Junk, Treasuries and Banks - %Above 200-day for Sectors
by Arthur Hill,
Chief Technical Strategist, TrendInvestorPro.com
The One Key Level // SPY Uptrend with Triangle // IWM Struggling, but above Key Support // Junk Bonds, Treasury Yields and Regional Banks // Percent of 200-day for the Nine Sectors // Webinar Preview ////
The One Key Level
Stocks are under pressure before the open and oil is getting the blame. While I hate...
READ MORE
MEMBERS ONLY
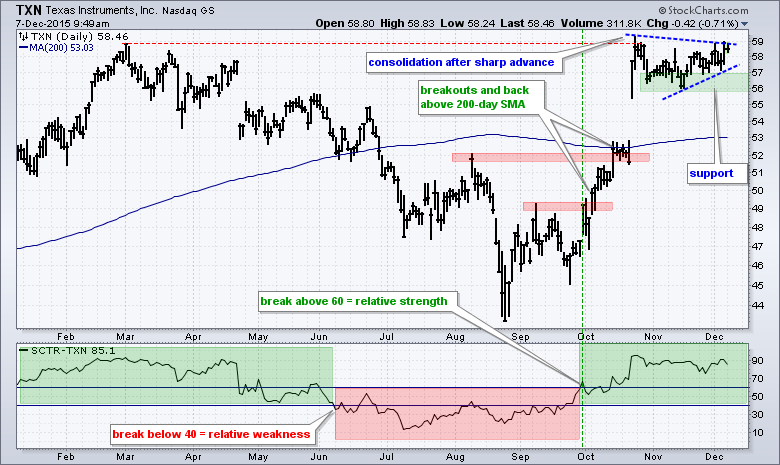
Texas Instruments Challenges Highs and Sports a Strong SCTR
by Arthur Hill,
Chief Technical Strategist, TrendInvestorPro.com
Texas Instruments (TXN) is leading the market with a strong StockCharts Technical Rank (SCTR) and the stock is consolidating near its 52-week high. TXN is part of the semiconductor industry group and the technology sector, both of which have been leading the market lately. On the price chart, TXN broke...
READ MORE
MEMBERS ONLY
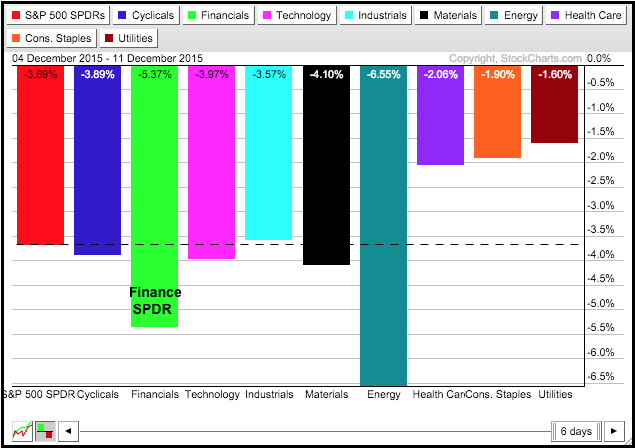
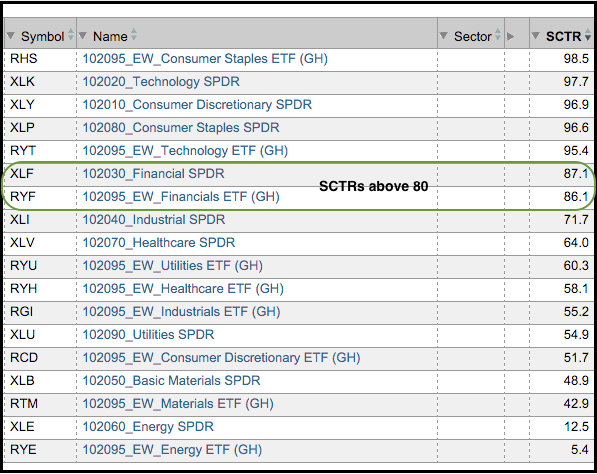
Finance Sector Comes to Life and Leads
by Arthur Hill,
Chief Technical Strategist, TrendInvestorPro.com
The finance sector is one of the stronger sectors right now and this is positive for the overall market. As the table below shows, the Finance SPDR (XLF) has the fourth highest StockCharts Technical Rank (SCTR) of the nine sector SPDRs and the EW Finance ETF (RYF) has the third...
READ MORE