MEMBERS ONLY
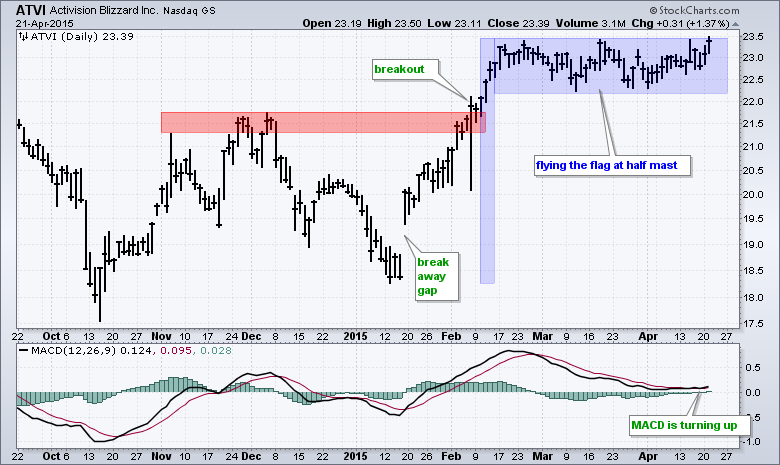
Activision Flies the Flag at Half-Mast
by Arthur Hill,
Chief Technical Strategist, TrendInvestorPro.com
Activision Blizzard (ATVI) sports a bullish continuation pattern and improving momentum. The stock gapped up in mid January and broke out in early February. ATVI was overbought after a 25% surge and worked off these overbought conditions with an extended flag. I say extended because eight weeks is getting long...
READ MORE
MEMBERS ONLY
SPY Gaps Back Up, TLT and GLD Stall
by Arthur Hill,
Chief Technical Strategist, TrendInvestorPro.com
Stocks surged on Monday and recovered most of Friday's losses. The S&P 500 moved back above 2100 in the first hour (+1%) and then consolidated the rest of the day. The consumer discretionary, technology, industrials and utilities sectors led with 1+ percent gains. Internet, software, semiconductor...
READ MORE
MEMBERS ONLY
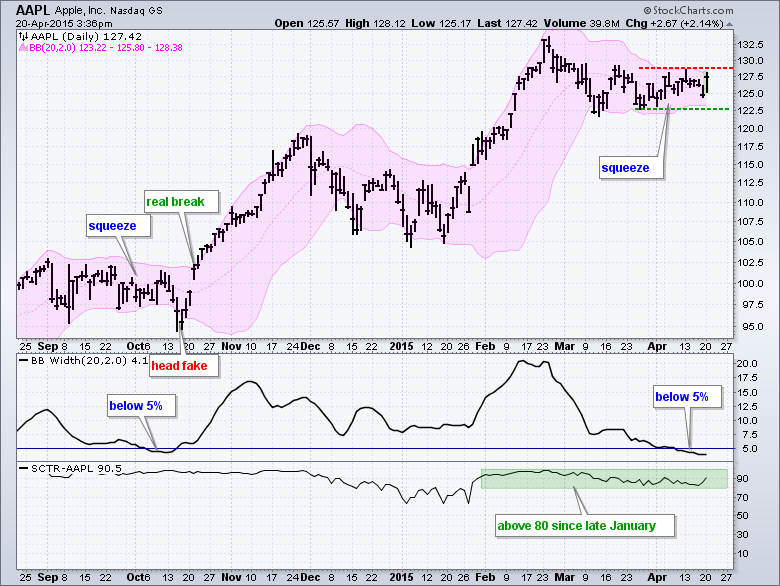
Apple Gets a Volatility Squeeze
by Arthur Hill,
Chief Technical Strategist, TrendInvestorPro.com
Trading in Apple has turned dull over the last six weeks as the stock moves in a tightening consolidation. The volatility contraction can be seen by the Bollinger Bands, which contracted to their narrowest since October. Notice that BandWidth moved below 5%. Also notice that the October squeeze featured a...
READ MORE
MEMBERS ONLY
SPY and QQQ Reverse Upswings - TLT Surges
by Arthur Hill,
Chief Technical Strategist, TrendInvestorPro.com
Stocks meandered from Monday to Thursday and then got pummeled on Friday. There were two bouts of selling pressure that lasted less than two hours in total. The S&P 500 declined sharply on the open (45 minutes), firmed and then fell another ten points in the early afternoon...
READ MORE
MEMBERS ONLY
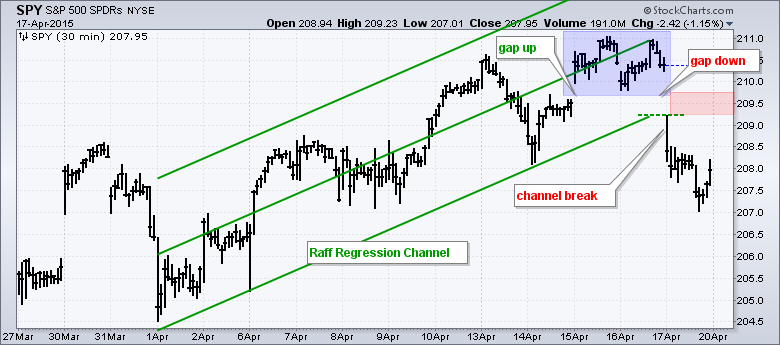
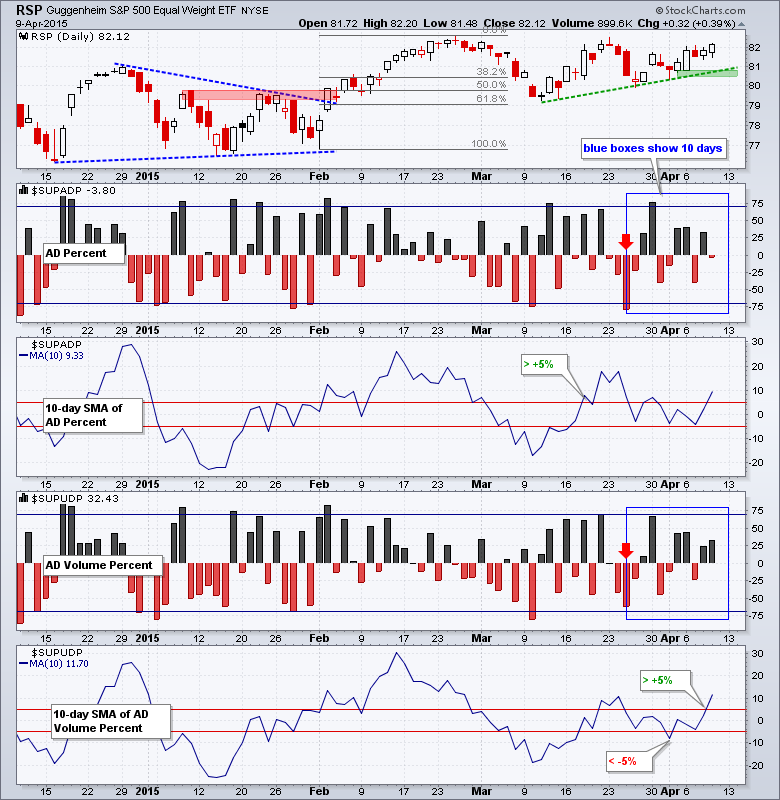
Separating the Short Term Island from the Long Term Trend
by Arthur Hill,
Chief Technical Strategist, TrendInvestorPro.com
With a gap up and a gap down, the S&P 500 SPDR (SPY) formed an island reversal over the last four days. This is short-term bearish, but not enough to affect the longer trend, which is still up. To emphasize the short-term nature of this reversal, I am...
READ MORE
MEMBERS ONLY
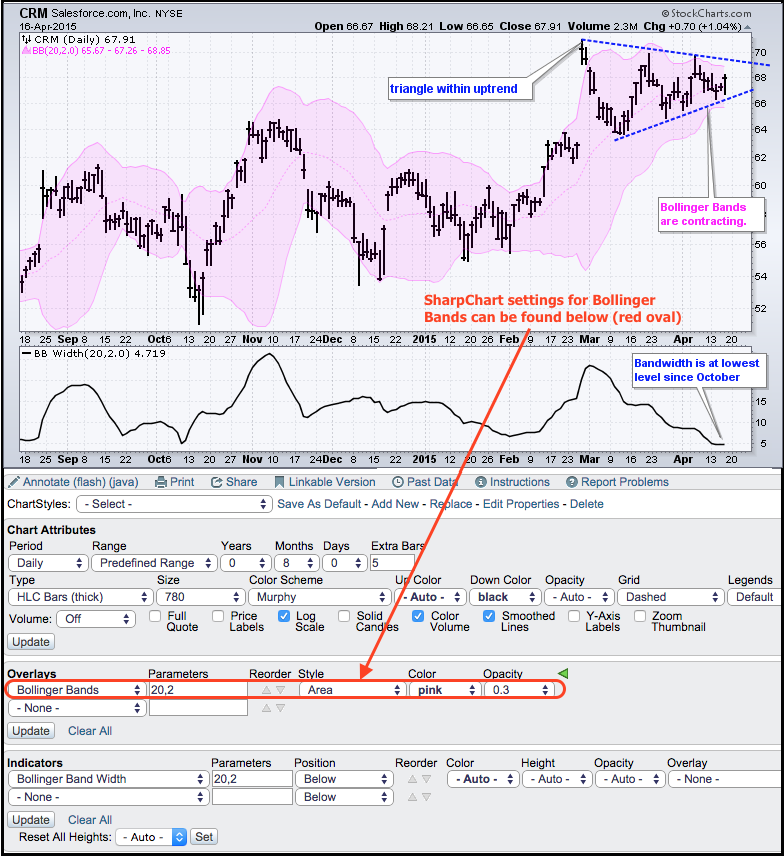
Salesforce.com Winds up for the Pitch
by Arthur Hill,
Chief Technical Strategist, TrendInvestorPro.com
After surging to new highs in February, Salesforce.com moved into a consolidation as volatility contracted. Notice that the Bollinger Bands narrowed over the last few weeks the BandWidth moved to its lowest level since mid October. Even though a volatility contraction does not give us directional clues, the stock...
READ MORE
MEMBERS ONLY
TLT Tests Key Support - GLD Stalls Near Support
by Arthur Hill,
Chief Technical Strategist, TrendInvestorPro.com
Stocks meandered on Thursday as the S&P 500 started negative, moved into positive territory and then finished slightly negative. The major index ETFs ended mixed with fractional gains in DIA and the Russell MicroCap iShares (IWC), but fractional losses in QQQ and IWM. The sectors were also mixed...
READ MORE
MEMBERS ONLY
IWM Hits New High - TLT Toys with Support
by Arthur Hill,
Chief Technical Strategist, TrendInvestorPro.com
Stocks gained ground on Wednesday with the major index ETFs posting modest gains. The Russell 2000 iShares (IWM) led the way with a .70% gain and a new high. The Energy SPDR (+2.4%), Materials SPDR (+1%) and Technology SPDR (.9%) led the sector SPDRs. The tech sector got a...
READ MORE
MEMBERS ONLY
Tightening Support for SPY and QQQ - GLD Breaks Trend Line
by Arthur Hill,
Chief Technical Strategist, TrendInvestorPro.com
Stocks finished the day mixed with not a lot going on in the market. QQQ and IWM edged lower, while DIA and SPY edged higher. And I do mean "edged" because the gains and losses were minimal. Energy was the stand out performer in an otherwise lackluster day....
READ MORE
MEMBERS ONLY
SPY Backs off Range Resistance - TLT Tests Support
by Arthur Hill,
Chief Technical Strategist, TrendInvestorPro.com
Stocks did the old pop and drop on Monday. The S&P 500 surged above 2105 on the open, peaked in the first hour and worked its way to the 2092 level by the close. It was a rather orderly decline. Small-caps bucked the selling pressure as IWM finished...
READ MORE
MEMBERS ONLY
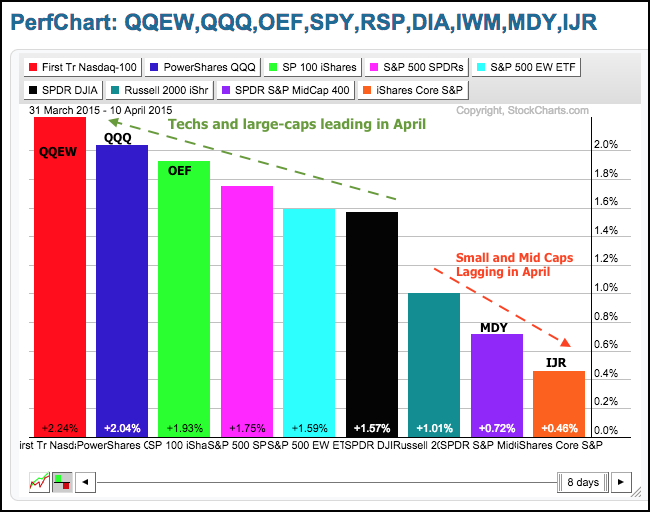
Techs and Large-Caps Take the Lead in April
by Arthur Hill,
Chief Technical Strategist, TrendInvestorPro.com
The performance pecking order changed in April as large-caps and techs moved from under performers to out performers. Even though small-caps and mid-caps are underperforming so far in April, they are still outperforming on a longer timeframe (since early February). The PerfChart below shows month-to-date performance for nine major index...
READ MORE
MEMBERS ONLY
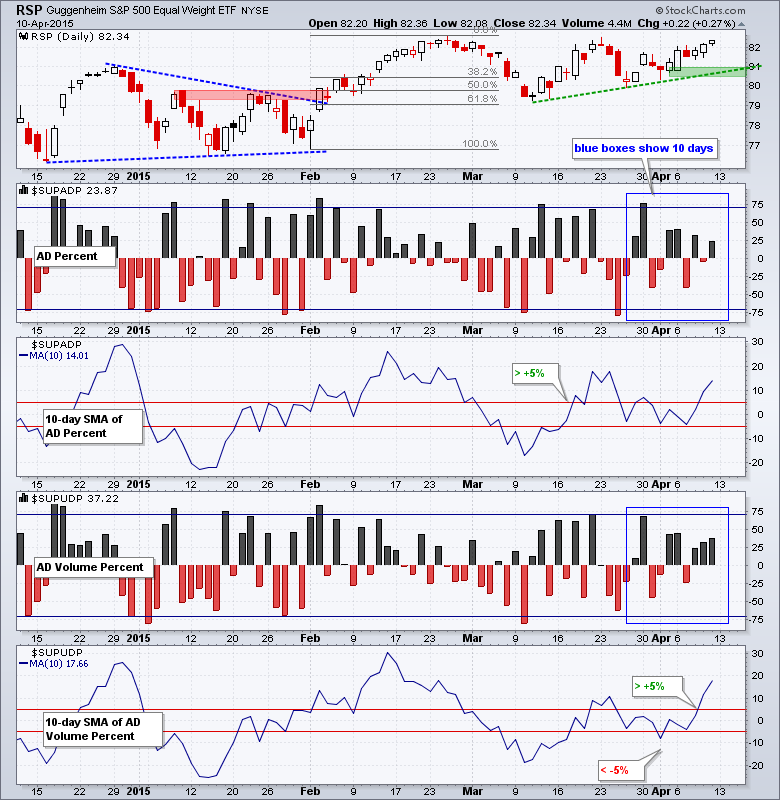
IWM Nears March High - USO and GLD Hold Upswings
by Arthur Hill,
Chief Technical Strategist, TrendInvestorPro.com
Stocks finished strong on Friday and ended the week with modest gains. QQQ led the way with a 2.5% advance and is also the strongest for April. IWM and MDY lagged because they gained less than 1%. Industrials, energy, healthcare and technology led the sectors last week. Healthcare was...
READ MORE
MEMBERS ONLY
SPY and QQQ Close Strong - UUP Gets a Breakout
by Arthur Hill,
Chief Technical Strategist, TrendInvestorPro.com
Stocks started weak, but quickly found their footing and moved higher. SPY and QQQ led and closed at their highest levels of the month. Small-caps lagged as IWM and IJR closed slightly lower. Eight of the nine sectors were up with the Energy SPDR (XLE) as the only standout performer...
READ MORE
MEMBERS ONLY
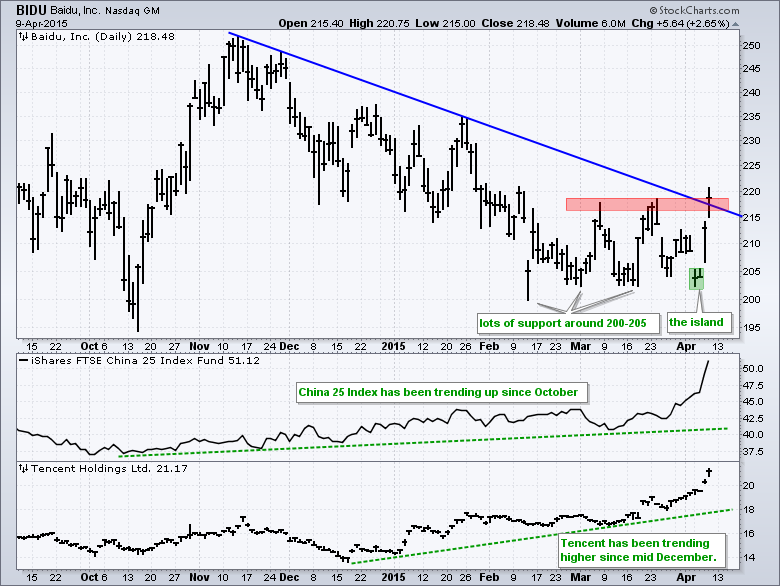
Baidu Plays Catch Up with an Island Reversal
by Arthur Hill,
Chief Technical Strategist, TrendInvestorPro.com
Julius de Kempenaer noted the surge in Chinese stocks in his most recent RRG post and Tom Bowley noted the breakout in SouFun in a blog post on Wednesday. I will add a third China-related post to the mix by pointing out Baidu. Chinese stocks have been on a tear...
READ MORE
MEMBERS ONLY
EW Finance Forms Bear Flag - SPY and QQQ Hit Resistance
by Arthur Hill,
Chief Technical Strategist, TrendInvestorPro.com
Stocks meandered all day and finished slightly higher. QQQ (+.79%) and IWM (+86%) led the bounce with modest gains. SPY (+.34%) and DIA (+.18%) lagged. Seven of the nine sector SPDRs were up, but the gains and losses were small. Biotechs led the industry group ETFs as the Biotech SPDR...
READ MORE
MEMBERS ONLY
SPY Fails at Prior High - UUP Surges off Retracement
by Arthur Hill,
Chief Technical Strategist, TrendInvestorPro.com
Stocks surged on Monday morning and plunged on Tuesday afternoon. The S&P 500 is still up over the last two days, but Tuesday's final hour sell off could foreshadow a tougher trading environment ahead. Small-caps and mid-caps led the selloff as IWM lost .64% and MDY...
READ MORE
MEMBERS ONLY
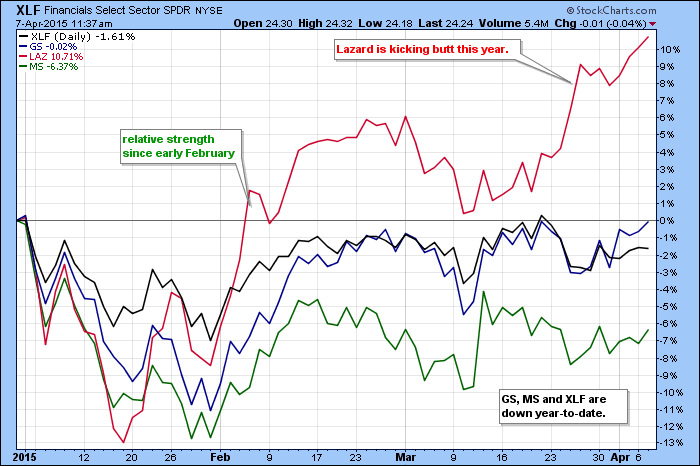
Lazard Leaves MS and GS in the Dust
by Arthur Hill,
Chief Technical Strategist, TrendInvestorPro.com
Lazard (LAZ) has left Goldman Sachs (GS) and Morgan Stanley (MS) in the dust by outperforming these two behemoths since early February. The SharpChart below shows year-to-date performance for these three stocks and the Finance SPDR (XLF). GS is near break even for the year, MS is down over 6%...
READ MORE
MEMBERS ONLY
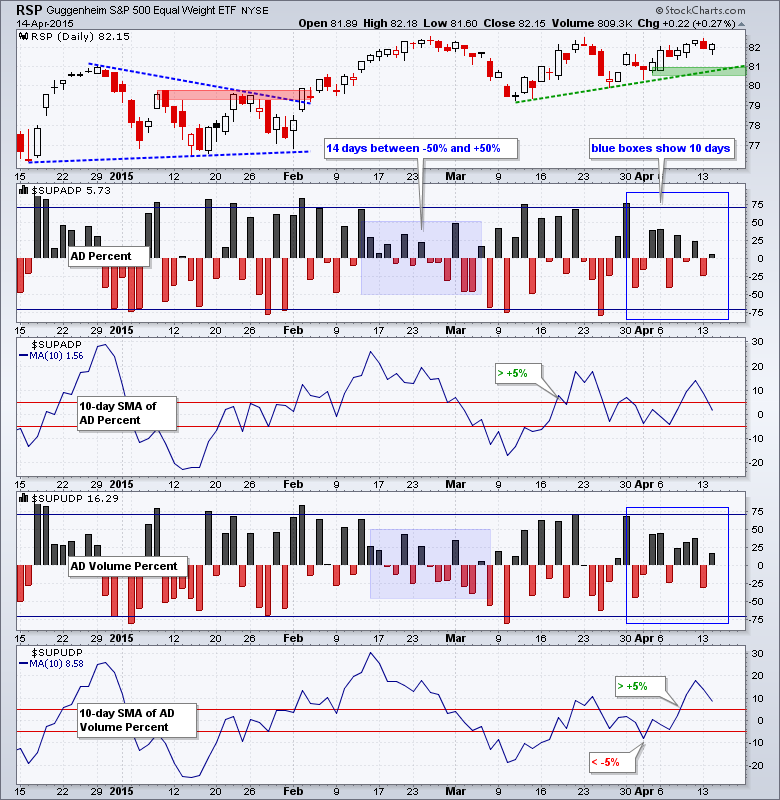
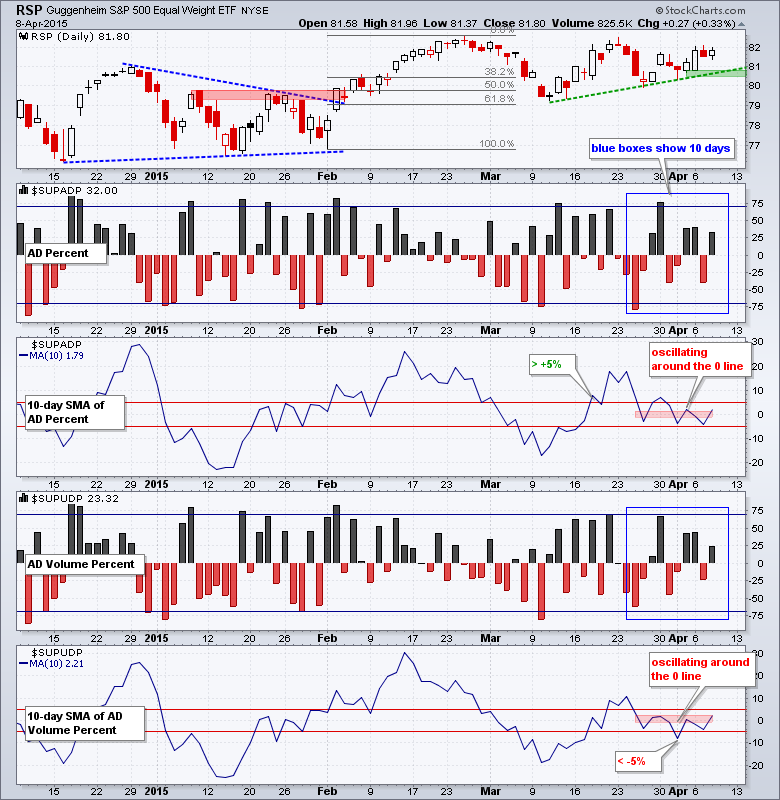
Stocks Bounce, but with Uninspiring Breadth
by Arthur Hill,
Chief Technical Strategist, TrendInvestorPro.com
Note that I will be doing a webinar today at 1PM ET (Tuesday, April 7th). I will cover market breadth, gold, oil, the dollar and some stock setups. Click here to register. Stocks shrugged off the miss in non-farm payrolls on Friday and surged in early trading on Monday. The...
READ MORE
MEMBERS ONLY
Stocks Sink as Bonds Surge - GLD and USO Tests Resistance
by Arthur Hill,
Chief Technical Strategist, TrendInvestorPro.com
It was a rather strange week for stocks. DIA and SPY were up around .50% as of Thursday's close, but Friday's decline in stock futures wiped out this small gain and they ended the week slightly negative - for all intents and purposes. IWM was up...
READ MORE
MEMBERS ONLY
Why is Price Action So Important?
by Arthur Hill,
Chief Technical Strategist, TrendInvestorPro.com
Technical analysis cuts to the chase by showing us the only thing that matters: price. Even those using fundamental analysis can benefit from technical analysis because we only make money when prices move in the desired direction. Here are four ways technical analysis can improve your investment returns.
1. All...
READ MORE
MEMBERS ONLY
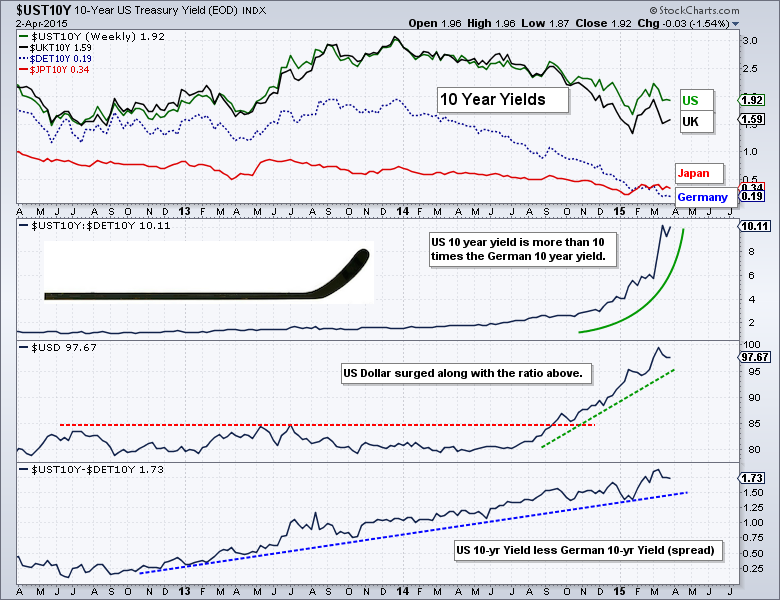
10-yr Yields, the Hockey Stick and the Dollar
by Arthur Hill,
Chief Technical Strategist, TrendInvestorPro.com
The Dollar Index has been on a tear the last four months as the spread between the 10-YR Treasury Yield ($UST10Y) and German 10-YR Bund Yield ($DET10Y) widened to historic levels. The chart below shows 10-yr yields for four countries in the top window. US and UK yields are by...
READ MORE
MEMBERS ONLY
TLT Surges off Support - GLD Bounces to Resistance
by Arthur Hill,
Chief Technical Strategist, TrendInvestorPro.com
Stocks were lower most of the day, but rallied in the final fifteen minutes to cut their losses. SPY closed with a small loss and IWM closed with a fractional gain. The sector SPDRs did not move much either. Healthcare was the big loser with a 1% decline. Utilities bucked...
READ MORE
MEMBERS ONLY
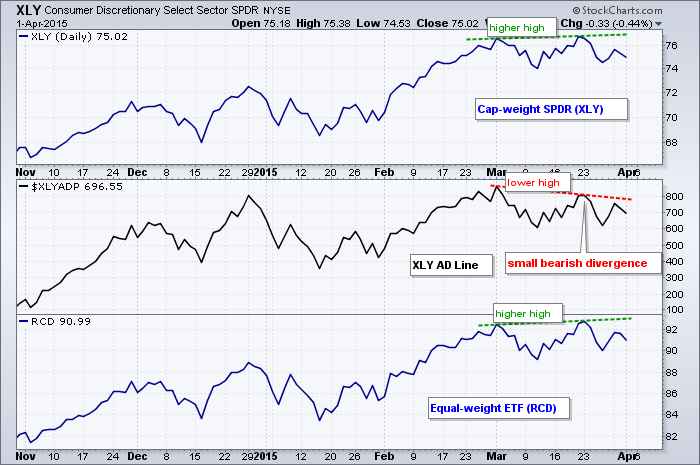
XLY Breadth Indicator Forms Bearish Divergence
by Arthur Hill,
Chief Technical Strategist, TrendInvestorPro.com
The Consumer Discretionary SPDR (XLY) is perhaps the single most important sector in the stock market because it is the most economically sensitive sector. Industry groups in this sector include retail, restaurants, autos, media and home construction. XLY is weighted by market cap and reflects the performance of the large-caps...
READ MORE
MEMBERS ONLY
SPY Moves into Gap - USO Holds Break
by Arthur Hill,
Chief Technical Strategist, TrendInvestorPro.com
Stocks were mostly lower on Tuesday. The S&P 500 opened lower, stalled for a few hours and then moved lower again in the final hour. Large-caps led the way, while small-caps fell fractionally and showed relative strength again. Eight of the nine sector SPDRs were down with the...
READ MORE
MEMBERS ONLY
SPY Surges off Support - IWM Leads - GLD Breaks
by Arthur Hill,
Chief Technical Strategist, TrendInvestorPro.com
Stocks surged with a broad-based rally that lifted most boats. The major index ETFs were up over 1% with the Dow Diamonds (+1.46%) leading. All sector SPDRs were up over 1% with the Energy SPDR (+2.15%) leading. All small-caps sector ETFs were up with the SmallCap Consumer Staples...
READ MORE
MEMBERS ONLY
SPY Hits Range Support - Dollar Hits Key Retracement
by Arthur Hill,
Chief Technical Strategist, TrendInvestorPro.com
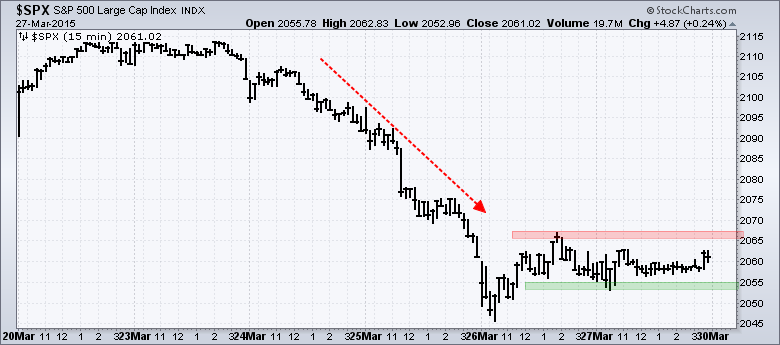
Stocks got slammed on Tuesday-Wednesday and firmed on Thursday-Friday. The S&P 500 fell from the 2110 area to the 2050 area and then moved into a rather tight trading range in the 2060 area. The resolution of this trading range could provide the next short-term signal. Either another...
READ MORE
MEMBERS ONLY
Short-Term Trend, Breadth and Intermarket Analysis
by Arthur Hill,
Chief Technical Strategist, TrendInvestorPro.com
I am on the road Thursday-Friday so this update will be brief. All the charts have been updated. For what it is worth, I am attending the MTA symposium in New York. The bulk of the short-term evidence turned bearish with Wednesday's decline and remains bearish. The bigger...
READ MORE
MEMBERS ONLY
Short-Term Trend, Breadth and Intermarket Analysis
by Arthur Hill,
Chief Technical Strategist, TrendInvestorPro.com
Stocks were hit with broad selling pressure and fell sharply on Wednesday. QQQ and IWM led the way lower with 2+ percent declines. Eight of the nine sectors were down with techs leading the way. Energy stocks bucked the selling pressure as crude bounced. Techs were hit with heavy selling...
READ MORE
MEMBERS ONLY
Short-Term Trend, Breadth and Intermarket Analysis
by Arthur Hill,
Chief Technical Strategist, TrendInvestorPro.com
Trading was mixed again on Tuesday. Selling pressure hit SPY, QQQ and MDY, but IJR and IWM finished slightly positive. The finance and utilities sectors led the way lower. The Home Construction iShares (ITB) and Home Builders SPDR (XHB) bucked the selling pressure and finished with nice gains. The Retail...
READ MORE
MEMBERS ONLY
Short-Term Trend, Breadth and Intermarket Analysis
by Arthur Hill,
Chief Technical Strategist, TrendInvestorPro.com
Stocks traded flat most of the day on Monday and then got hit with some selling pressure in the final ten minutes and the major index ETFs closed slightly lower. The sectors were mixed with some modest selling pressure hitting the Industrials SPDR (XLI) and the Finance SPDR (XLF). The...
READ MORE
MEMBERS ONLY
Short-Term Trend, Breadth and Intermarket Analysis
by Arthur Hill,
Chief Technical Strategist, TrendInvestorPro.com
Stocks finished the week strong with QQQ, MDY and IWM leading the way. Large-caps also finished strong as the Dollar fell. Eight of the nine sectors finished higher. The Materials SPDR (XLB) was the only sector to finish lower on the week and show relative weakness. Regional Banks showed relative...
READ MORE
MEMBERS ONLY
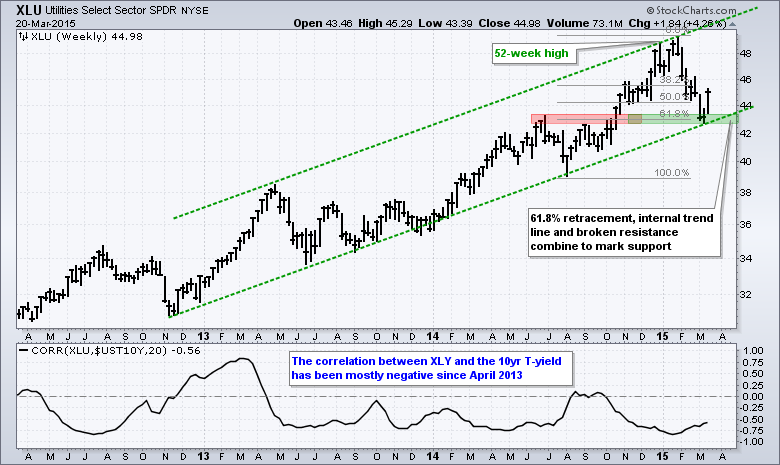
Utilities Get their Mojo Back
by Arthur Hill,
Chief Technical Strategist, TrendInvestorPro.com
It was a big week for Treasury bonds, the 10-YR Treasury Yield and the Utilities SPDR. XLU fell sharply as yields surged in February, but rebounded this week as Treasury yields fell. Overall, the big trend for XLU appears to be up with a series of higher highs and higher...
READ MORE
MEMBERS ONLY
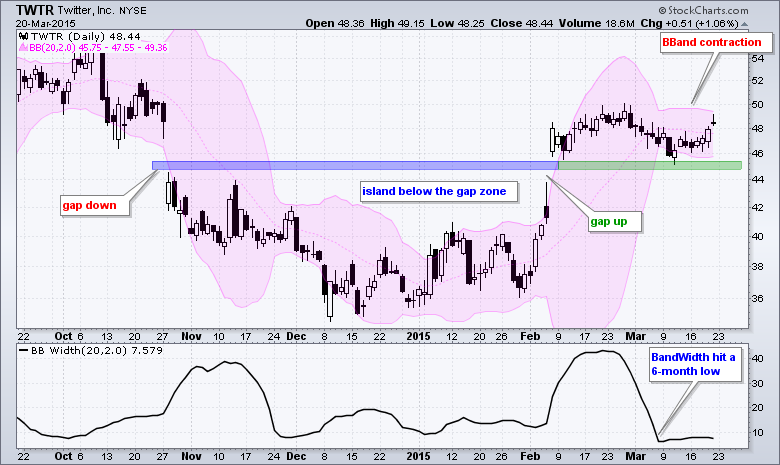
A Tweet-Worthy Island Reversal and Squeeze
by Arthur Hill,
Chief Technical Strategist, TrendInvestorPro.com
Even though the pattern is a bit big, the gaps fit and it looks like Twitter (TWTR) traced out a large island reversal from late October to early February. The stock gapped below 45, traded below this gap for a few months and then gapped above 45. The result is...
READ MORE
MEMBERS ONLY
Short-Term Trend, Breadth and Intermarket Analysis
by Arthur Hill,
Chief Technical Strategist, TrendInvestorPro.com
Stocks were mixed on Thursday. QQQ and IWM closed fractionally higher, but SPY and DIA edged lower. Finance weighed on the market as the Finance SPDR (XLF) lost .93%. The Materials SPDR (XLB) and Energy SPDR (XLE) were also weak with declines greater than 1.5%. Pretty much anything oil-related...
READ MORE
MEMBERS ONLY
Short-Term Trend, Breadth and Intermarket Analysis
by Arthur Hill,
Chief Technical Strategist, TrendInvestorPro.com
Is it volatile enough for ya? The S&P 500 fell to the 2062 area in the early afternoon (down around 14 points) and then shot higher with a move above 2105. The move from low to high was around 45 points and the index closed up 1.22%...
READ MORE
MEMBERS ONLY
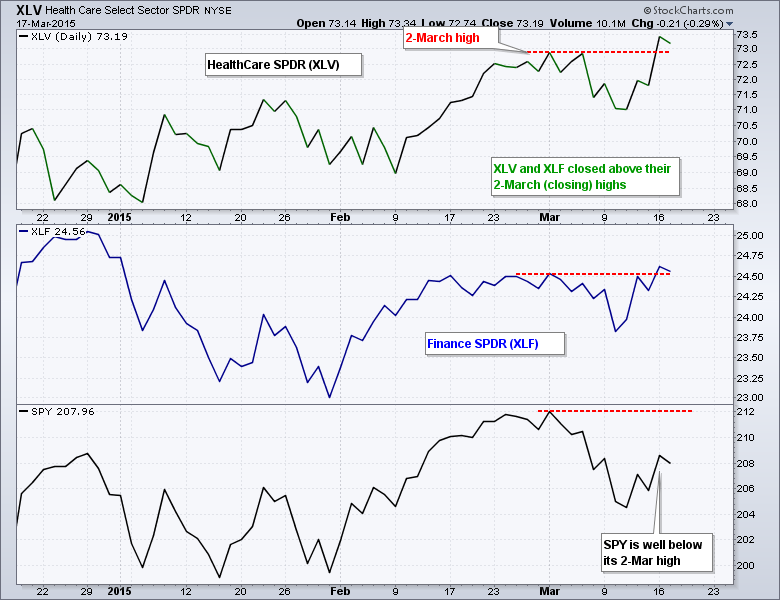
The Two Strongest Sectors in March Are....
by Arthur Hill,
Chief Technical Strategist, TrendInvestorPro.com
There are several ways to measure relative performance here at StockCharts. Chartists can use ratio charts (XLF:SPY), the StockCharts Technical Rank (SCTR) or Relative Rotation Graphs (RRGs). Chartists can also compare the respective price charts. The chart below shows closing prices for the HealthCare SPDR (XLV), Finance SPDR (XLF)...
READ MORE
MEMBERS ONLY
Short-Term Trend, Breadth and Intermarket Analysis
by Arthur Hill,
Chief Technical Strategist, TrendInvestorPro.com
Stocks were mixed on Tuesday with large-caps closing lower and small-caps edging higher. Eight of the nine sector SPDRs were down with materials falling 1.11%. Energy shares were also weak. The Home Construction iShares (ITB) fell after housing starts disappointed, but ITB remains in an uptrend overall. Gold fell...
READ MORE
MEMBERS ONLY
SPY Gets a Break Out - USO Sinks to New Lows
by Arthur Hill,
Chief Technical Strategist, TrendInvestorPro.com
Stocks got their mojo back as the S&P 500 opened strong, stayed strong and finished at the high of the day. The large-cap indices led the move with 1+ percent gains. Small-caps lagged as IWM gained only .59%. Seven of the nine sectors were strong. Energy stocks were...
READ MORE
MEMBERS ONLY
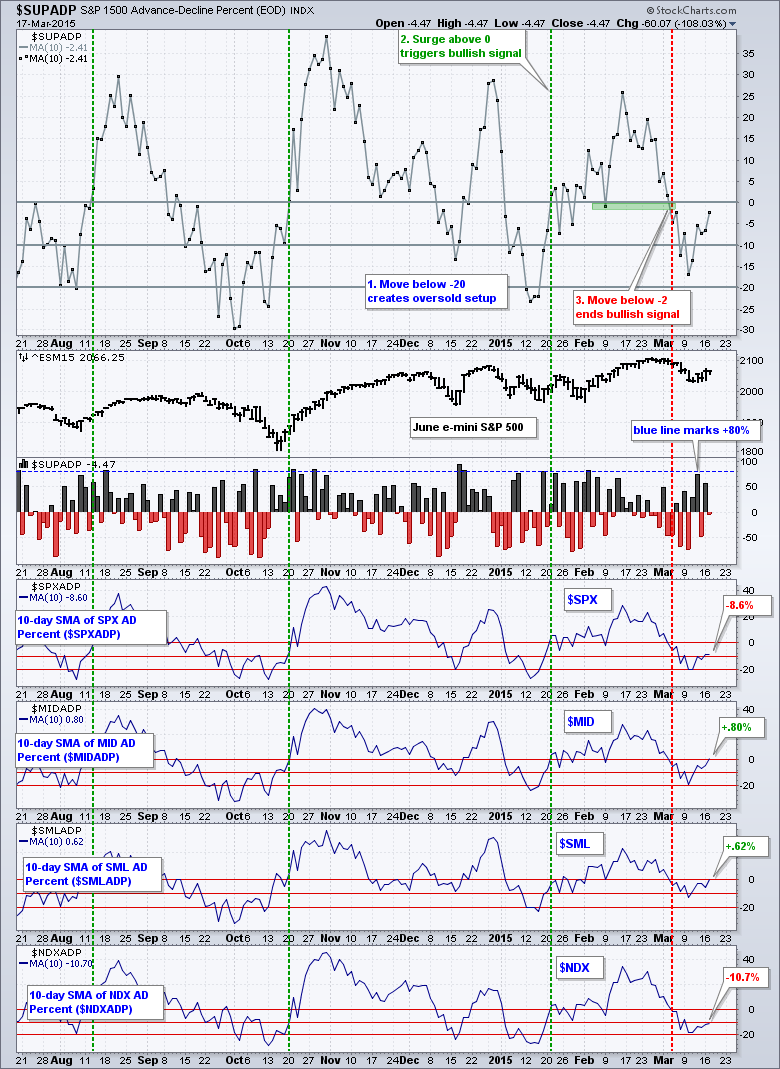
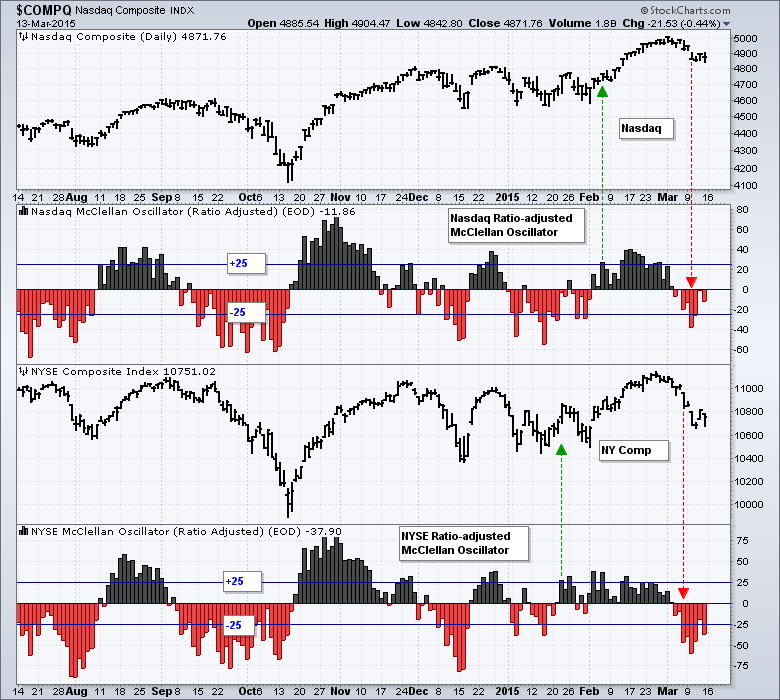
McClellan Oscillators Remain Negative
by Arthur Hill,
Chief Technical Strategist, TrendInvestorPro.com
The NYSE McClellan Oscillator ($NYMO) turned negative on March 4th and moved below -25 on March 6th, while the Nasdaq McClellan Oscillator ($NAMO) also turned negative on March 4th, but did not move below -25 until March 10th (red arrows). As these charts show, chartists can use crosses of the...
READ MORE
MEMBERS ONLY
IWM Holds Breakout, SPY Backs Off and TLT Hits Moment of Truth
by Arthur Hill,
Chief Technical Strategist, TrendInvestorPro.com
It was a very mixed week for stocks as QQQ lost around 2% and IWM gained 1.19%. Small-caps continue to lead in relative strength this year. A strong Dollar is helping the small-cap cause and hurting big multinationals. Renewed strength in the finance sector is also helping small-caps. Keep...
READ MORE