MEMBERS ONLY
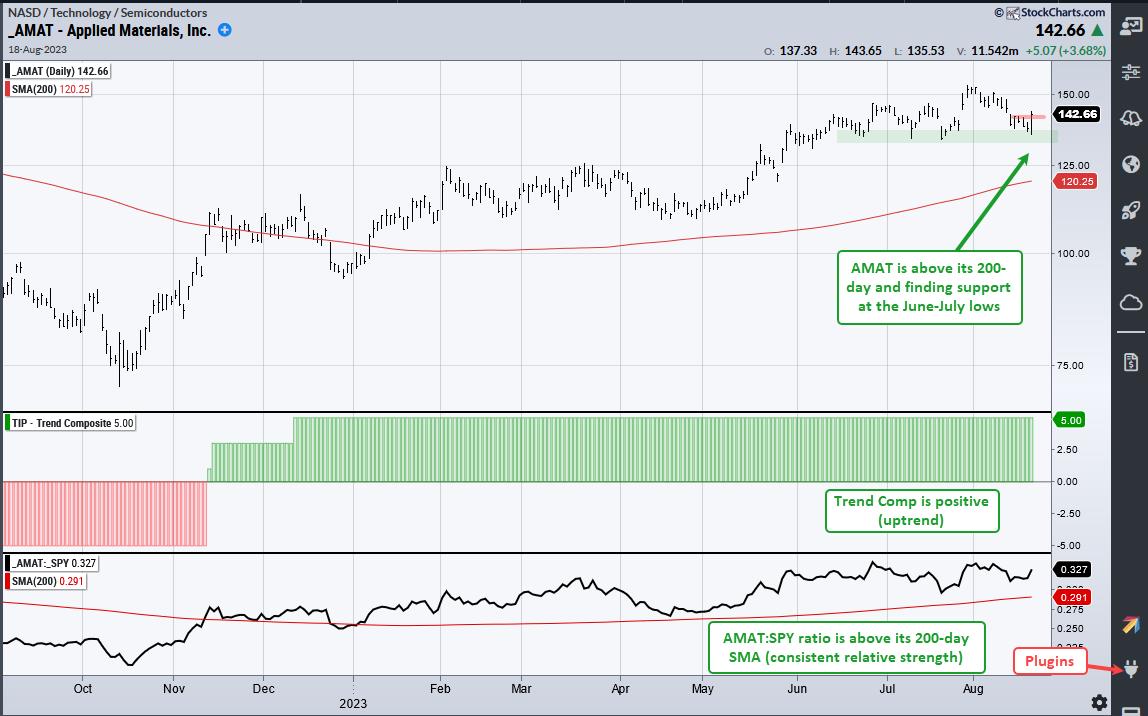
A Nasdaq 100 Stock Showing Relative Strength in August
by Arthur Hill,
Chief Technical Strategist, TrendInvestorPro.com
Stocks were hit hard in August with QQQ leading the way lower and breaking its July low. Stocks that did not break their July lows are holding up better and showing relative strength. These are the stocks I want on my WatchList for tradable pullbacks and short-term breakouts. AMAT is...
READ MORE
MEMBERS ONLY
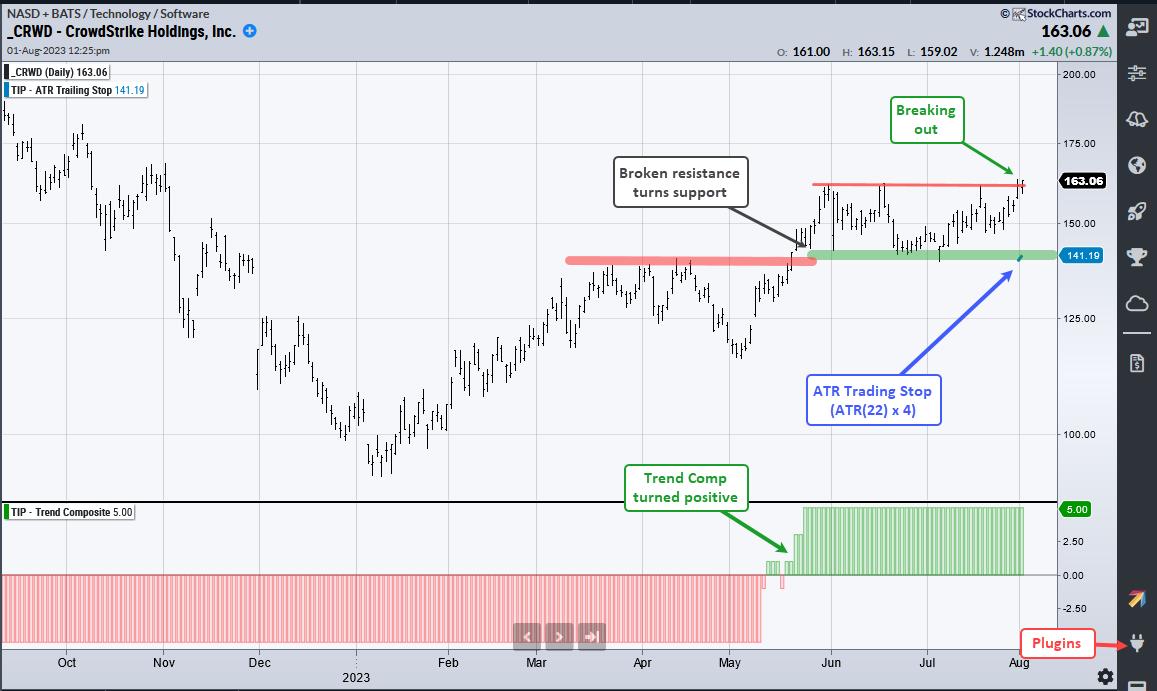
CrowdStrike Shows Strength and Leadership with Breakout
by Arthur Hill,
Chief Technical Strategist, TrendInvestorPro.com
CrowdStrike (CRWD) is separating itself from the rest of the pack with a breakout and nine month high.
The chart below shows CRWD with an uptrend working throughout 2023. The stock bottomed in January, advanced to the 140 area and hit resistance here in March-April (thick red line). The stock...
READ MORE
MEMBERS ONLY
Cisco Takes the Lead with a Classic Bullish Continuation Pattern
by Arthur Hill,
Chief Technical Strategist, TrendInvestorPro.com
Cisco (CSCO) is showing leadership qualities again as it breaks out of a classic bullish continuation pattern and hits a new high.
The chart below shows CSCO forming a cup-with-handle pattern, which was popularized by William O'Neil of IBD. This is a bullish continuation pattern, which means the...
READ MORE
MEMBERS ONLY
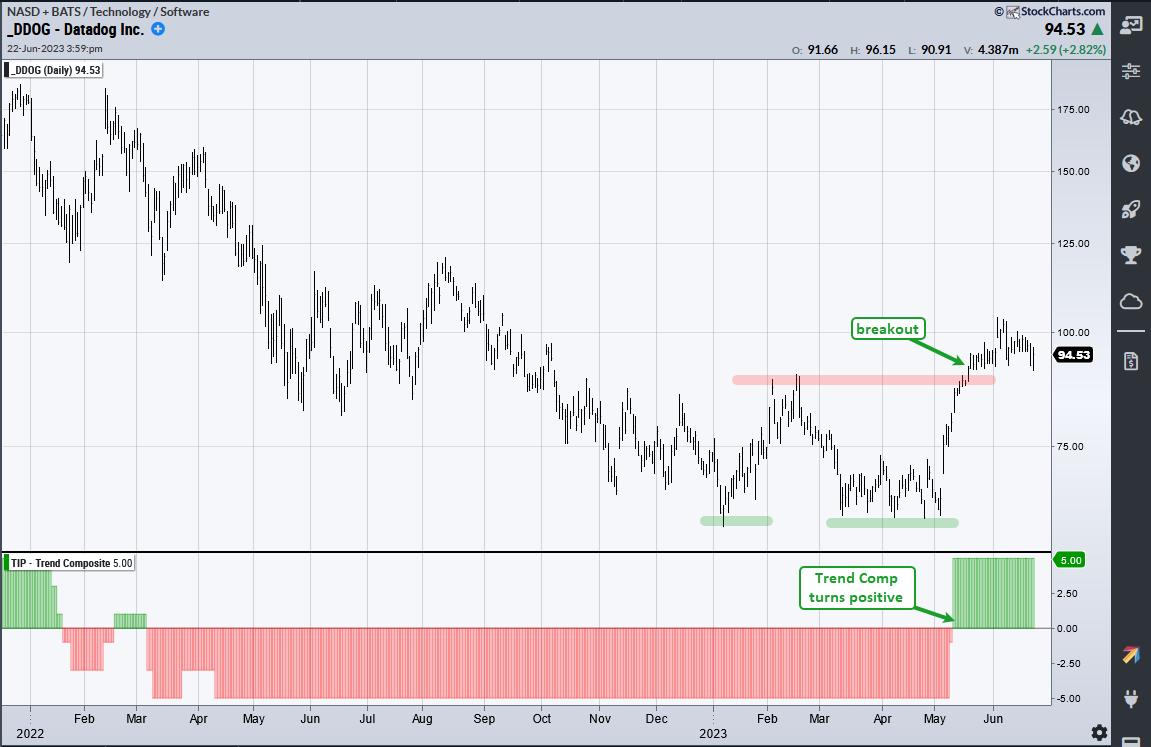
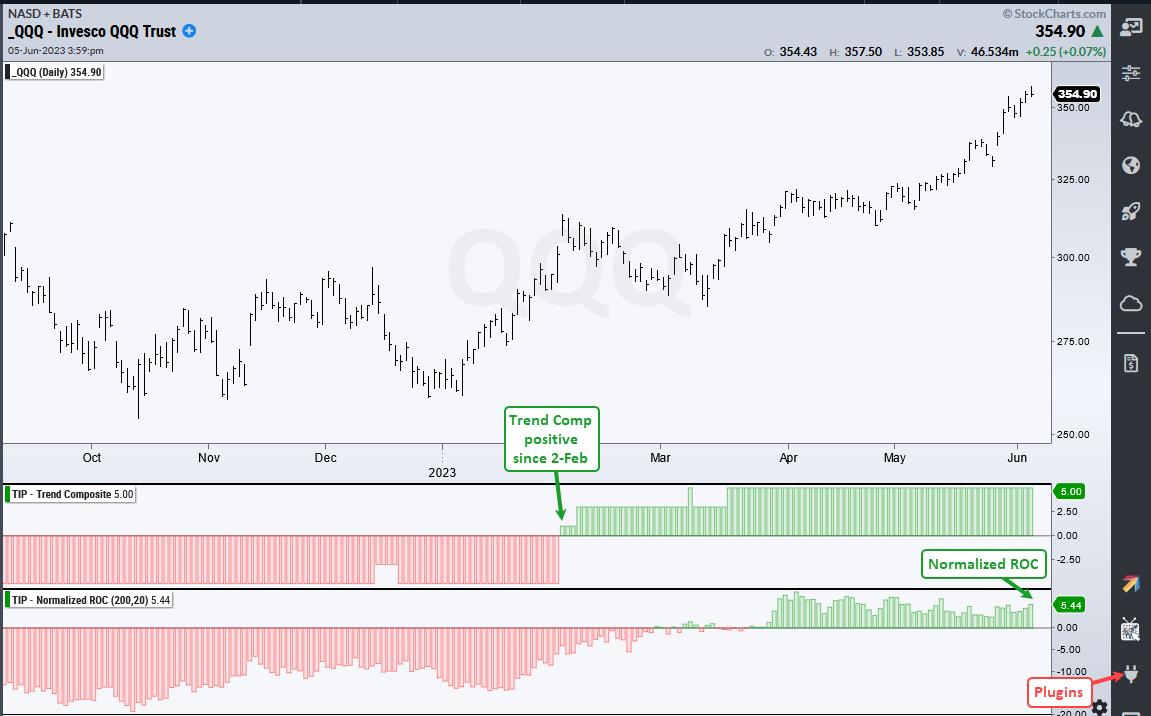
Chart and Trend Signals Align for Datadog
by Arthur Hill,
Chief Technical Strategist, TrendInvestorPro.com
It does not always happen, but sometimes the indicator and chart signals align to send a powerful message. Datadog (DDOG) sports a confirmed bullish reversal on the price chart and a trend signal from the Trend Composite. Today's article will review these signals and highlight a developing short-term...
READ MORE
MEMBERS ONLY
Limited Leadership, but Still Plenty of Choice
by Arthur Hill,
Chief Technical Strategist, TrendInvestorPro.com
The weight of the evidence remains bullish for stocks, but this is not a bull market that lifts all boats. It is a relatively selective bull market led by technology, housing and a few other groups. This is not necessarily bad. It is, however, important to separate the leaders from...
READ MORE
MEMBERS ONLY
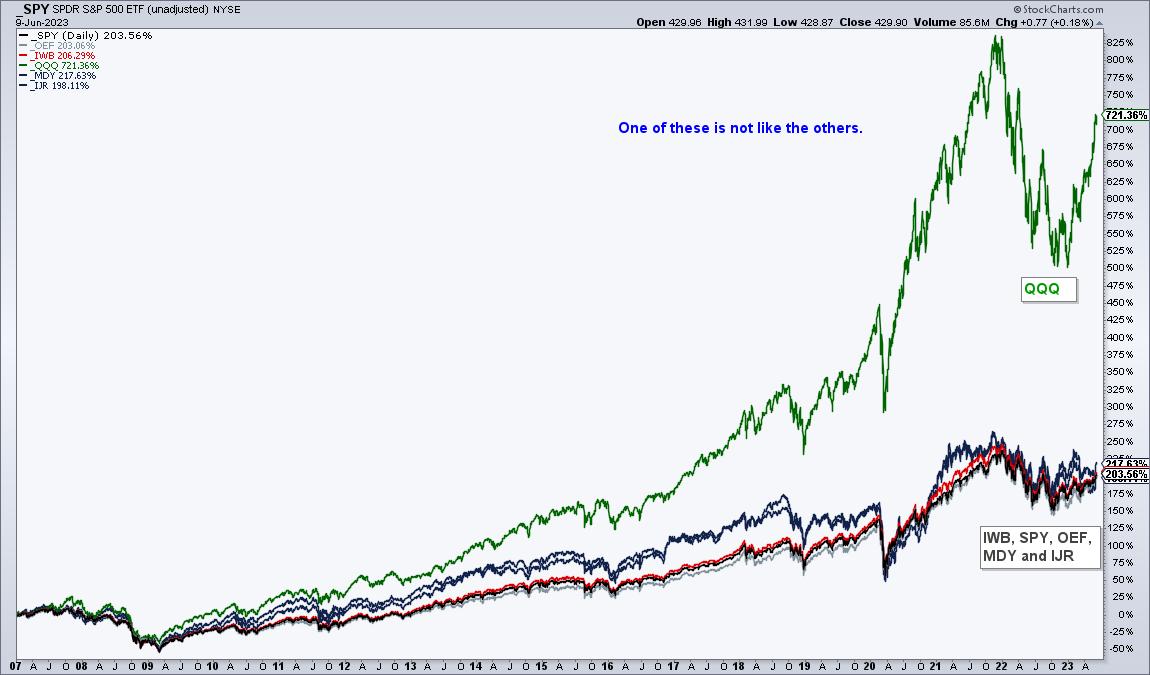
The Nasdaq 100 vs the Rest of the World
by Arthur Hill,
Chief Technical Strategist, TrendInvestorPro.com
A long-term chart shows why the Nasdaq 100 is the place to be, or at least, "was" the place to be. Past performance does not guarantee future performance. The performance chart below shows the 16+ year percentage gain for QQQ and five other ETFs. These include the S&...
READ MORE
MEMBERS ONLY
QQQ Breaks Away from DIA
by Arthur Hill,
Chief Technical Strategist, TrendInvestorPro.com
Trend-momentum strategies that trade stock-based ETFs should require two conditions before considering a position. First, broad market conditions should be bullish. This means being long stocks in bull markets and out of stocks in bear markets. Second, the trend for the ETF should be up. Employing these basic prerequisites can...
READ MORE
MEMBERS ONLY
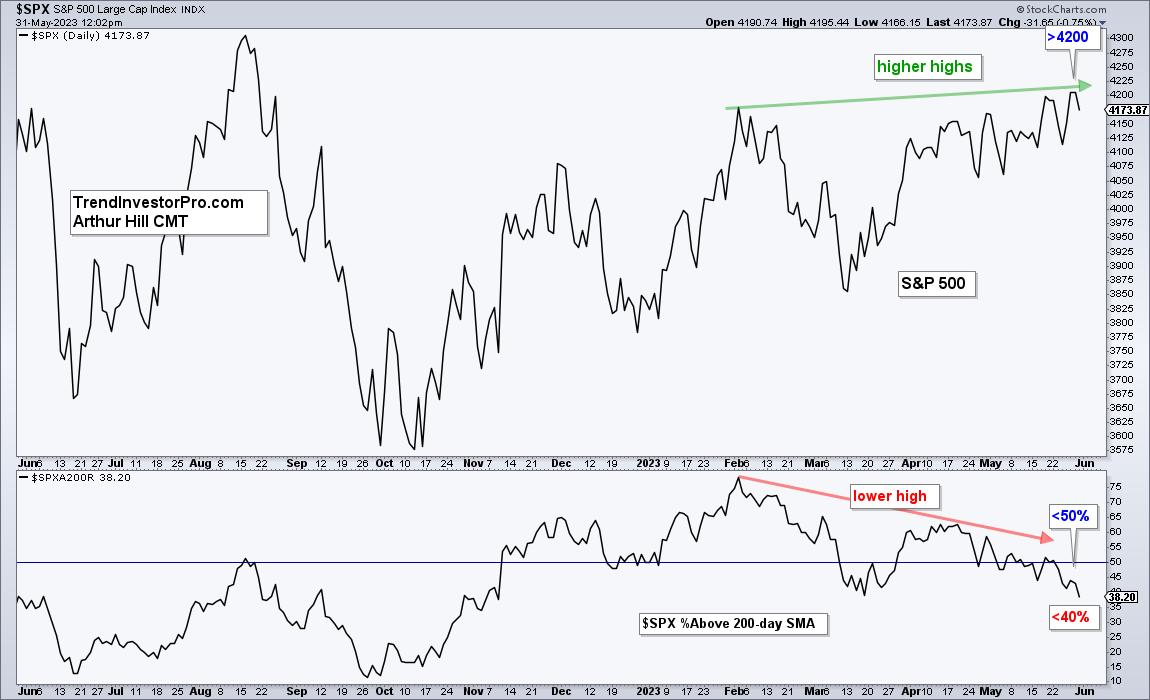
Pesky Breadth Divergence Persists
by Arthur Hill,
Chief Technical Strategist, TrendInvestorPro.com
The S&P 500 recently moved above its February high to extend its uptrend, but all is not well under the surface. Fewer stocks are participating in the May advance and a key breadth indicator formed a bearish divergence. Bearish divergences form when price records a higher high and...
READ MORE
MEMBERS ONLY
Do Profit Targets Add Value to a Strategy?
by Arthur Hill,
Chief Technical Strategist, TrendInvestorPro.com
My research suggests that profit targets improve results for trend-momentum strategies that trade ETFs. Note that performance improvements may differ for other strategies. This article will first show a trend-momentum setup on the chart. I will then provide some performance metrics for a basic strategy with and without a profit...
READ MORE
MEMBERS ONLY
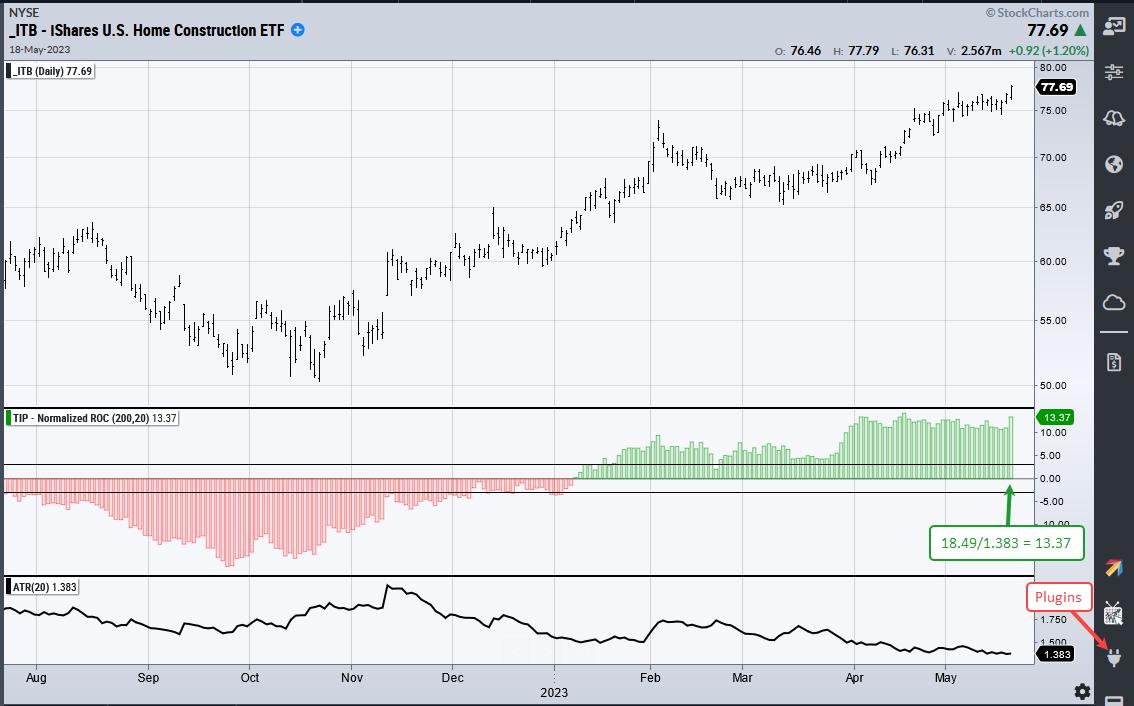
Finding the Leaders with ATR Momentum
by Arthur Hill,
Chief Technical Strategist, TrendInvestorPro.com
Chartists can find leaders by ranking ETF performance in ATR multiples, and there is even an indicator for that. Normalized-ROC puts point performance in ATR multiples and we can compare these values against others. Current Normalized-ROC leaders include the Home Construction ETF (13.37), the Technology SPDR (6.40) and...
READ MORE
MEMBERS ONLY
Three ROCs can be Better than One
by Arthur Hill,
Chief Technical Strategist, TrendInvestorPro.com
Chartists looking for momentum leaders should consider more than one timeframe. A stock may be leading over the last 200 days, but lagging over the last 100 days. Similarly, a stock could show big gains the last 100 days, but still be down over the last 200 days. Measuring performance...
READ MORE
MEMBERS ONLY
The Achilles Heel of ETFs
by Arthur Hill,
Chief Technical Strategist, TrendInvestorPro.com
Trend-momentum strategies trading ETFs were appealing because they generated lower drawdowns and decent returns. Trend-momentum strategies trading stocks, in contrast, were often subject to higher drawdowns, though returns were higher. While I cannot speak for all ETF strategies, my experience shows that ETF strategies have lost their low-drawdown edge. This...
READ MORE
MEMBERS ONLY
Overbought until it Turns – Using the McClellan Oscillator for Condition and the PPO for Timing
by Arthur Hill,
Chief Technical Strategist, TrendInvestorPro.com
Overbought and oversold conditions are tricky because stocks can become overbought/oversold and remain overbought/oversold as the move continues. This is why traders need another indicator or chart signal for confirmation. Today's article to look at some recent overbought/oversold conditions and use the PPO for timing....
READ MORE
MEMBERS ONLY
Waning Participation Within a Key Benchmark Could Spell Trouble
by Arthur Hill,
Chief Technical Strategist, TrendInvestorPro.com
Breadth is holding up for Nasdaq 100 ($NDX) stocks, but deteriorating for S&P 500 index ($SPX) stocks. I view this as a warning sign for the stock market. Breadth indicators measure the degree of participation. For example, the percentage of S&P 500 stocks above the 50-day...
READ MORE
MEMBERS ONLY
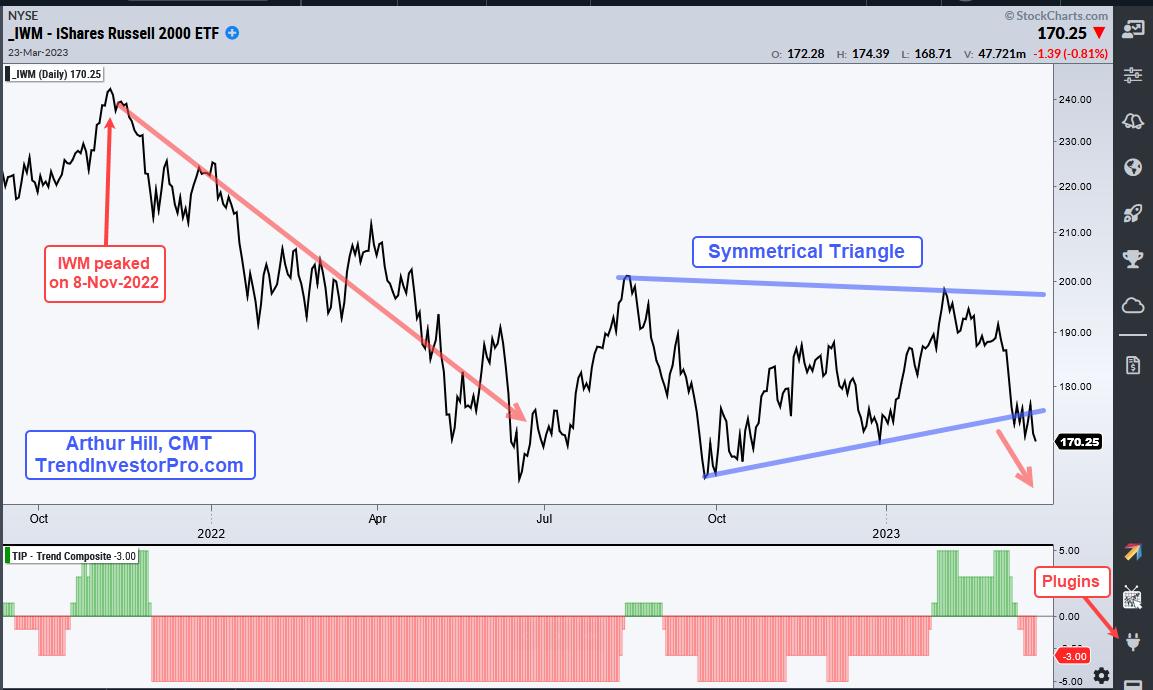
Will the Generals follow the Troops?
by Arthur Hill,
Chief Technical Strategist, TrendInvestorPro.com
Small-caps are leading the way lower and breadth indicators are showing some serious deterioration under the surface. Large-caps are holding up for now, but keep in mind that weakness in small-caps foreshadowed the January 2022 peak in SPY. Today's article will compare price charts for SPY and IWM,...
READ MORE
MEMBERS ONLY
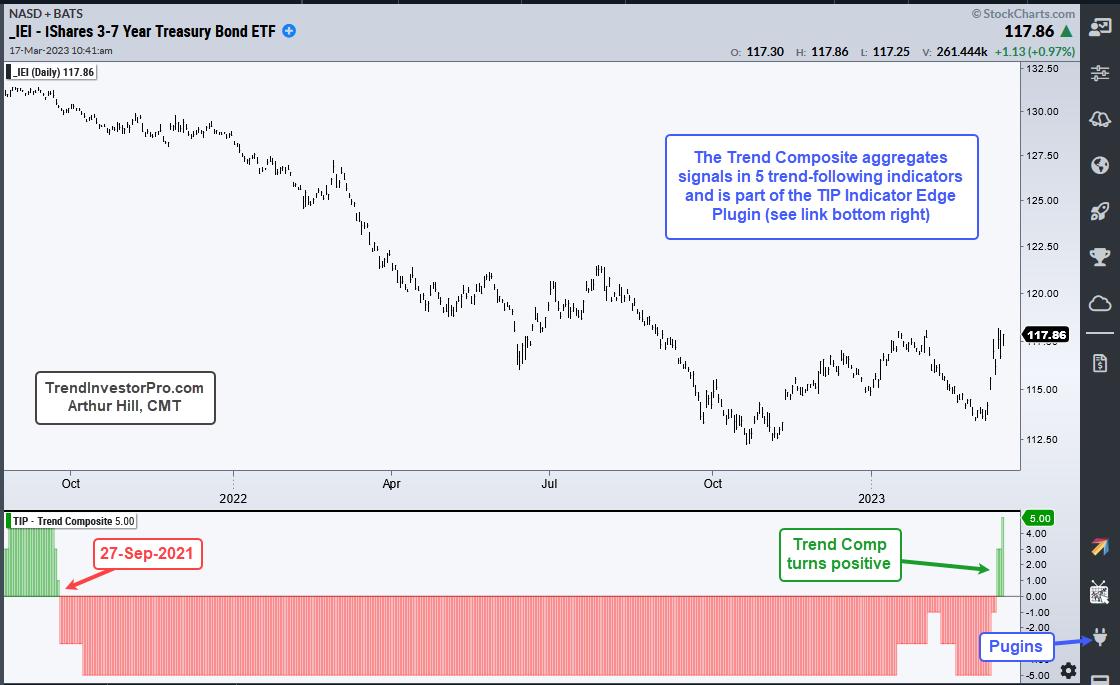
A Risk-off Alternative Turns Up as Stocks Falter
by Arthur Hill,
Chief Technical Strategist, TrendInvestorPro.com
Sometimes markets trend, sometimes they oscillate and sometimes they simply frustrate. I would venture to guess that trading since 2022 falls into the frustration basket. Trend following and momentum strategies are suffering because big moves are failing to extend and develop into trends. Mean-reversion strategies were doing well, but got...
READ MORE
MEMBERS ONLY
Trend Signals and Trailing Stop Examples using XLF and SOXX
by Arthur Hill,
Chief Technical Strategist, TrendInvestorPro.com
Chartists considering a trend-following strategy can use the Trend Composite to identify trend signals and then turn to the ATR Trailing Stop for an exit strategy. A bearish Trend Composite signal could also be used as an exit strategy, but these signals usually trigger later than the ATR Trailing Stop...
READ MORE
MEMBERS ONLY
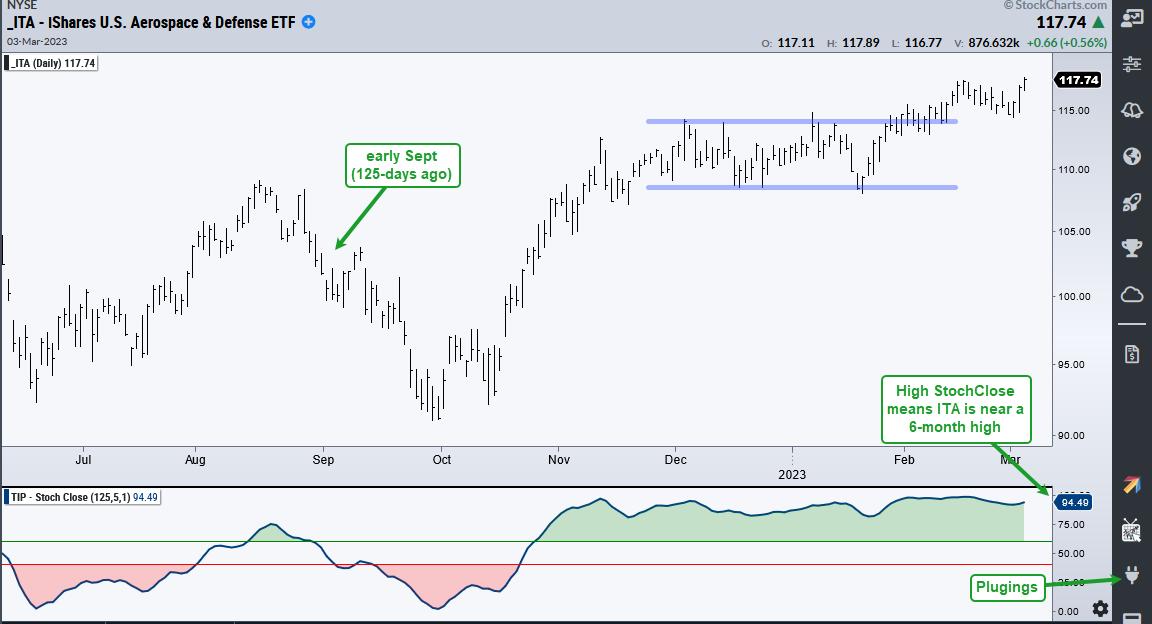
Find the Strongest Price Charts With the StochClose Rank
by Arthur Hill,
Chief Technical Strategist, TrendInvestorPro.com
Stocks and exchange-traded funds (ETFs) trading at or near new highs lead with clear uptrends. These are the names you'd want on your ChartLists or portfolio. You can find leaders by checking the list of 52-week highs or by using the StochClose indicator, which is part of the...
READ MORE
MEMBERS ONLY
Should we Continue Taking Trend Signals after Whipsaws?
by Arthur Hill,
Chief Technical Strategist, TrendInvestorPro.com
The stock market has been a tough place for trend-following since January 2022, which is when the S&P 500 first triggered a bearish trend signal. The bearish signal in question is the humble 5/200 day SMA cross. There were whipsaws in the first quarter of 2022 and...
READ MORE
MEMBERS ONLY
Year of the Big Swing and Month of the Small Flag
by Arthur Hill,
Chief Technical Strategist, TrendInvestorPro.com
The S&P 500 SPDR (SPY) is a period of big swings and above average volatility. There were six swings of at least 10% from late January to early February 2023. Looking at other 12-14 month periods, this is the fourth most in the last 23 years. There were...
READ MORE
MEMBERS ONLY
Pullbacks within Uptrends Create Opportunities
by Arthur Hill,
Chief Technical Strategist, TrendInvestorPro.com
Stocks went on a tear from late December to early February with the SPDR S&P 500 ETF (SPY) advancing some 11% from low to high. SPY then pulled back last week with a 2.5% decline from the February 2 high to the 10-February 10 low. A pullback...
READ MORE
MEMBERS ONLY
Can QQQ Prove the Bears Wrong?
by Arthur Hill,
Chief Technical Strategist, TrendInvestorPro.com
Last week I featured the S&P 500 SPDR (SPY) with a clear resistance level to beat. Even though the 2022 decline could be a correction after a big advance, the ETF is short of a breakout and trend reversal. The Nasdaq 100 ETF (QQQ) also has a clear...
READ MORE
MEMBERS ONLY
SPY Has a Clear Level to Beat
by Arthur Hill,
Chief Technical Strategist, TrendInvestorPro.com
The S&P 500 index has been trending lower since its peak in January 2022, but this decline could be a long correction after a massive advance. The pattern taking shape and the retracement amount is typical for corrections. Today's article highlights this setup and shows the...
READ MORE
MEMBERS ONLY
Trade Like Trevor
by Arthur Hill,
Chief Technical Strategist, TrendInvestorPro.com
Trevor Lawrence put in a performance for the ages in the AFC Wild Card game on Saturday. Chapeaux! Lawrence started the game with four interceptions in the first half but kept on throwing and brought his team back for a big win. There are some lessons here that we can...
READ MORE
MEMBERS ONLY
Relative Seasonality and a Monthly Equity Curve
by Arthur Hill,
Chief Technical Strategist, TrendInvestorPro.com
The stock market has a long-term bullish bias and the monthly return metrics reflect this positive bias. Chartists looking for a seasonal edge can compare benchmark metrics with the monthly performance numbers. Months that outperform the benchmarks have a positive bias, while months that seriously underperform have a negative bias....
READ MORE
MEMBERS ONLY
It's Like Déjà Vu, All Over Again for SPY
by Arthur Hill,
Chief Technical Strategist, TrendInvestorPro.com
The SPDR S&P 500 exchange-traded fund (SPY) surged from mid-October to early December, but this advance was considered a counter-trend bounce within a bigger downtrend. And this week, SPY reversed its short-term uptrend and the bearish technical setup was similar to the last two reversals.
First and foremost,...
READ MORE
MEMBERS ONLY
S&P 500 Index Crosses above 200-day SMA: Not So Fast there Cowboy
by Arthur Hill,
Chief Technical Strategist, TrendInvestorPro.com
The S&P 500 Index ($SPX) crossed its 200-day simple moving average (SMA) for the 173rd time since 2000 and the performance for this "signal" is not that great. Buying and selling the 200-day SMA cross produced a lower return than buy and hold. This cross, however,...
READ MORE
MEMBERS ONLY
Trend-Followers Get the Whip, while Swing Traders Catch the Ride
by Arthur Hill,
Chief Technical Strategist, TrendInvestorPro.com
2022 has been a tough market for trend-followers, but swing traders have been able to catch a few rides. Trend-followers are suffering because whipsaws are above average this year. A whipsaw occurs when an uptrend cannot extend after a bullish trend signal and the trade results in a loss.
Before...
READ MORE
MEMBERS ONLY
How to Find the True Market Leaders
by Arthur Hill,
Chief Technical Strategist, TrendInvestorPro.com
Stocks surged this week with the SPDR S&P 500 ETF (SPY) advancing over 5% and nearing its falling 200-day simple moving average (SMA). The big trend is still down because SPY recorded a 52-week low a month ago and a lower low from June to October. The ETF...
READ MORE
MEMBERS ONLY
Copper Breaks With an Outsized Move
by Arthur Hill,
Chief Technical Strategist, TrendInvestorPro.com
The S&P 500 Index ($SPX) moved to a new low from June to October 2022, but copper held up better with a higher low and broke short-term resistance with an outsized move this week. A breakout with an outsized move shows above-average strength and it looks like the...
READ MORE
MEMBERS ONLY
Tape and Fed Outweigh Seasonality
by Arthur Hill,
Chief Technical Strategist, TrendInvestorPro.com
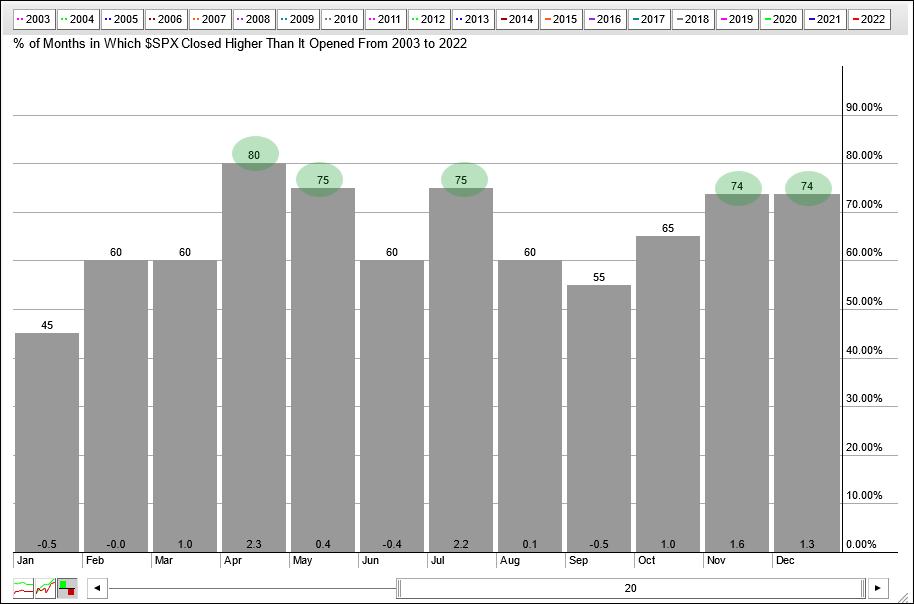
The seasonal patterns for October and yearend are quite positive, but seasonality is just one aspect of broad market analysis and the weight of the evidence remains bearish.
The histogram below shows the seasonal patterns for the S&P 500 over the last twenty years. Five of the twelve...
READ MORE
MEMBERS ONLY
The Pickings are Slim, but one Metal Stands Out
by Arthur Hill,
Chief Technical Strategist, TrendInvestorPro.com
The pickings are extremely thin in the markets because the vast majority of groups are in downtrends. TrendInvestorPro tracks trend signals in 274 ETFs. This list include 170 stock-based ETFs, 18 fixed income ETFs, 17 commodity ETFs, 9 currency ETFs and 60 non-US ETFs. Only 14 (5.1%) of the...
READ MORE
MEMBERS ONLY
Understanding Bear Markets and Setting Expectations
by Arthur Hill,
Chief Technical Strategist, TrendInvestorPro.com
Technical analysts often scoff at the notion that a 20% decline marks a bear market. However, a look back shows that further losses are certainly possible after a 20% decline. Over the last 25 years, the last two bear markets started with declines in excess of 20% and the S&...
READ MORE
MEMBERS ONLY
Correlations Rise as Bear Extends its Grip
by Arthur Hill,
Chief Technical Strategist, TrendInvestorPro.com
Despite the bear market environment, a handful of stock-based ETFs were showing leadership with bullish Trend Composite signals. Representatives from dirty energy (XLE), clean energy (TAN) and utilities (XLU) were covered over the last few weeks and this article is a follow-up. These ETFs remain with bullish Trend Composite signals,...
READ MORE
MEMBERS ONLY
Coming Up Aces in Clean Energy
by Arthur Hill,
Chief Technical Strategist, TrendInvestorPro.com
The broad market environment remains bearish, but one group stood out in early August and continues to stand out. The Solar Energy ETF (TAN) was featured on August 1st as the Trend Composite turned bullish and clean energy was featured as an emerging theme on August 5th. Clean energy ETFs...
READ MORE
MEMBERS ONLY
Energy-based ETFs Hold Up Despite Weakness in Stocks and Oil
by Arthur Hill,
Chief Technical Strategist, TrendInvestorPro.com
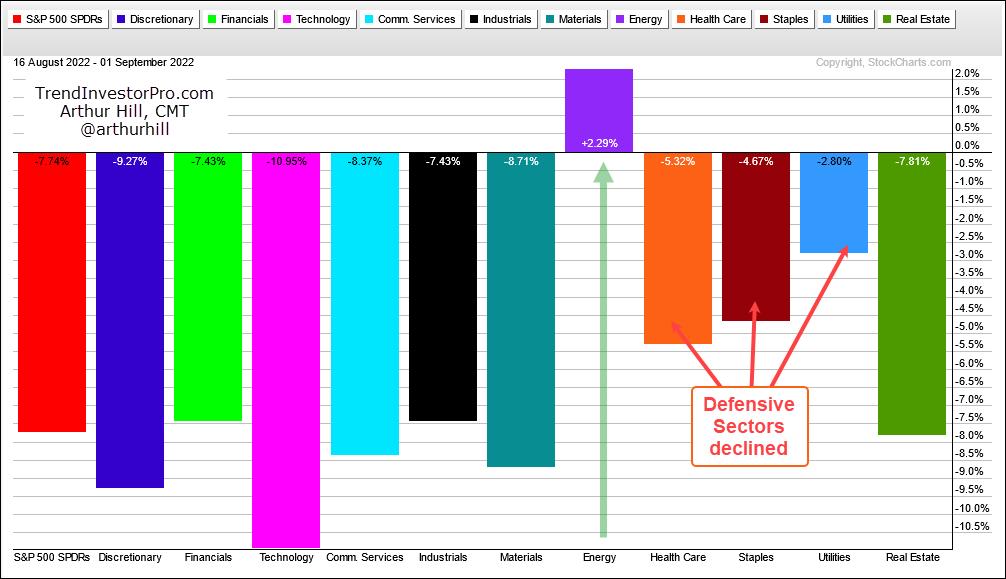
It has been a rough four weeks for stocks and oil, but the energy-related ETFs held up relatively well and remain in uptrends. The PerfChart below shows performance for SPY, oil, the DB Energy ETF (DBE) and five energy-related ETFs since August 16th, which is when SPY peaked. SPY is...
READ MORE
MEMBERS ONLY
So Called Defensive ETFs are Not Immune
by Arthur Hill,
Chief Technical Strategist, TrendInvestorPro.com
The short-term trends for the big three are down (SPY, QQQ, IWM) and we are in a bear market. Over the last two weeks, the short-term trend (down) aligned with the long-term trend (down). This is a powerful combination that can lead to rising correlation among stocks. Note that downside...
READ MORE
MEMBERS ONLY
Improving Odds by Focusing on ETFs with Leading Uptrends
by Arthur Hill,
Chief Technical Strategist, TrendInvestorPro.com
Traders can improve the odds of success by focusing on ETFs in leading uptrends. TrendInvestorPro identifies such ETFs with a table that shows Trend Composite signals and the 52-week range indicator. These ETFs are then singled out for chart analysis and we are featuring the DB Energy ETF (DBE) today....
READ MORE
MEMBERS ONLY
Quantifying the Battle for the 200-day – It's Elementary
by Arthur Hill,
Chief Technical Strategist, TrendInvestorPro.com
The S&P 500 SPDR (SPY) surged to its falling 200-day SMA here in August and even edged above this key level intraday on Tuesday. Even though the ETF is close to crossing above the 200-day, chartists would be better off taking a step back to avoid a whipsaw....
READ MORE
MEMBERS ONLY
Overbought and Staying Overbought
by Arthur Hill,
Chief Technical Strategist, TrendInvestorPro.com
The S&P 500 SPDR (SPY) is in the midst of a strong advance since mid July as it became "overbought" on July 20th and remains overbought. Today's article will show how to measure overbought and oversold levels using StochClose, which is a version of...
READ MORE