MEMBERS ONLY
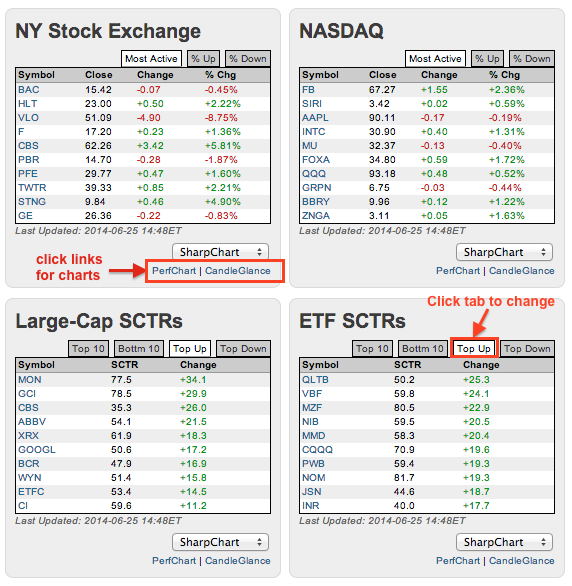
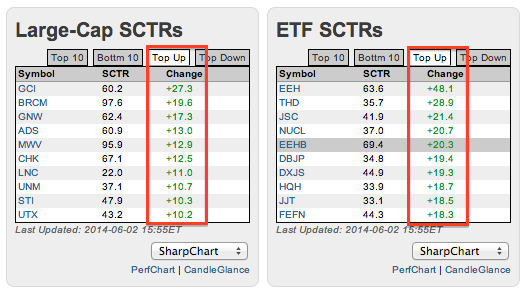
CBS and FB Lead Most Actives, while XRX and PWB Show Big Relative Moves
by Arthur Hill,
Chief Technical Strategist, TrendInvestorPro.com
Chartists can find stocks and ETFs on the move using the six tables in the middle of the home page. The image below shows four of these tables: most active Nasdaq and NYSE stocks, large-cap SCTR movers and SCTR movers for ETFs. Notice that Facebook and CBS are up...
READ MORE
MEMBERS ONLY
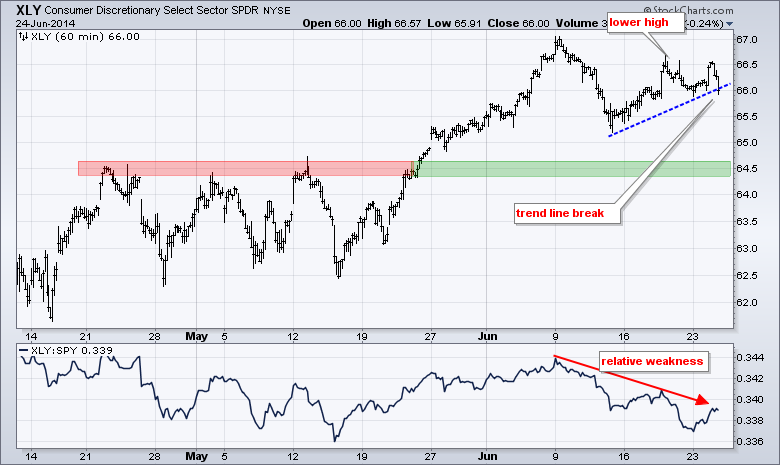
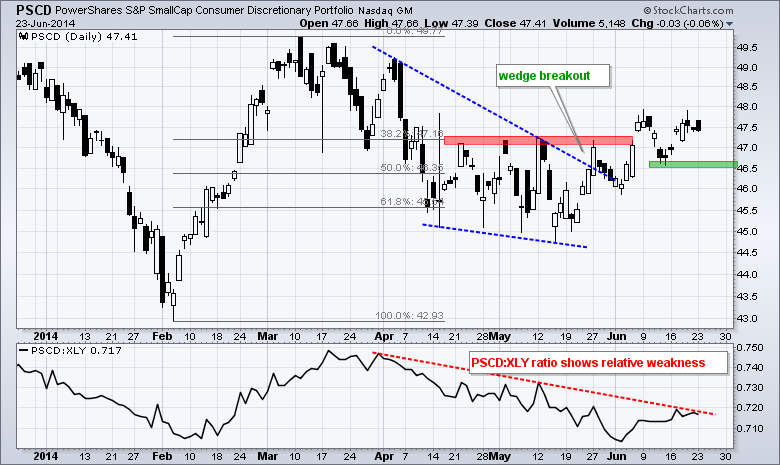
Industrials and Consumer Discretionary Sectors Weaken
by Arthur Hill,
Chief Technical Strategist, TrendInvestorPro.com
Stocks started the day strong, but peaked near midday and fell in the afternoon. The major index ETFs formed outside days with a bearish bias. This means Tuesday's high-low range was outside Monday's high-low range and Tuesday's close was weak. One day...
READ MORE
MEMBERS ONLY
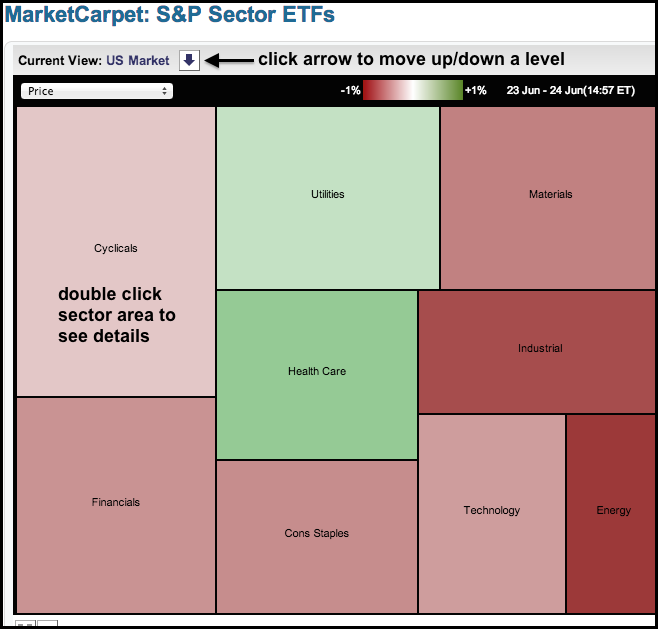
Sector MarketCarpet Turns Mostly Red, but Two Sectors Stay Green
by Arthur Hill,
Chief Technical Strategist, TrendInvestorPro.com
The MarketCarpet for the nine S&P sectors turned mostly red on Tuesday with seven sectors down and just two up. Utilities and healthCare were the only two holding on to their gains in the late afternoon. Notice that energy is the darkest red. This means stocks in this...
READ MORE
MEMBERS ONLY
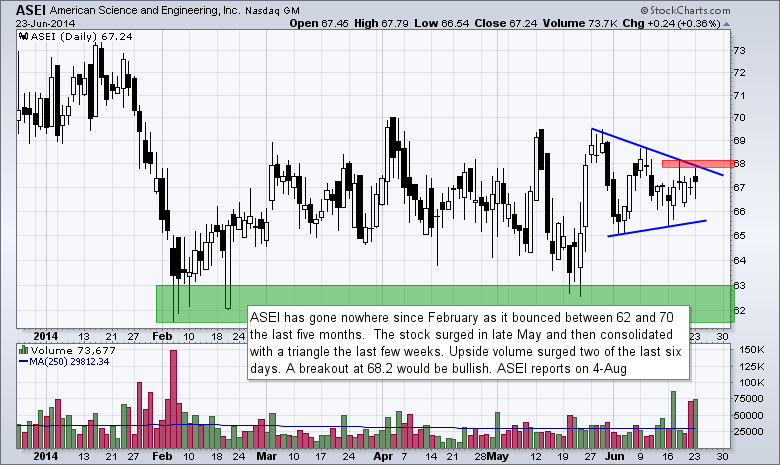
Chart Setups: ASEI, BA, GMED, MENT, NTAP
by Arthur Hill,
Chief Technical Strategist, TrendInvestorPro.com
There are five setups today. First, we start with an engineering concern that formed a triangle after a big surge. Second, there is a major aircraft maker with a gap and support break. Third, we have a healthcare stock with a bullish breakout in the works. Fourth, there is a...
READ MORE
MEMBERS ONLY
TLT Holds Wedge Break - UUP Hits Support Zone
by Arthur Hill,
Chief Technical Strategist, TrendInvestorPro.com
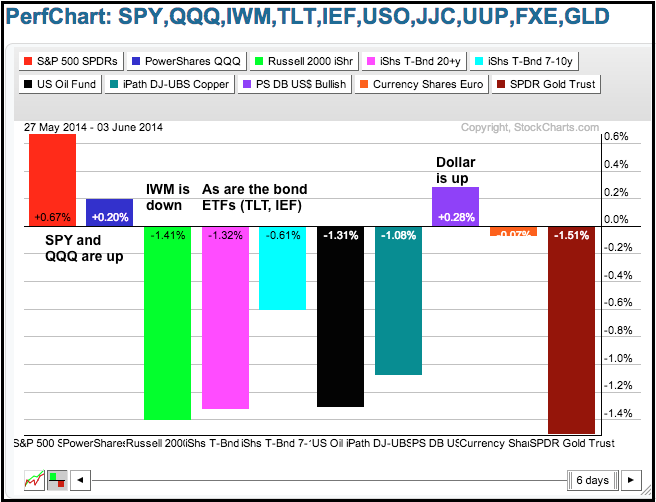
The energizer bunny continues to power the stock market higher. Stocks have been considered overbought several times over the last few weeks, but the uptrend simply trumps everything. Small-caps led the advance last week as the Russell 2000 iShares surged 2.3%. All sectors were up with energy and...
READ MORE
MEMBERS ONLY
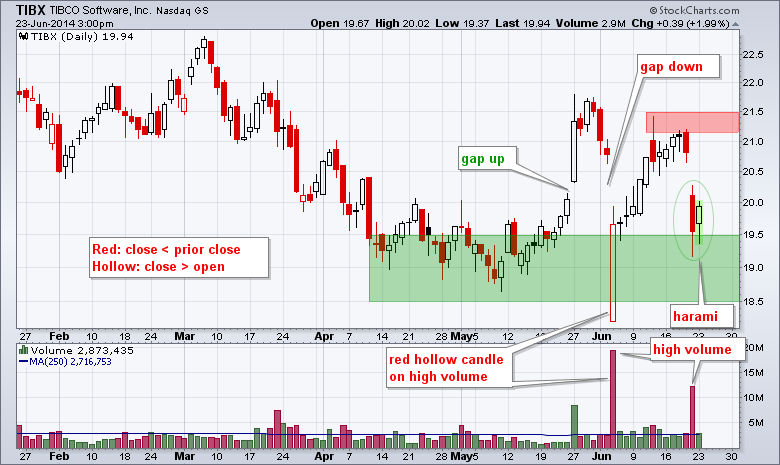
Tibco Establishes Support with Rare Red Hollow Candle
by Arthur Hill,
Chief Technical Strategist, TrendInvestorPro.com
Tibco Software (TIBX) has been all over the place the last five weeks. The stock gapped up in late May, gapped down in early June, bounced to 21 and then gapped down again last Friday. Despite all this volatility, the stock may be at support now. Notice that a rare...
READ MORE
MEMBERS ONLY
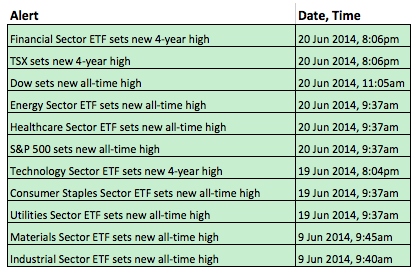
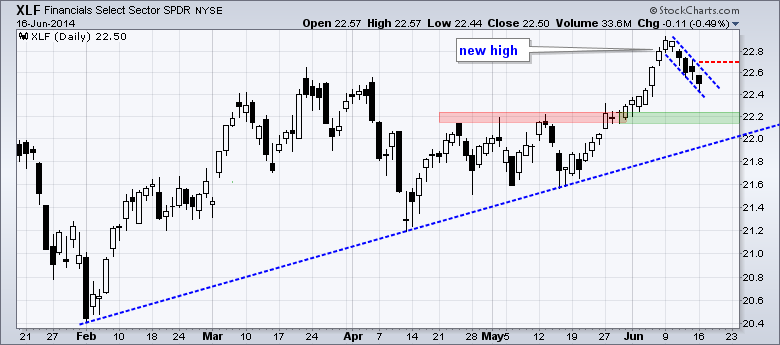
Eight of Nine Sector SPDRs Hit New Highs
by Arthur Hill,
Chief Technical Strategist, TrendInvestorPro.com
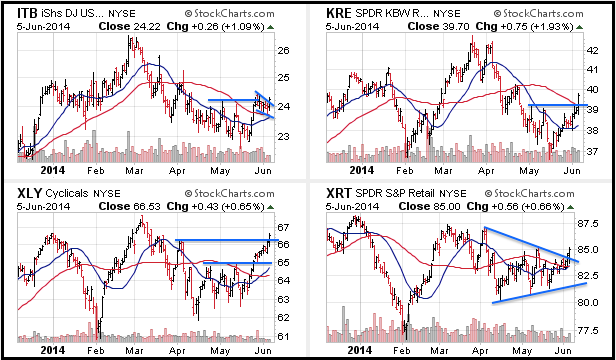
The overall picture remains bullish for stocks and sector participation is broad. Six of the nine sector SPDRs hit new highs this week, and seven of the nine hit new highs this month. The Consumer Discretionary SPDR is the only one that has yet to hit a new high and...
READ MORE
MEMBERS ONLY
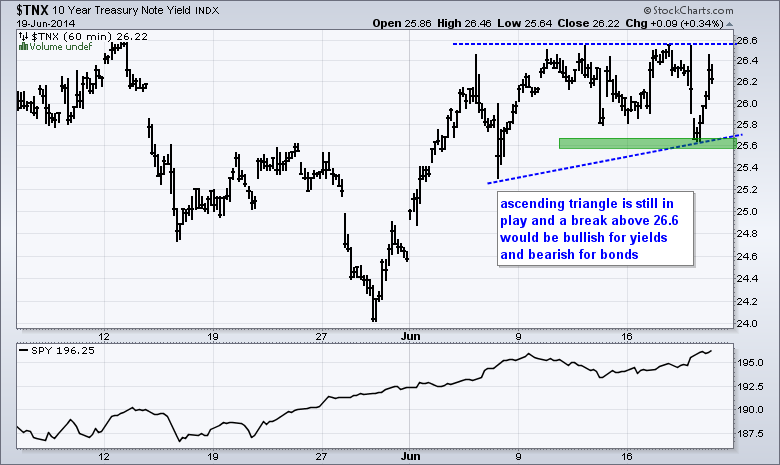
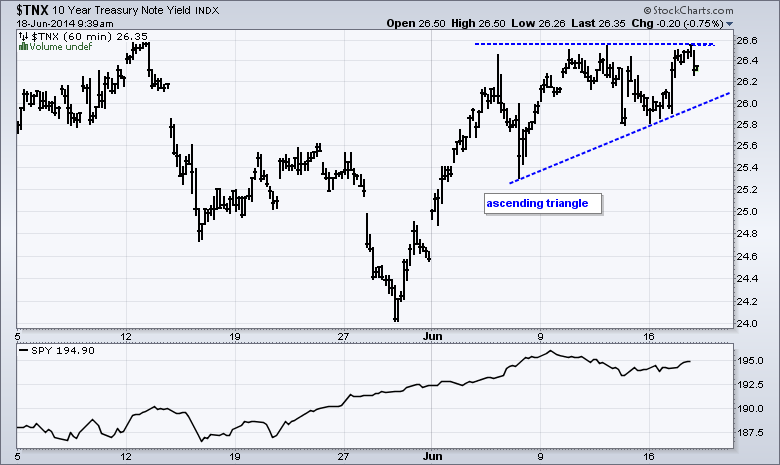
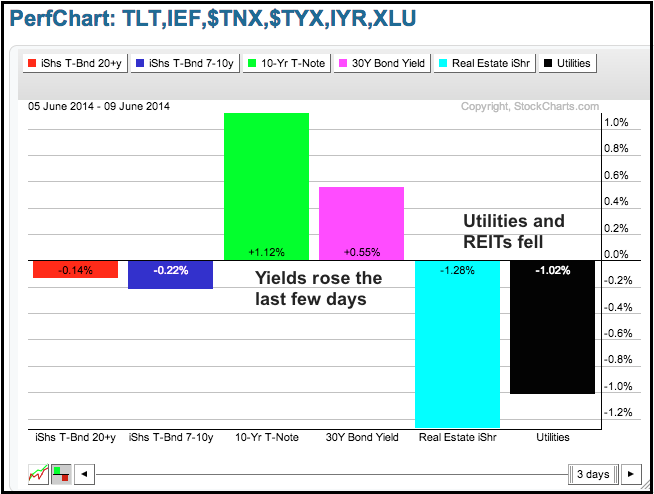
Yields Move Higher Despite Dovish Fed - UUP Falls Back to Retracement
by Arthur Hill,
Chief Technical Strategist, TrendInvestorPro.com
Stocks did not do much, but it was a most interesting day elsewhere. The major index ETFs closed fractionally higher and the sectors were mixed. The consumer discretionary, technology and finance sectors were fractionally lower. The energy, consumer staples and utilities sectors were modestly higher. Gold and silver miners surged...
READ MORE
MEMBERS ONLY
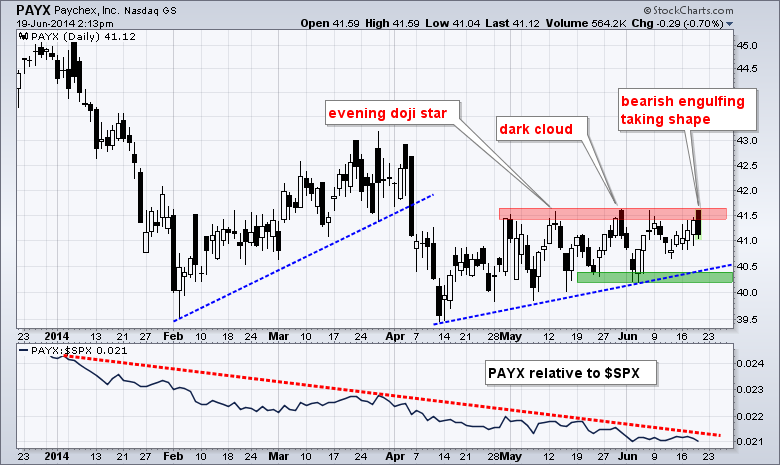
A Dark Cloud Forms Over Paychex
by Arthur Hill,
Chief Technical Strategist, TrendInvestorPro.com
Paychex (PAYX) is having all kinds of problems breaking through resistance in the 41.7 area. A bearish engulfing is taking shape today and this is the third bearish candlestick reversal pattern in six weeks. The late May and early June lows mark support in the 40.2-40.4...
READ MORE
MEMBERS ONLY
Dovish Fed Puts Bid into Stocks, Bonds and Gold
by Arthur Hill,
Chief Technical Strategist, TrendInvestorPro.com
The Yellen Fed came out with a dovish statement on Wednesday. This put a bid into utilities, gold, bonds and stocks. The Dollar and Treasury yields moved lower. The gains in the major index ETFs were modest, but enough to extend the short-term uptrends. The Utilities SPDR surged over...
READ MORE
MEMBERS ONLY
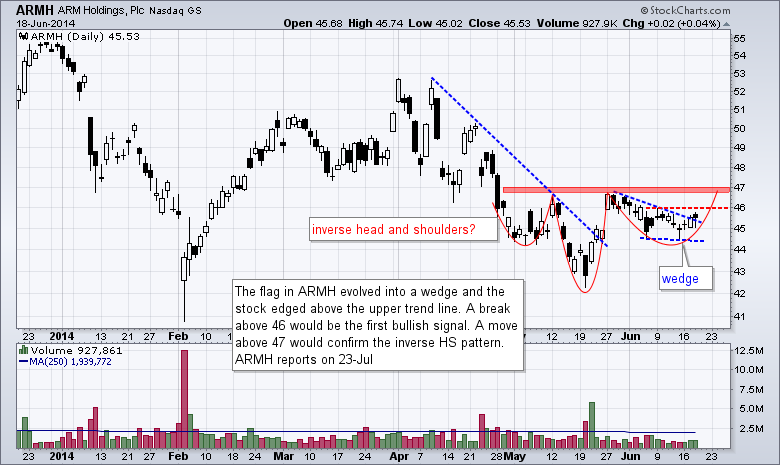
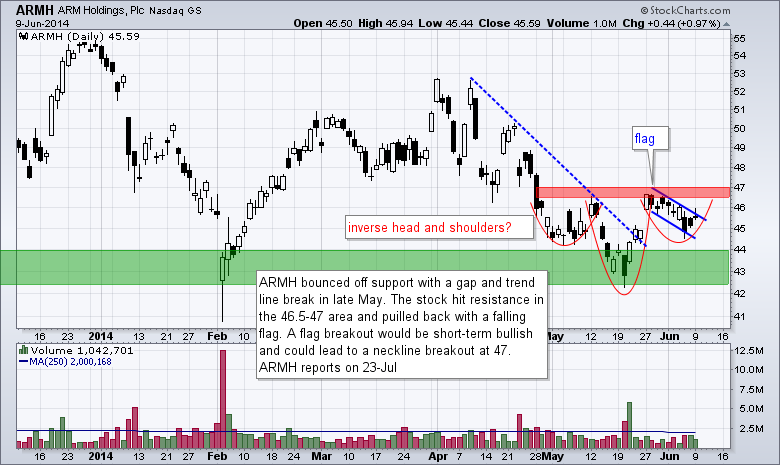
Chart Setups: ARMH, CERN, JNPR, LSCC, TASR
by Arthur Hill,
Chief Technical Strategist, TrendInvestorPro.com
There are five setups today. First, we start with a semiconductor stock forming an inverse head-and-shoulders pattern. Second, there is a healthcare stock with a bull flag taking shape. Third, we feature a networking stock with a Bollinger Band squeeze. The fourth stock also comes from the semiconductor...
READ MORE
MEMBERS ONLY
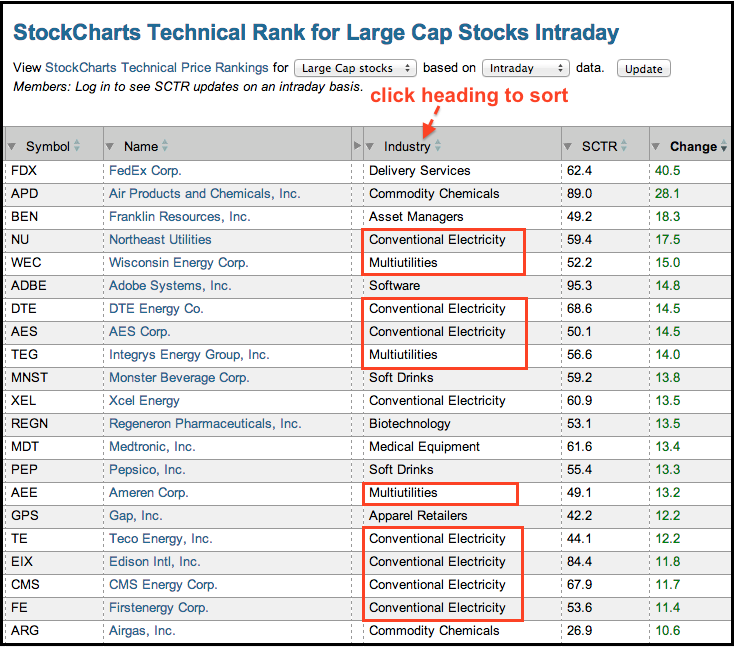
Utility Stocks Show Big Relative Gains on SCTR Table
by Arthur Hill,
Chief Technical Strategist, TrendInvestorPro.com
The utilities sector is on fire Wednesday with several stocks sporting big gains in their StockCharts Technical Rank (SCTR). Northeast Utilities (NU), DTE Energy (DTE) and AES Corp (AES) have double digit gains in their SCTR. Notice that this table can be sorted by clicking the column heading. This makes...
READ MORE
MEMBERS ONLY
UUP Bounces off Support as GLD Hits Resistance
by Arthur Hill,
Chief Technical Strategist, TrendInvestorPro.com
It seems that there are higher yields in our future. The economy is plugging along, the labor market is improving and inflation is on target. The Consumer Price Index (CPI) rose .4% in May and this was the largest increase since February 2013. It also puts the CPI on target...
READ MORE
MEMBERS ONLY
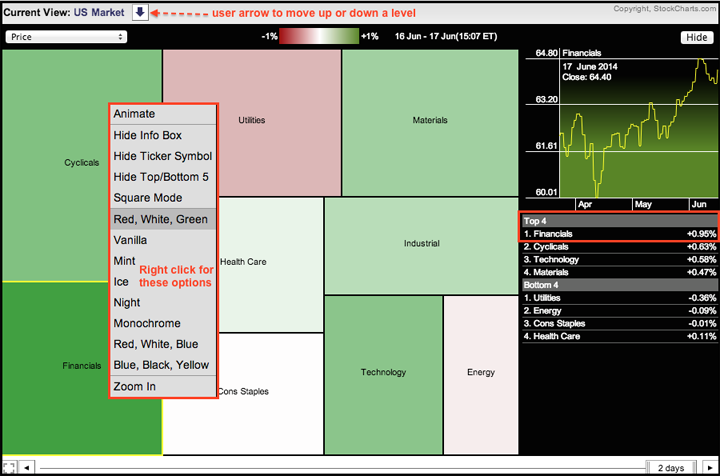
Finance Sector Lights up the MarketCarpet
by Arthur Hill,
Chief Technical Strategist, TrendInvestorPro.com
The Sector MarketCarpet shows the Finance SPDR (XLF) catching the strongest bid because it is the darkest green. The Utilities SPDR (XLU) is the weakest with an average loss of .36%. Hover over the carpet and right click to see formatting options. Click the arrow in the upper right to...
READ MORE
MEMBERS ONLY
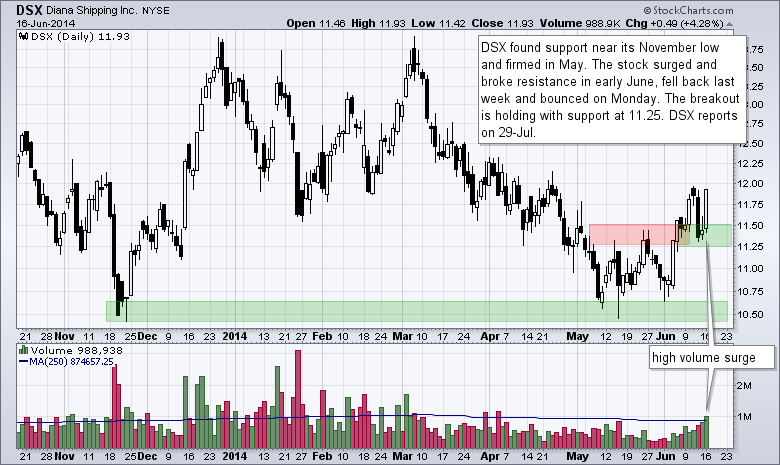
Chart Setups: DSX,GME,HMC,IMMR,NKE,UAL
by Arthur Hill,
Chief Technical Strategist, TrendInvestorPro.com
Today we have six setups. We start with a shipper that broke resistance and successfully tested this breakout with a high volume bounce. Next we have a video game retailer consolidating after a gap. Third up is a Japanese automaker with a bull flag. The fourth slot goes to a...
READ MORE
MEMBERS ONLY
Finance Sector Corrects as Fed and Settlements Loom
by Arthur Hill,
Chief Technical Strategist, TrendInvestorPro.com
Stocks were mixed on Monday, but the major index ETFs managed to eek out small gains. Small-caps showed some relative strength as the Russell 2000 ETF gained .48% on the day. The sectors were mixed with weakness in finance, industrials and materials. Energy and utilities were strong. Strength in...
READ MORE
MEMBERS ONLY
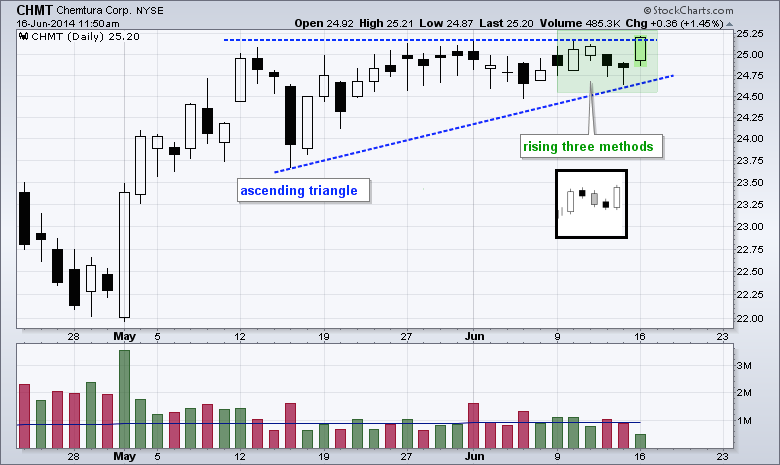
Chemtura Hits Rising Three Methods Scan
by Arthur Hill,
Chief Technical Strategist, TrendInvestorPro.com
The Rising Three Methods candlestick pattern is a bullish continuation pattern with four candlesticks: a long white candlestick, three candlesticks with small bodies and a long white candlestick that signals a continuation higher. The three small candlesticks mark a short correction or pullback. The chart below shows Chemtura with this...
READ MORE
MEMBERS ONLY
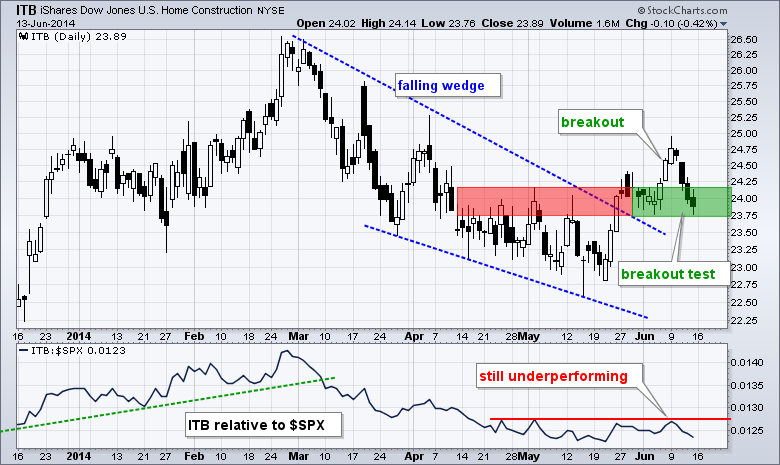
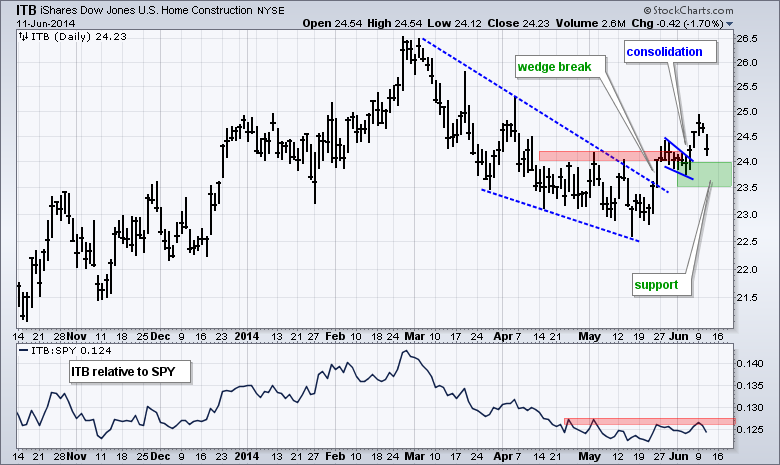
It Could be a Big Week for Housing Stocks and Treasuries
by Arthur Hill,
Chief Technical Strategist, TrendInvestorPro.com
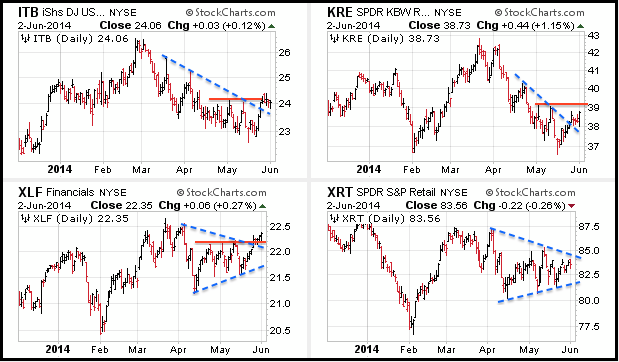
It could be a big week for housing-related stocks and Treasury bonds. The Home Construction iShares (ITB) is at a critical juncture because it is testing the early June breakout after last week's pullback. We will get new data points for housing starts and building permits on...
READ MORE
MEMBERS ONLY
Modest Selling Pressure Hits Stocks - GLD Surges to First Resistance
by Arthur Hill,
Chief Technical Strategist, TrendInvestorPro.com
Selling pressure extended on Thursday, but the losses in the major index ETFs were modest. The Russell 2000 ETF declined .61% and the S&P 500 SPDR fell .71%. This is moderate selling pressure. There were, of course, some pockets with more intense selling pressure. The consumer discretionary and...
READ MORE
MEMBERS ONLY
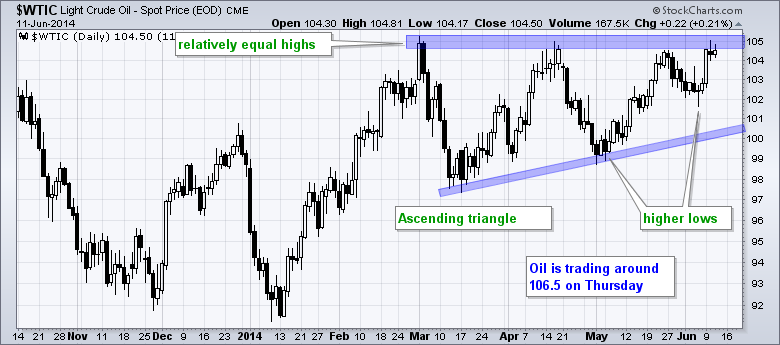
Spot Light Crude Surges Through Resistance
by Arthur Hill,
Chief Technical Strategist, TrendInvestorPro.com
Tensions in Iraq put a big bid into Spot Light Crude ($WTIC) as this key commodity broke above its March-May highs. Overall, crude formed an ascending triangle over the last few months and today's breakout signals a continuation of the January-February surge. The height of the...
READ MORE
MEMBERS ONLY
ITB Tests Breakout Zone - UUP Extends Higher
by Arthur Hill,
Chief Technical Strategist, TrendInvestorPro.com
Stocks came under selling pressure on Wednesday with the Russell 2000 ETF losing around .50% and the S&P 500 SPDR falling .35%. Even though today's decline was insignificant for the broader market, there are some growing concerns that could lead to a pullback or corrective period...
READ MORE
MEMBERS ONLY
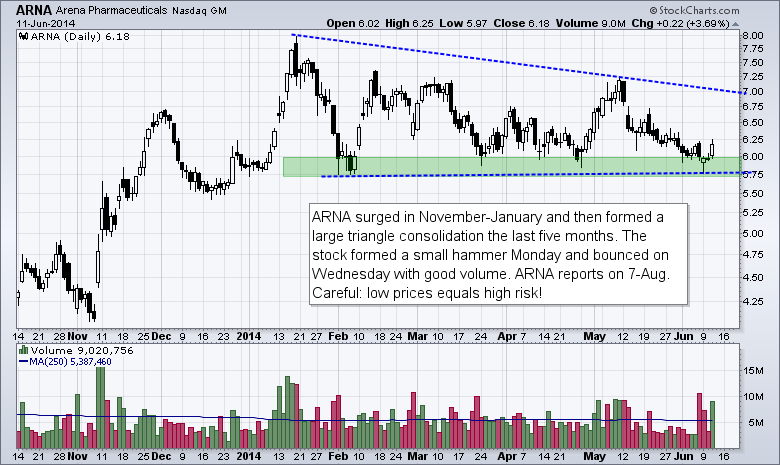
Chart Setups: ARNA, EIGI, JIVE, MYL, UTHR
by Arthur Hill,
Chief Technical Strategist, TrendInvestorPro.com
Today's charts feature five setups. First, there is a small pharma company bouncing off support after a hammer. Second, we have a recent IPO getting a breakout with good volume. Third, there is a small software company with a double bottom taking shape. Fourth, a generic drug maker...
READ MORE
MEMBERS ONLY
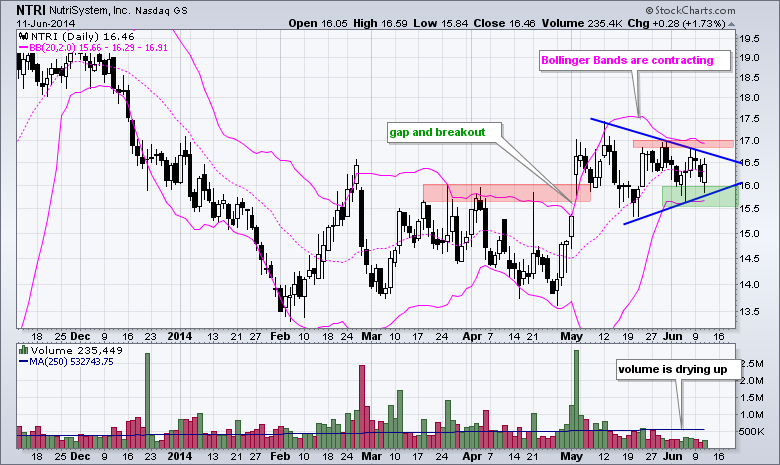
The Noose Tightens on NutriSystem
by Arthur Hill,
Chief Technical Strategist, TrendInvestorPro.com
Nutrisystem (NTRI) broke out with a big gap-surge in early May and then consolidated with a triangle. The gap and breakout are largely holding as volatility contracts. Notice how the Bollinger Bands narrowed and volume dried up over the last few weeks. Chartists should watch the June range for...
READ MORE
MEMBERS ONLY
Stocks Turned Mixed, but Short-Term Uptrend Remains
by Arthur Hill,
Chief Technical Strategist, TrendInvestorPro.com
It was a mixed day on Wall Street as the Nasdaq 100 ETF edged higher (.17%) and the S&P 500 SPDR edged lower (.01%). The gains and losses in the major index ETFs were insignificant and Tuesday can be called a consolidation day. The sectors were also mixed...
READ MORE
MEMBERS ONLY
New Highs Expand as Small-Caps Extend Rally
by Arthur Hill,
Chief Technical Strategist, TrendInvestorPro.com
Stocks continued higher in early trading and then succumbed to some selling pressure in the afternoon. The Nasdaq 100 ETF (QQQ) closed slightly lower, the S&P 500 SPDR (SPY) edged higher and the Russell 2000 ETF (IWM) gained .88% on the day. The sectors were mixed with five...
READ MORE
MEMBERS ONLY
Chart Setups: ARMH, CERN, DWA, HTWR, WTW
by Arthur Hill,
Chief Technical Strategist, TrendInvestorPro.com
Today's charts feature five setups. First, we have a semiconductor stock with a bullish reversal pattern in the works. Second, we have a software company catering to the healthcare sector. Third, there is a movie producer scheduled to release a sequel this weekend. Fourth, there is a medical...
READ MORE
MEMBERS ONLY
Key Industry Group ETFs Lead Market Higher
by Arthur Hill,
Chief Technical Strategist, TrendInvestorPro.com
Stocks caught a decent bid last week with small-caps, mid-caps and micro-caps leading the way. This shows strength at the high-beta end of the market and shows an increased appetite for risk. All sectors were up with finance, industrials and consumer discretionary leading the way. Relative...
READ MORE
MEMBERS ONLY
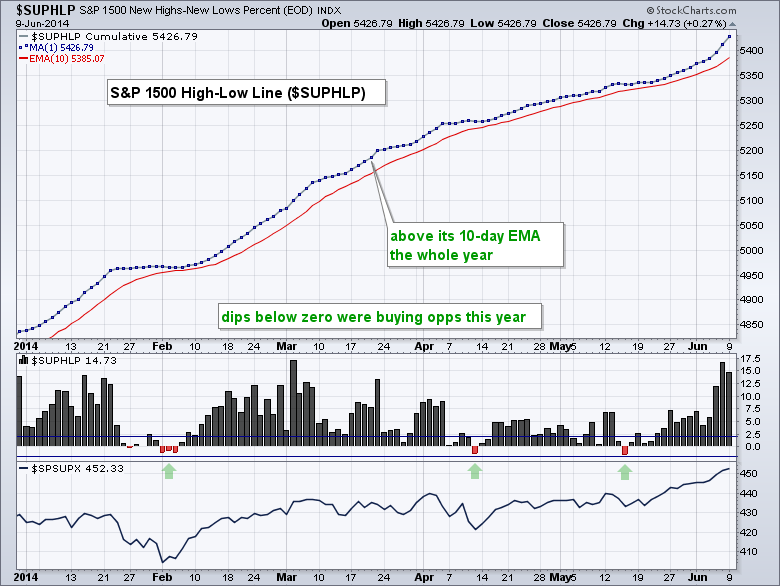
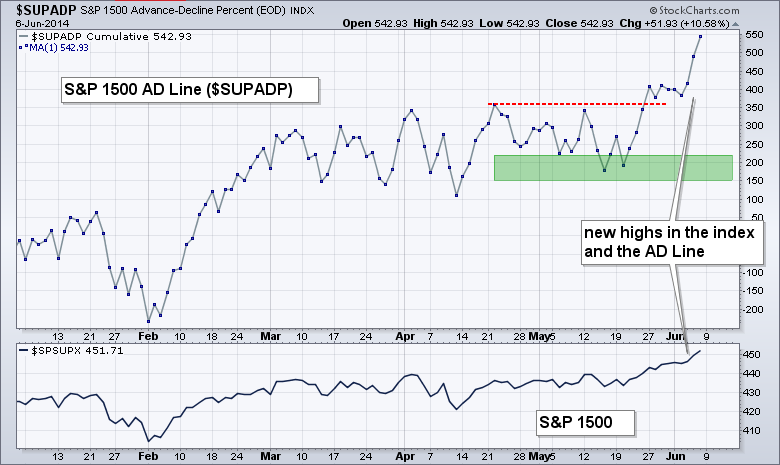
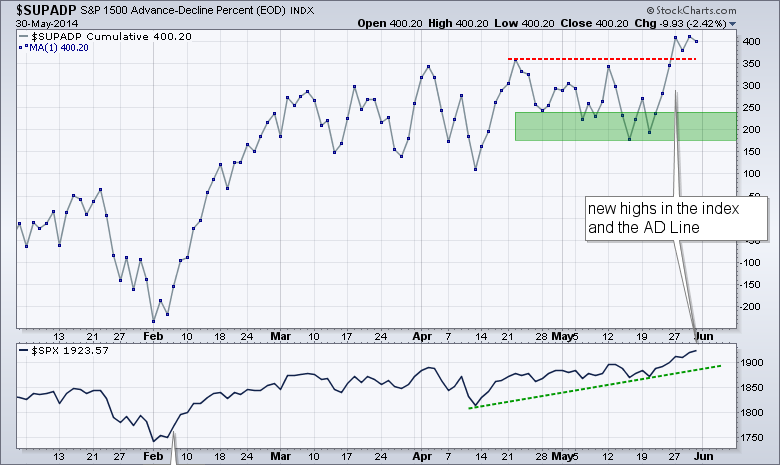
Key Breadth Indicators Confirm New Highs in the Stock Market
by Arthur Hill,
Chief Technical Strategist, TrendInvestorPro.com
The AD Line and AD Volume Line are aggregate measures of participation. The AD Line favors small and mid-caps because an advance equals +1 and a decline equals -1, regardless of market cap. This means an advance in Apple ($556 billion market cap) counts the same as an advance...
READ MORE
MEMBERS ONLY
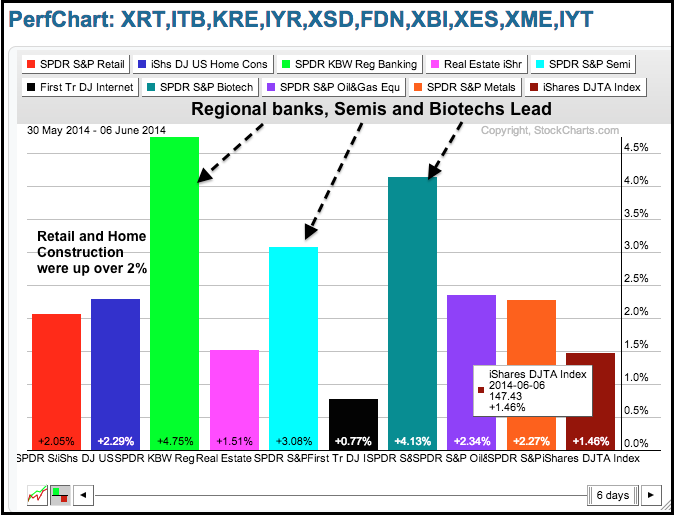
Small-Caps and Regional Banks Lead Market Higher
by Arthur Hill,
Chief Technical Strategist, TrendInvestorPro.com
Stocks caught a bid with the Russell 2000 ETF and Russell MicroCap iShares leading the charge. Both gained over 2% and easily outperformed the S&P 500 SPDR, which gained just .60% on the day. All sectors were up with industrials and finance leading. Among the key industry group...
READ MORE
MEMBERS ONLY
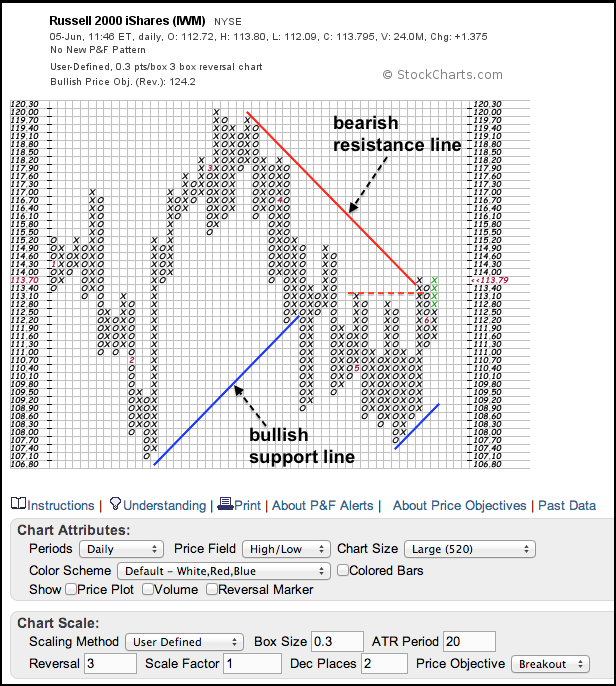
IWM Breaks Bearish Resistance Line on P&F Chart
by Arthur Hill,
Chief Technical Strategist, TrendInvestorPro.com
The P&F chart below shows the Russell 2000 ETF (IWM) with 30-cent boxes to capture the medium-term trend. Notice that this chart extends back to January, which is marked by the red numeral 1 in the first column. The ETF broke the bullish support line in...
READ MORE
MEMBERS ONLY
Chart Setups: AMTD, BBRY, DSX, IACI, SPWR
by Arthur Hill,
Chief Technical Strategist, TrendInvestorPro.com
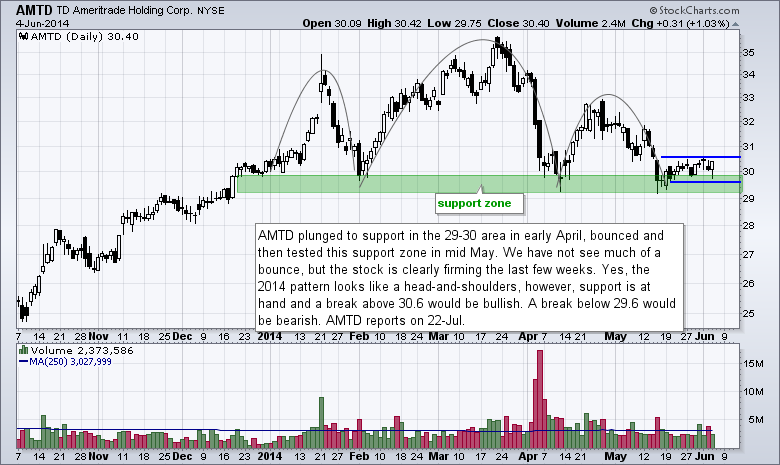
Today's charts feature five setups. First, we have a stockbroker testing a major support zone. Second, there is a cell phone maker gapping higher and holding the gap. Third, a shipper is showing signs of life with a big move. The fourth chart features an internet company with...
READ MORE
MEMBERS ONLY
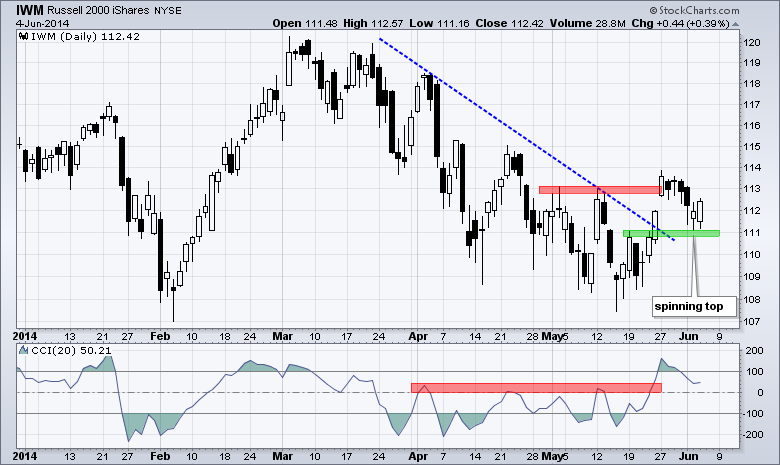
CCI Breakout on IWM Chart Holds - TLT Breaks Support
by Arthur Hill,
Chief Technical Strategist, TrendInvestorPro.com
Stocks edged higher on Wednesday with the major index ETFs posting modest gains. The economic reports continue to be positive with the ISM Services Index coming in well above 50 and the ADP report showing 179000 new private sector jobs. Also note that the Fed's beige book showed...
READ MORE
MEMBERS ONLY
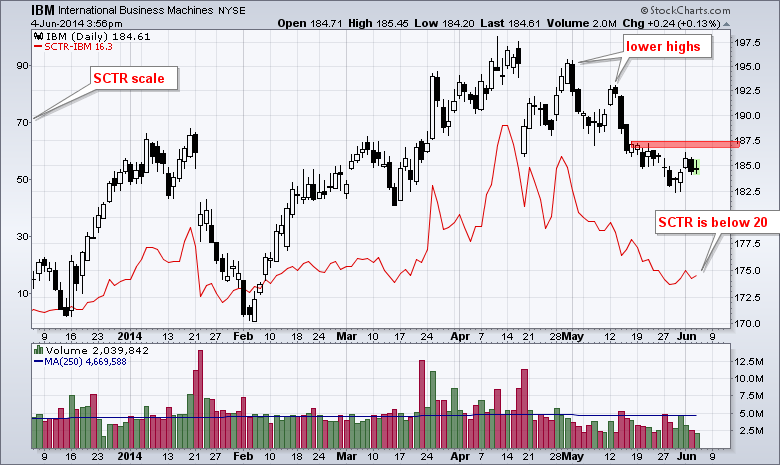
Dow Hits New High without Big Blue
by Arthur Hill,
Chief Technical Strategist, TrendInvestorPro.com
The Dow Industrials hit another new high this week, but IBM did not help the cause and remains well below its mid April high. This means IBM shows relative weakness, which is confirmed by the StockCharts Technical Rank (SCTR). The SCTR (red line) is below 20 and has spent most...
READ MORE
MEMBERS ONLY
Stocks Start Outperforming Bonds as TLT Tests Support
by Arthur Hill,
Chief Technical Strategist, TrendInvestorPro.com
Stocks put in a lackluster performance as the market awaits a data deluge in the coming days. We have the ADP Employment Report, Fed Beige Book and ISM Services today. Initial Claims and the European Central Bank (ECB) meeting are Thursday. And, of course, Friday is non-farm payrolls. Automakers...
READ MORE
MEMBERS ONLY
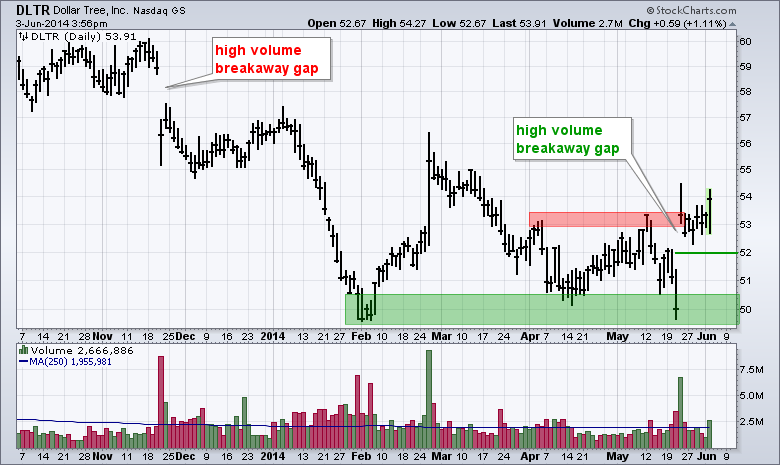
Dollar Tree Holds the Breakaway Gap
by Arthur Hill,
Chief Technical Strategist, TrendInvestorPro.com
The Dollar Tree chart shows two breakaway gaps in opposite directions. The first breakaway gap occurred in November and started a downtrend. The second breakaway gap occurred in late May and held for over a week. Like the November gap, this gap occurred on high volume and could signal the...
READ MORE
MEMBERS ONLY
KRE Challenges Resistance as TLT Plunges to Trend Line Support
by Arthur Hill,
Chief Technical Strategist, TrendInvestorPro.com
Stocks put in a mixed performance on Monday with large-caps and mid-caps edging higher, and small-caps moving lower. The gains and losses were contained and not enough to affect the short-term trends. Five of the nine sector SPDRs were up, but the gains and losses were...
READ MORE
MEMBERS ONLY
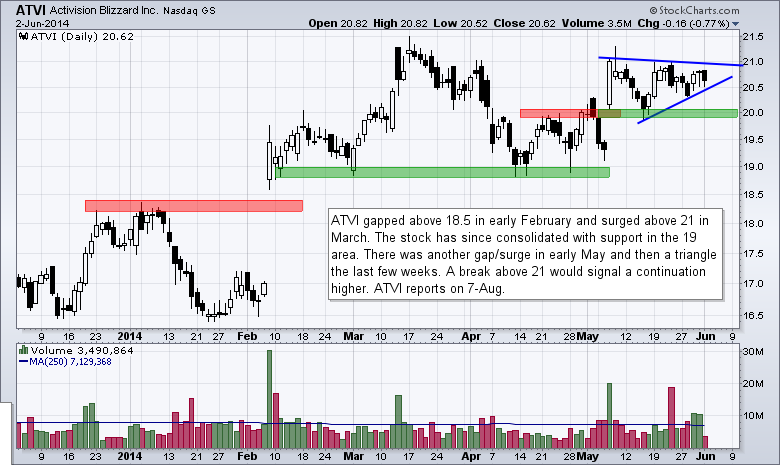
Chart Setups: ATVI, ANF, LB, MOS, NYT
by Arthur Hill,
Chief Technical Strategist, TrendInvestorPro.com
Today's charts feature five setups. A video game maker is consolidating within an uptrend. A teen apparel retailer triggered a bear trap after a failed support break. A women's apparel retailer is consolidating after a gap-reversal. A fertilizer company formed a big bullish continuation pattern....
READ MORE
MEMBERS ONLY
Gannet Leads Large-caps SCTR Gainers with a Big Gap
by Arthur Hill,
Chief Technical Strategist, TrendInvestorPro.com
Looking for relative performance leaders? Look no further than the StockCharts home page and the top SCTR movers. The StockCharts Technical Rank (SCTR) tables can be found on the home page near the bottom. Click the "top up" tab to see the biggest gainers and "top down&...
READ MORE
MEMBERS ONLY
SPY and TLT Hit New Highs ahead of Big Economic Week
by Arthur Hill,
Chief Technical Strategist, TrendInvestorPro.com
The S&P 500 SPDR and 20+ YR T-Bond ETF extended their uptrends with new highs last week, but this positive correlation could get a big test with a full economic docket this week. The Dow Diamonds, Nasdaq 100 ETF, Equal-Weight S&P 500 ETF and...
READ MORE
MEMBERS ONLY
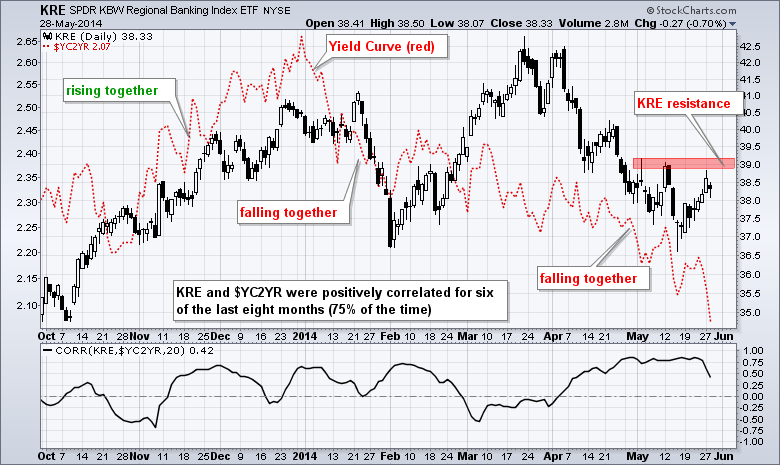
Regional Bank SPDR Continues to Track the Yield Spread
by Arthur Hill,
Chief Technical Strategist, TrendInvestorPro.com
While falling yields translate into lower borrowing costs for the borrower, they are not always positive for the lender. In particular, the recent decline in the 10-Year Treasury Yield ($TNX) caused the spread between the 10-year yield and the 2-year yield to narrow (red dashed line). The...
READ MORE