MEMBERS ONLY
The New Neutral is Well Underway
by Arthur Hill,
Chief Technical Strategist, TrendInvestorPro.com
Pimco's Bill Gross called his new secular investment theme "the new neutral". Gross expects slow economic growth and low real interest rates over the next five years, and this will fuel the hunt for yield. We can already see the hunt for yield playing out in...
READ MORE
MEMBERS ONLY
IWM Traces out Bearish Continuation Pattern
by Arthur Hill,
Chief Technical Strategist, TrendInvestorPro.com
Small-caps once again led the market lower with the Russell 2000 ETF and Russell MicroCap iShares losing over 1.5% on the day. The Dow Diamonds and S&P 500 SPDR held up relatively well and lost around .5% on Wednesday. The offensive sectors led lower with the consumer...
READ MORE
MEMBERS ONLY
Chart Setups: FB, FLIR, POOL, PTC, Z
by Arthur Hill,
Chief Technical Strategist, TrendInvestorPro.com
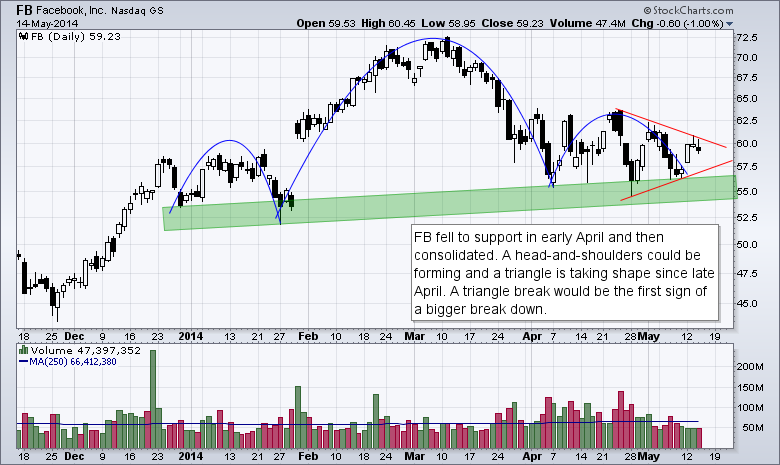
Today's charts feature five setups in various groups. Facebook, the king of social networking, has a big reversal pattern taking shape. Flir Systems fell sharply and then formed a bearish continuation pattern. SCP Pool is suffering long with housing stocks and formed rising flag the last few weeks....
READ MORE
MEMBERS ONLY
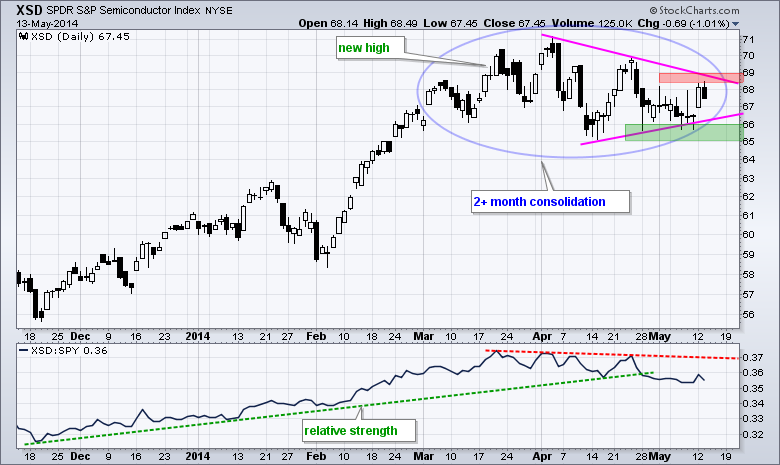
XSD Triangulates - UUP Breaks Free - TLT Bounces within Uptrend
by Arthur Hill,
Chief Technical Strategist, TrendInvestorPro.com
Stocks were mixed on Tuesday with the Russell 2000 ETF (IWM) falling around 1% and the S&P 500 SPDR (SPY) advancing .1% on the day. Eight of the nine sector SPDRs were up, and just one down. The gains were small with the Energy SPDR (XLE) leading the...
READ MORE
MEMBERS ONLY
SPY Challenges Prior High - GLD Remains with Bearish Pattern
by Arthur Hill,
Chief Technical Strategist, TrendInvestorPro.com
Stocks surged with a broad-based rally led by small-caps. The Russell 2000 ETF and the Russell MicroCap iShares gained over 2%, while the Dow Diamonds and S&P 500 SPDR gained less than 1%. It was a lopsided rally, but a little relative strength in small-caps is positive overall....
READ MORE
MEMBERS ONLY
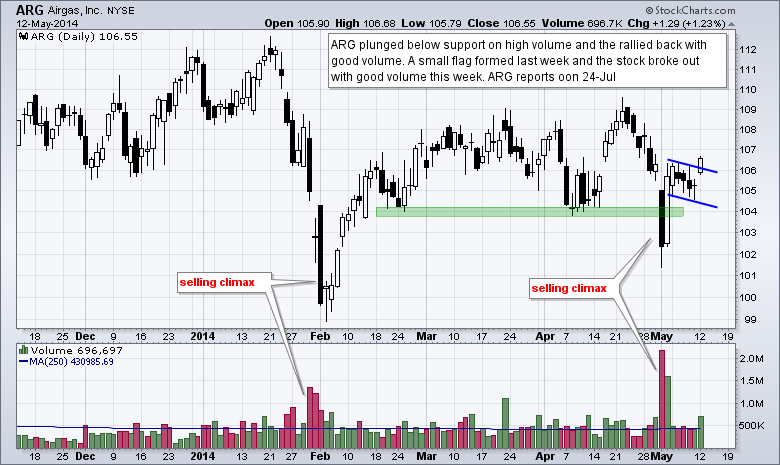
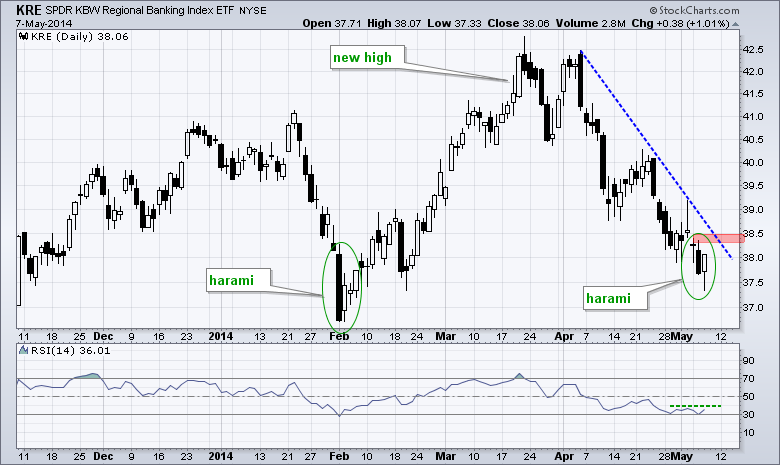
Charts: ARG, BBT, IMMR, JBP, UAL
by Arthur Hill,
Chief Technical Strategist, TrendInvestorPro.com
Today's charts feature five setups in various groups. Air Gas recovered from a support break and broke flag resistance. BB&T, a regional bank, held above its February low and bounced on good volume the last two days. Immersion continues to toy with support as it gapped...
READ MORE
MEMBERS ONLY
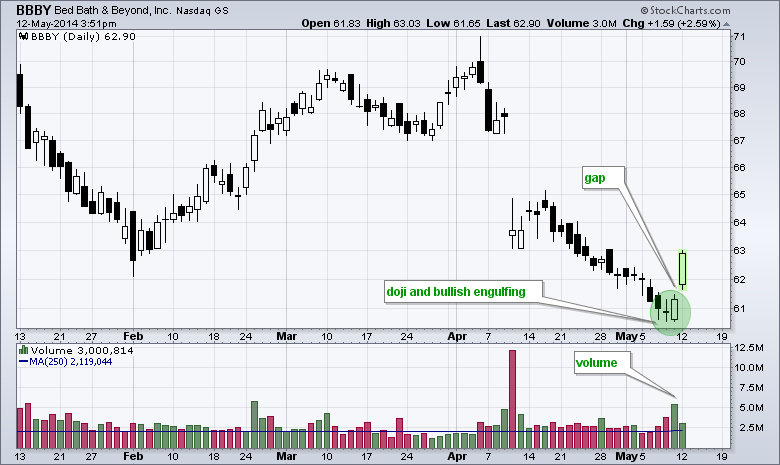
Bed Bath & Beyond Follows Bullish Candle with Gap
by Arthur Hill,
Chief Technical Strategist, TrendInvestorPro.com
Bed Bath & Beyond (BBBY), which is part of the important retail group, is showing strength with a gap and surge. Notice that this gap-surge came after the stock formed a doji and then a bullish engulfing. The doji signals indecision and the bullish engulfing is a bullish candlestick reversal...
READ MORE
MEMBERS ONLY
SPY Maintains Upward Bias - UUP Triggers a Bear Trap
by Arthur Hill,
Chief Technical Strategist, TrendInvestorPro.com
Not much happened in the stock market last week. The Dow Diamonds advanced .59%, the Nasdaq 100 ETF fell .79%, the S&P 500 SPDR decline just .05% and the Russell 2000 ETF lost 1.79%. The nine sector SPDRs were split with four up and five down. The...
READ MORE
MEMBERS ONLY
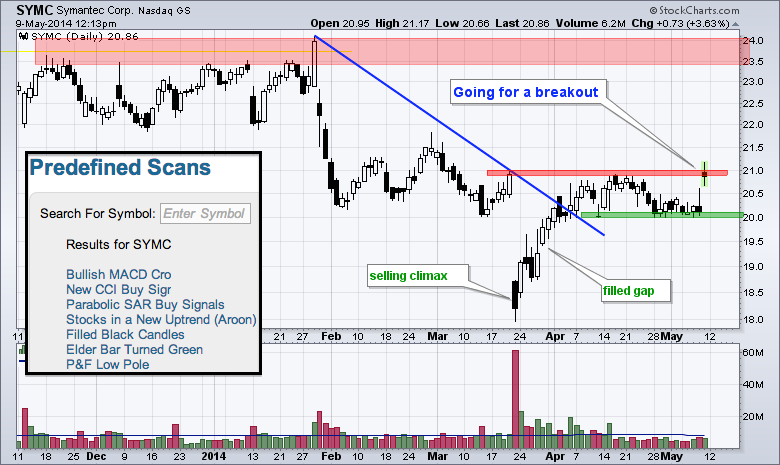
Symantec Goes for a Breakout With Multiple Scan Signals
by Arthur Hill,
Chief Technical Strategist, TrendInvestorPro.com
Symantec is popping after reporting earnings on Thursday. The chart below shows the stock with a selling climax in mid March, a recovery into early April and a consolidation the last few weeks. With today's gap, the stock is on the verge of a consolidation breakout. The left...
READ MORE
MEMBERS ONLY
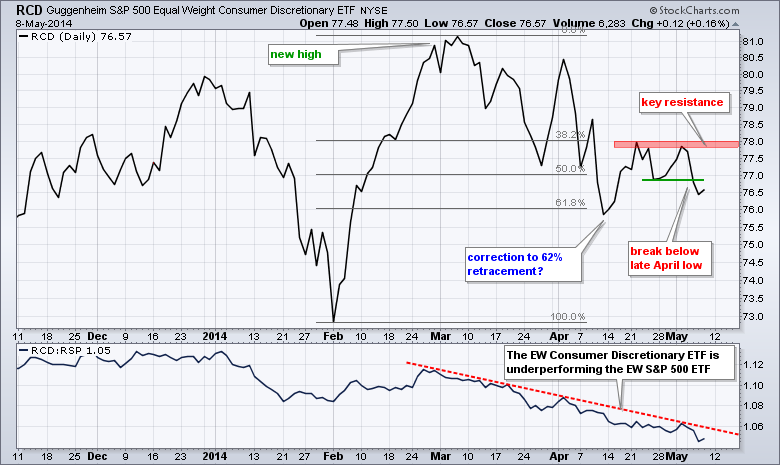
QQQ Holds Wedge Break - Consumer Discretionary Weighs on Market
by Arthur Hill,
Chief Technical Strategist, TrendInvestorPro.com
The bulls tried to rally the market in early trading, but the early gains failed to hold as stocks moved lower in the afternoon. Once again, the Russell 2000 ETF and Russell MicroCap iShares led the way lower. The Nasdaq 100 ETF, Dow Diamonds and S&P 500 SPDR...
READ MORE
MEMBERS ONLY
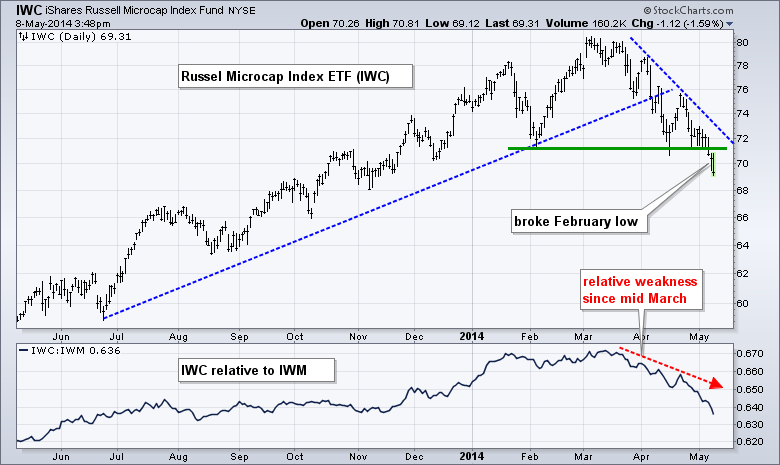
Russell MicroCap iShares Underperforms Russell 2000 ETF
by Arthur Hill,
Chief Technical Strategist, TrendInvestorPro.com
Small-caps are underperforming large-caps and microcaps are underperforming small-caps. Microcaps are similar to the momentum names in that they represent the high beta end of the stock market. The chart below shows the Russell MicroCap iShares (IWC) breaking below its February low with a 14% decline. The indicator window shows...
READ MORE
MEMBERS ONLY
SPY Forms Bull Flag - GLD Forms Bearish Continuation Pattern
by Arthur Hill,
Chief Technical Strategist, TrendInvestorPro.com
Stocks opened weak, firmed and rallied into the close. The major index ETFs finished with modest gains, but the Nasdaq 100 ETF closed slightly lower. The Finance SPDR and Utilities SPDR led the sectors higher. The Consumer Discretionary SPDR fell as the Retail SPDR declined around 1%. Weakness in retail...
READ MORE
MEMBERS ONLY
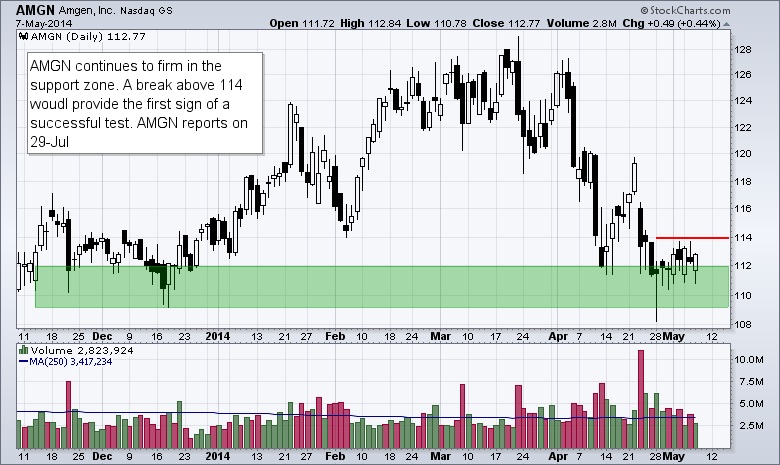
Chart Setups: AMGN, AXP, MSFT, PBCT, RF, TTGT
by Arthur Hill,
Chief Technical Strategist, TrendInvestorPro.com
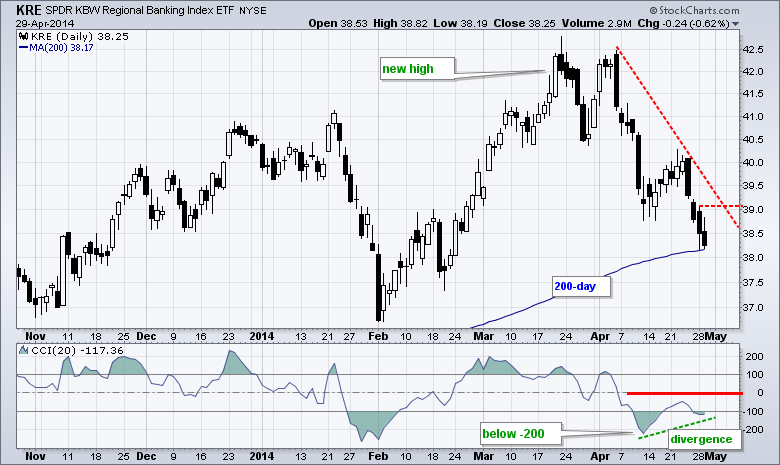
Today charts feature three stocks from the finance sector, two from the tech sector and a biotech. Buying pressure is showing up in American Express over the last three days. Regional banks PBCT and RF are firming at key retracement. Microsoft formed a bullish candlestick in a support zone. Target...
READ MORE
MEMBERS ONLY
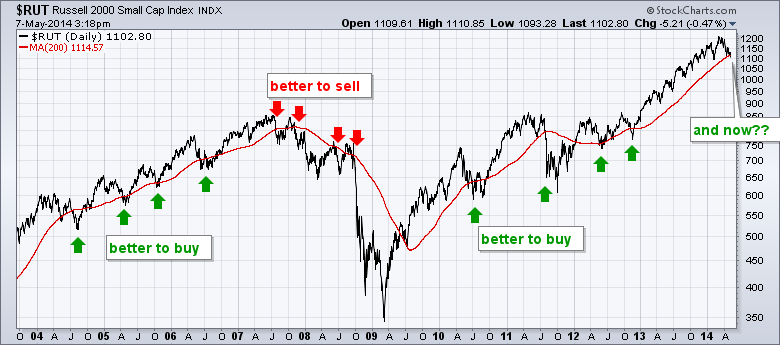
Russell 2000 Breaks 200-day. Is it a Buy Signal or Sell Signal?
by Arthur Hill,
Chief Technical Strategist, TrendInvestorPro.com
For the first time in over a year, the Russell 2000 closed below its 200-day moving average. This may seem like a long-term sell signal, but it really depends on the bigger trend. Notice how one would have been better off buying on breaks below the 200-day in 2004, 2005...
READ MORE
MEMBERS ONLY
SPY Breaks Trend line as QQQ Tests Wedge Support
by Arthur Hill,
Chief Technical Strategist, TrendInvestorPro.com
After opening weak and recovering on Monday, stocks opened slightly lower and declined on Tuesday. I consider a weak open and steady decline more negative because it suggests consistent selling pressure. The Russell 2000 ETF (IWM) and Russell MicroCap iShares (IWC) led the market lower. Relative weakness in small and...
READ MORE
MEMBERS ONLY
SPY Holds Breakout as XLF Recovers after Weak Open
by Arthur Hill,
Chief Technical Strategist, TrendInvestorPro.com
The major index ETFs opened weak, but firmed in the first thirty minutes and bounced to close virtually unchanged. The overall results were mixed with the Nasdaq 100 ETF advancing .53% on the day and the Russell 2000 ETF (IWM) closing .12% lower. Despite mixed results at the end, it...
READ MORE
MEMBERS ONLY
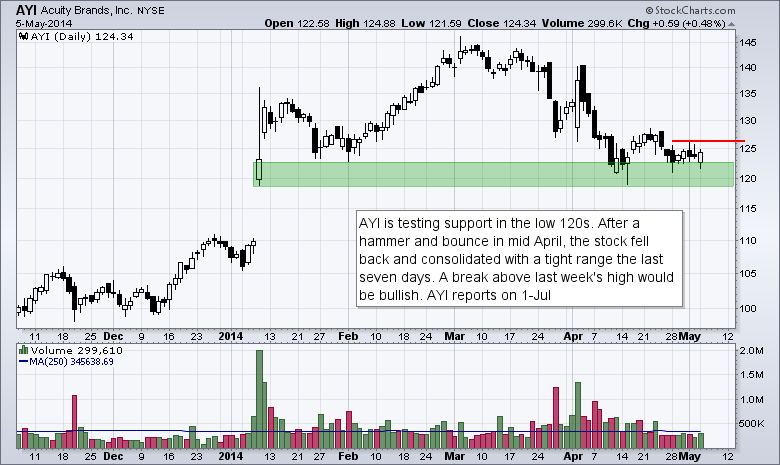
Charts: AYI, BMY, FLEX, UNH, USB
by Arthur Hill,
Chief Technical Strategist, TrendInvestorPro.com
AYI Tests Support Zone.
BMY Bounces off Big Support.
FLEX Forms Big Bull Flag.
UNH Firms with Large Spinning Top.
USB Finds Support near Key Retracement.
Video is not available at the moment because we moved to a new blogging platform over the last few days. We are working on...
READ MORE
MEMBERS ONLY
GLD Goes for a Breakout as TLT Hits a New High
by Arthur Hill,
Chief Technical Strategist, TrendInvestorPro.com
Nothing much changed last week. SPY broke flag resistance and continued to lead the major index ETFs. IWM remains in a downtrend and formed a rising wedge, which could be a bearish continuation pattern. The markets shrugged off good economic news and closed weak on Friday. Perhaps Ukraine fears kept...
READ MORE
MEMBERS ONLY
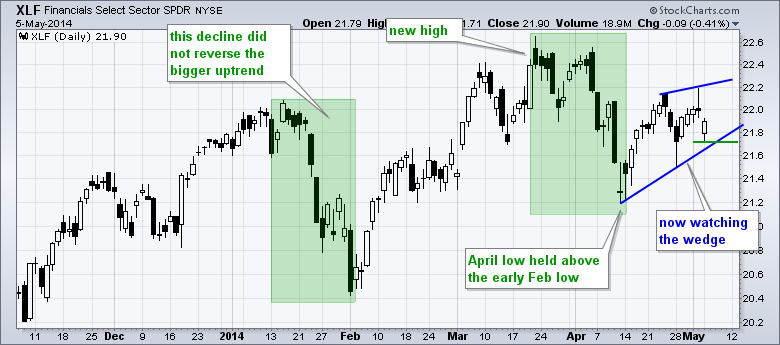
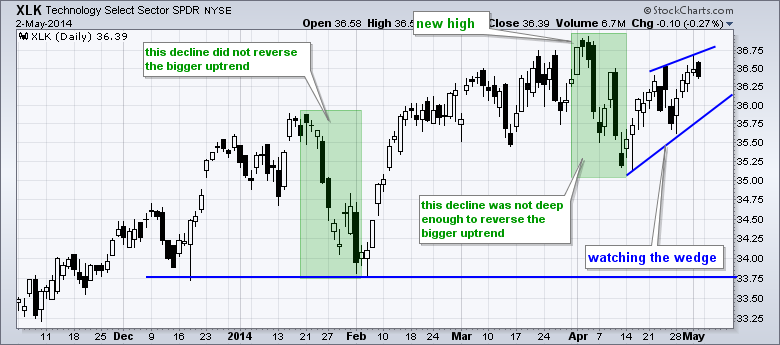
Watching the Wedges in Finance and Technology
by Arthur Hill,
Chief Technical Strategist, TrendInvestorPro.com
The Technology SPDR (XLK) and the Finance SPDR (XLF) remain in uptrends overall, but Friday's intraday reversal could signal a near term peak and result in a bearish wedge. The first chart shows XLK hitting a new high in early April and then declining below 35.25 with...
READ MORE
MEMBERS ONLY
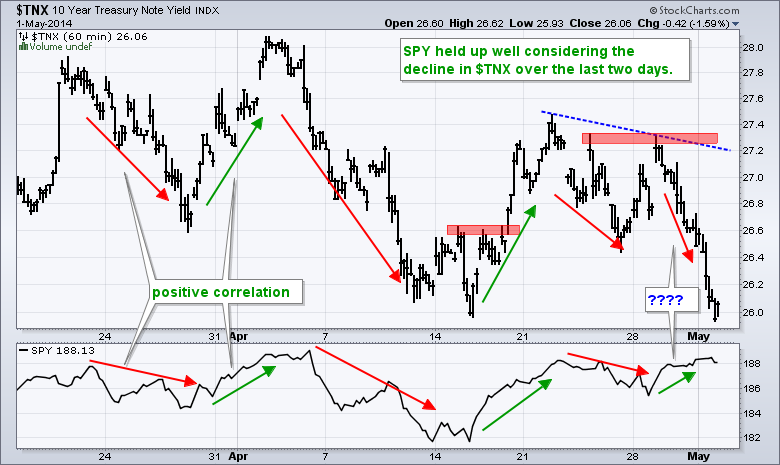
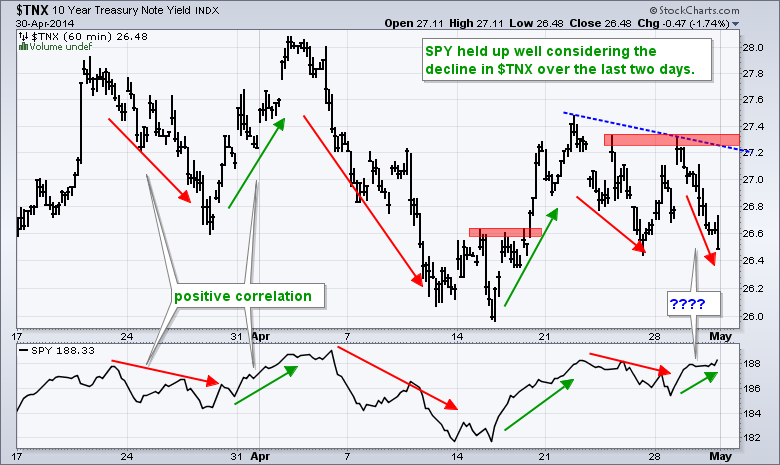
Gold and the 10-Yr T-Yield Test their April Lows
by Arthur Hill,
Chief Technical Strategist, TrendInvestorPro.com
There is no change on the charts as the current patterns held up. SPY and QQQ have flag breakouts, while IWM is bouncing within a downtrend. IWM could be forming a bear flag/wedge over the last few days. Treasuries surged this week as the 10-YR Treasury Yield ($TNX) fell...
READ MORE
MEMBERS ONLY
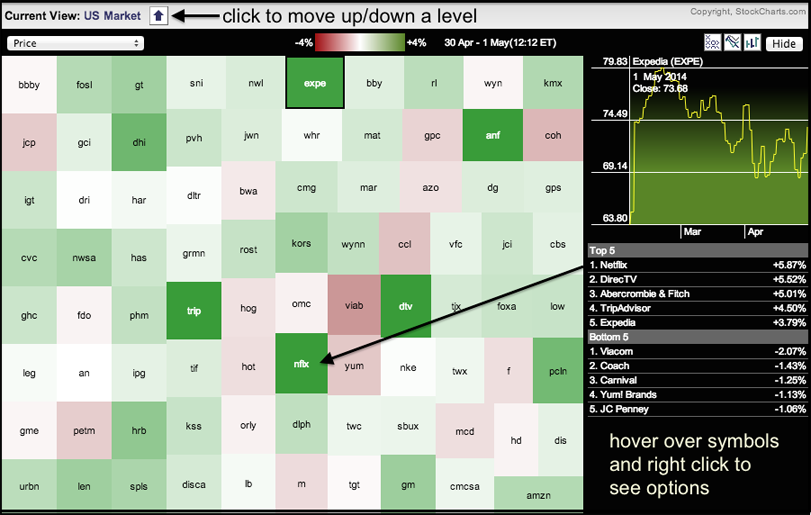
Netflix, DirectTV and Abercrombie Lead Consumer Discretionary Sector
by Arthur Hill,
Chief Technical Strategist, TrendInvestorPro.com
The Consumer Discretionary SPDR (XLY) was leading the sectors at midday on Thursday. Trading in general was rather lackluster, but it is still positive to see some leadership from this economically sensitive sector. The Market Carpet below shows Netflix (NFLX), DirecTV (DTV), Abercrombie (ANF), TripAdvisor (TRIP) and Expedia (EXPE) leading...
READ MORE
MEMBERS ONLY
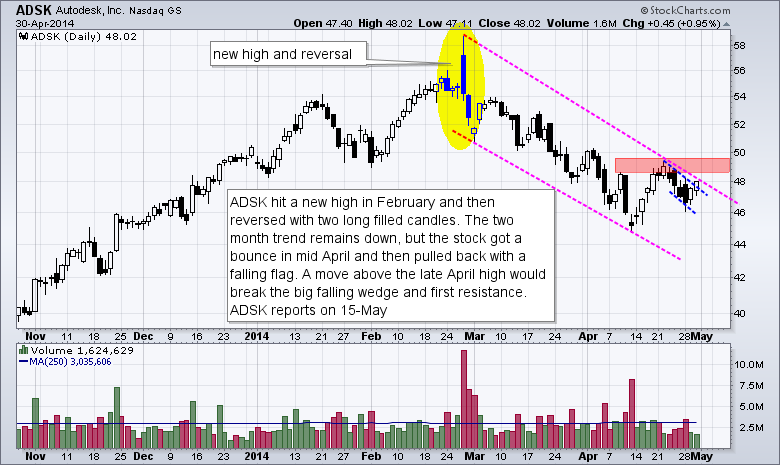
Charts: ADSK, DDD, ISIL, ITRI, PVH
by Arthur Hill,
Chief Technical Strategist, TrendInvestorPro.com
ADSK Corrects after Strong Advance
DDD Firms at long-term Support
ISIL Breaks Out after Earnings
ITRI Tests Island Reversal Zone
PVH Breaks Flag Resistance
Video is not available at the moment because we moved to a new blogging platform over the last few days. We are working on the technical...
READ MORE
MEMBERS ONLY
UUP Tests Support as GLD Stalls at Key Level
by Arthur Hill,
Chief Technical Strategist, TrendInvestorPro.com
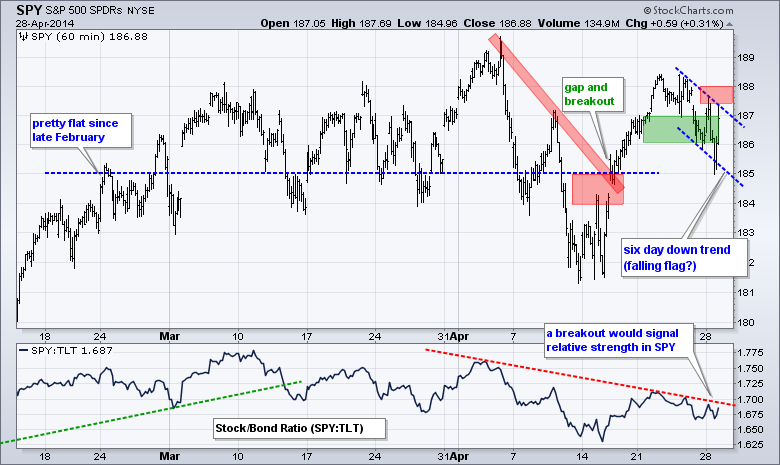
Trading remains mixed as the market awaits the employment report on Friday, or perhaps jobless claims today. Despite a mixed market, the S&P 500 SPDR and Dow Diamonds continue to behave and act like they want to move higher. The Nasdaq 100 ETF also has a flag breakout...
READ MORE
MEMBERS ONLY
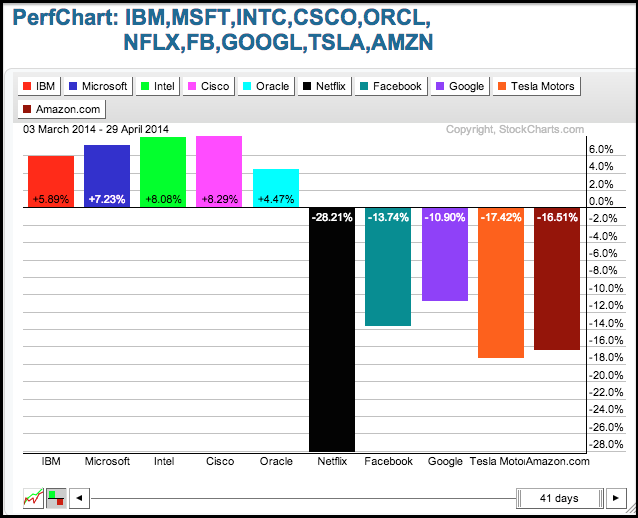
Old Tech Whips Up on New Tech
by Arthur Hill,
Chief Technical Strategist, TrendInvestorPro.com
The S&P 500 is up around 1.75% over the last two months, but the Nasdaq is down around 4%. Part of the reason for this discrepancy can be found in the performance of ten key tech stocks. The PerfChart below shows IBM, Microsoft, Intel, Cisco and Oracle...
READ MORE
MEMBERS ONLY
IWM Continues to Lag - GLD Hits Moment-of-Truth
by Arthur Hill,
Chief Technical Strategist, TrendInvestorPro.com
The major index ETFs closed with small gains as the market treaded water ahead of today's FOMC statement. These gains were enough to produce flag breakouts in QQQ and SPY. IWM remains in a downtrend and small-caps continue to hold the market back. Some of the beaten-down high-beta...
READ MORE
MEMBERS ONLY
QQQ and SPY Forms Small Bull Flags
by Arthur Hill,
Chief Technical Strategist, TrendInvestorPro.com
It was a volatile and mixed day on Monday. The Dow Diamonds (DIA) closed a half percent higher to lead the major index ETFs, while the Russell 2000 ETF (IWM) closed .58% lower on the day. The sectors were mixed with technology, healthcare and consumer staples leading on the upside....
READ MORE
MEMBERS ONLY
Charts: AMGN, BTU, EXPD, GOOGL, LEN
by Arthur Hill,
Chief Technical Strategist, TrendInvestorPro.com
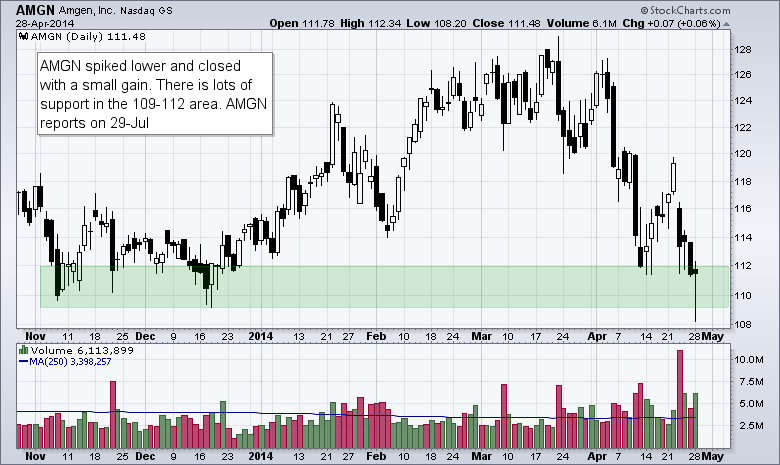
AMGN Spikes Near Support.
BTU Breaks HS Resistance with Volume.
Plus $EXPD, $GOOGL and $LEN
VIdeo is unavailable while we work on a new interface.
This chart analysis is for educational purposes only, and should notbe
construed as a recommendation to buy, sell or sell-short said securities
This commentary and...
READ MORE
MEMBERS ONLY
SPY Holds Support - UUP Consolidates after Bounce
by Arthur Hill,
Chief Technical Strategist, TrendInvestorPro.com
Stocks sold off on Friday, but the long-term trends remain up. We cannot forget about the long-term trend because it is the bigger force. In other words, IWM and QQQ may be in downtrends since early March, but these downtrends are still considered corrections within bigger uptrends. Yes, relative weakness...
READ MORE
MEMBERS ONLY
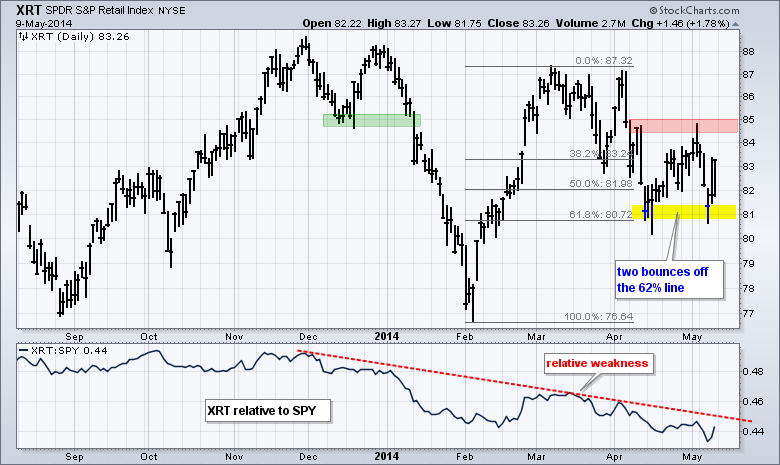
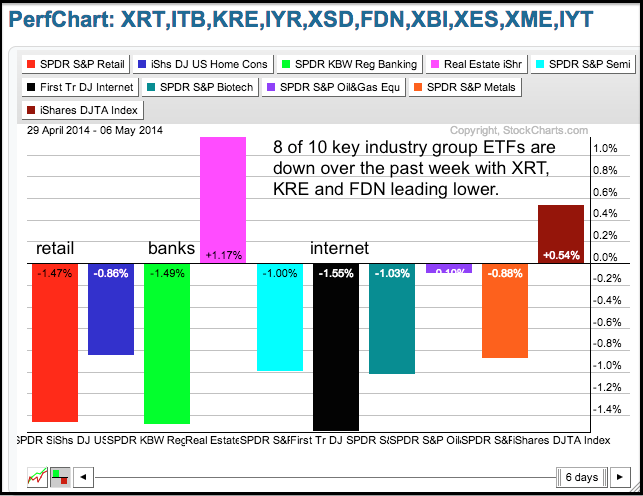
The Big Split Among Ten Key Industry Group ETFs
by Arthur Hill,
Chief Technical Strategist, TrendInvestorPro.com
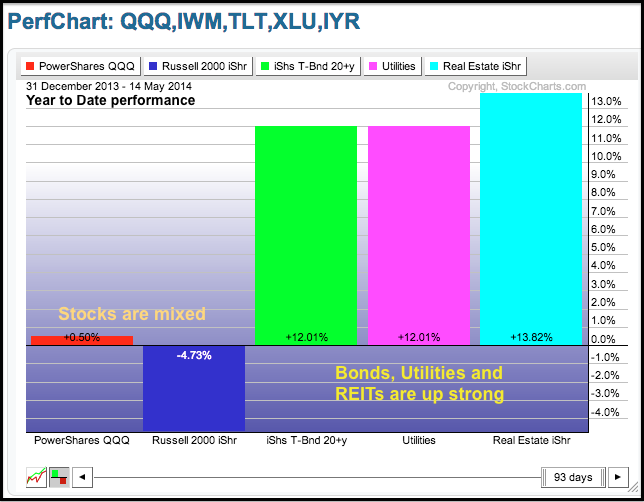
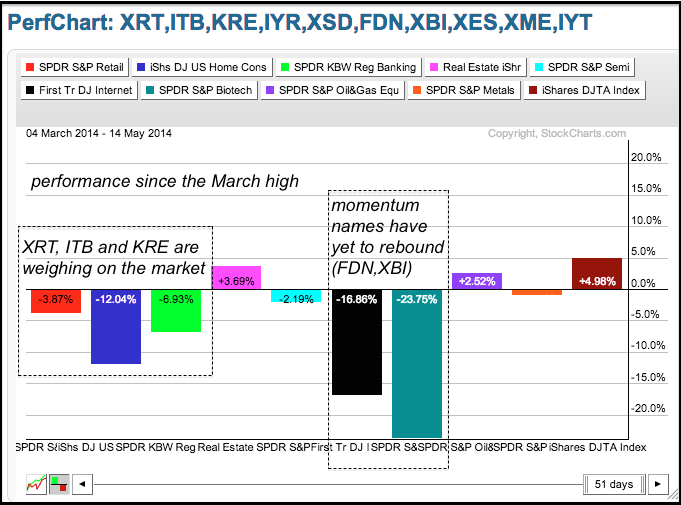
The S&P 500 is up 1.64% year-to-date and the Russell 2000 is down 1.66%. This market splits is also reflected in year-to-date performance for ten key industry group ETFs. Notice that five are up and five are down. The Retail SPDR (XRT), Home Construction iShares (ITB)...
READ MORE
MEMBERS ONLY
IWM and QQQ Hit Key Retracement Levels
by Arthur Hill,
Chief Technical Strategist, TrendInvestorPro.com
Stocks have traded in mixed fashion for several weeks now. DIA, SPY and RSP are flat since early March, but QQQ and IWM are down. Relative weakness in small-caps and large-techs is a concern, but we have yet to see a breakdown in the broader market. Relative weakness in the...
READ MORE
MEMBERS ONLY
StockCharts Technical Rank Surges for Juniper Networks
by Arthur Hill,
Chief Technical Strategist, TrendInvestorPro.com
Juniper Networks (JNPR) is making waves because its StockCharts Technical Rank (SCTR) surged above 80 with one of the biggest SCTR gains among large-caps. Chartists can access the SCTR tables in the lower half of the home page. Click on "top up" to find the biggest SCTR gainers...
READ MORE
MEMBERS ONLY
USO Tests Support as TLT Rebounds
by Arthur Hill,
Chief Technical Strategist, TrendInvestorPro.com
Stocks took a breather with techs leading the market lower on Tuesday. Relative weakness in techs may not last long because the Technology SPDR (XLK) and the Nasdaq 100 ETF (QQQ) are poised to open sharply higher on the heels of Facebook and Apple. Elsewhere, the Home Construction iShares (ITB)...
READ MORE
MEMBERS ONLY
Charts: ANF, BAC, C, JPM, SYMC
by Arthur Hill,
Chief Technical Strategist, TrendInvestorPro.com
ANF Follows Up on Hammer.
BAC Firms in Support Zone.
Plus C, JPM, SYMC
Individual charts are below video.
Sorry but your browser doesn't support HTML5 video.
**This chart analysis is for educational purposes only, and should not
be construed as a recommendation to buy, sell or sell-short...
READ MORE
MEMBERS ONLY
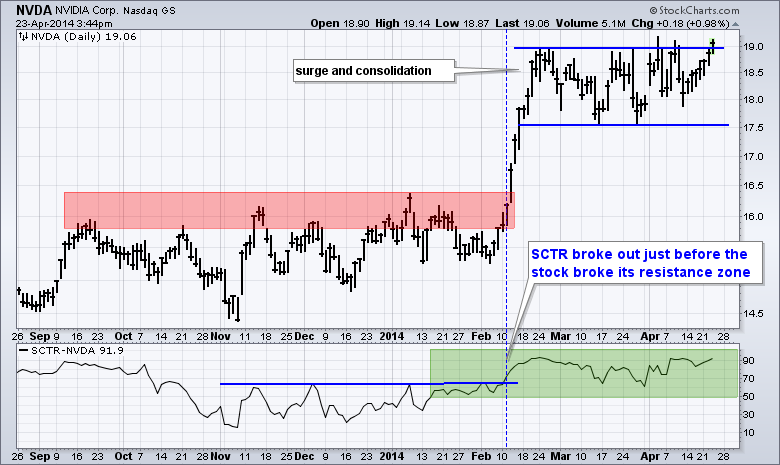
Nvidia Goes for a Flag Breakout
by Arthur Hill,
Chief Technical Strategist, TrendInvestorPro.com
Nvidia (NVDA) is showing relative strength as it breaks above consolidation resistance. The chart below shows the stock surging and then moving into a trading range that looks like a flat flag. A breakout here would signal a continuation higher. The indicator window shows the StockCharts Technical Rank (SCTR) above...
READ MORE
MEMBERS ONLY
Breadth Indicators Hit New Highs - Gold Follows the Euro
by Arthur Hill,
Chief Technical Strategist, TrendInvestorPro.com
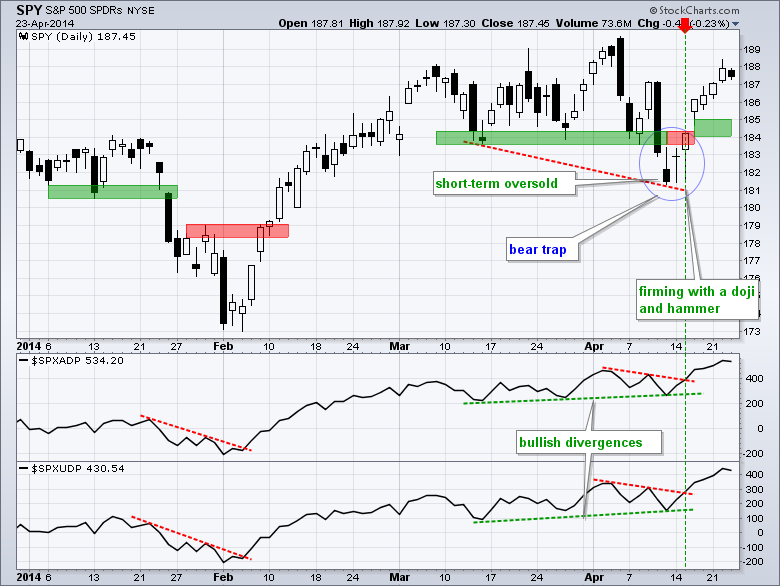
After becoming short-term oversold on 10-11 April, stocks firmed Monday-Tuesday last week and started a rally on Wednesday-Thursday. This short-term upswing continued this week with both QQQ and SPY advancing six days straight. On the breadth charts below, notice that the AD Line and AD Volume Line for the S&...
READ MORE
MEMBERS ONLY
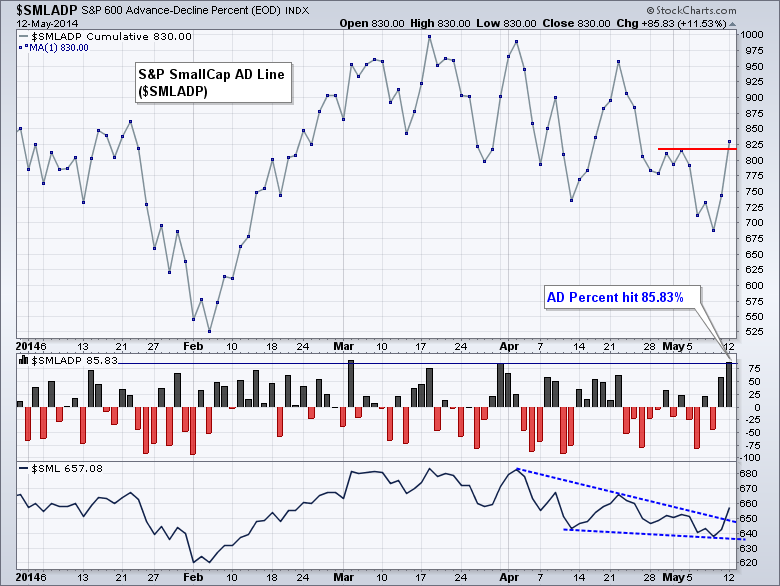
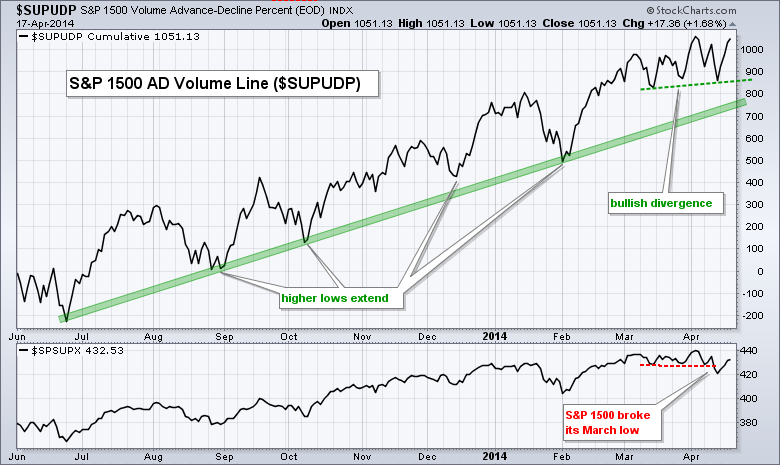
A Key Breadth Indicator Holds Strong During April Dip
by Arthur Hill,
Chief Technical Strategist, TrendInvestorPro.com
The AD Volume Line held strong during the April pullback and formed a small bullish divergence over the last few weeks. The AD Volume Line is a cumulative measure of AD Volume Percent, which is advancing volume less declining volume divided by total volume. In this example, we are looking...
READ MORE
MEMBERS ONLY
On Leave for Two Weeks
by Arthur Hill,
Chief Technical Strategist, TrendInvestorPro.com
I am on a family vacation until April 18th and Art's Charts will be on hiatus for the next two weeks. The next Art's Charts will be published on Monday, April 21st. Thanks for your understanding....
READ MORE
MEMBERS ONLY
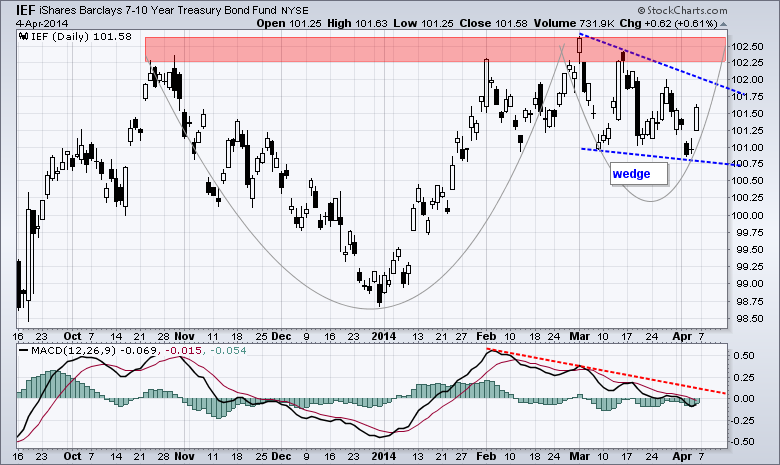
Bullish Bond Patterns Could Foreshadow Stock Market Correction
by Arthur Hill,
Chief Technical Strategist, TrendInvestorPro.com
The 7-10 YR T-Bond ETF (IEF) is tracing out two potentially bullish patterns and chartists should watch these patterns for clues on the stock market. The chart below shows IEF hitting resistance in the 102.25-102.5 area and then correcting with a falling wedge. With Friday's big...
READ MORE
MEMBERS ONLY
Apple Fails to Hold Triangle Breakout
by Arthur Hill,
Chief Technical Strategist, TrendInvestorPro.com
Apple (AAPL) appeared to be breaking out with a surge above triangle resistance in late March, but this breakout failed as the stock reversed in the trend line zone and broke back below 535 on Friday. Sometimes a failed signal is as value as a signal. In other words, this...
READ MORE
MEMBERS ONLY
Gold Miners ETF Hits Critical Juncture near Two Key Moving Averages
by Arthur Hill,
Chief Technical Strategist, TrendInvestorPro.com
After breaking the 200-day and 50-day moving averages with a sharp decline, the Gold Miners ETF (GDX) consolidated with a small pennant. Notice that this consolidation is occurring near the 62% retracement and early February lows. This puts GDX at a critical juncture. A break below support would signal a...
READ MORE