MEMBERS ONLY
Charts: BBRY, CTXS, DE, FTI, HLF, PMCS
by Arthur Hill,
Chief Technical Strategist, TrendInvestorPro.com
BBRY Forms Flag after High Volume Gap.
CTXS Surges and Forms Tight Consolidation.
Plus DE, FTI, HLF, PMCS
Individual charts are below video.
Sorry but your browser doesn't support HTML5 video.
**This chart analysis is for educational purposes only, and should not
be construed as a recommendation to...
READ MORE
MEMBERS ONLY
SPY and IMW Affirm Support with Bounces
by Arthur Hill,
Chief Technical Strategist, TrendInvestorPro.com
Stocks started the day under selling pressure, but firmed around midday and bounced in the afternoon. Even though the bounce was not that strong, it was positive to see stocks recover after the initial decline. Stock futures are sharply higher this morning and it looks like the situation in Ukraine...
READ MORE
MEMBERS ONLY
A Rounding Bottom Takes Shape for CORN
by Arthur Hill,
Chief Technical Strategist, TrendInvestorPro.com
The Corn Trust ETF (CORN) sports a rounding bottom and breakout over the last few months. The rounding bottom extends from mid November to the end of February with a big bullish engulfing in the middle. The breakout is still a work in progress as CORN stalls with a flat...
READ MORE
MEMBERS ONLY
Bonds Start Outperforming Stocks
by Arthur Hill,
Chief Technical Strategist, TrendInvestorPro.com
The Russian-Ukraine situation is affecting the markets this morning. Stocks are down in pre-market, the Euro is down and the Yen is down. Even though the Dollar is up, gold and oil are trading sharply higher, as is Natural Gas. European supply disruptions are likely because around half of Russian...
READ MORE
MEMBERS ONLY
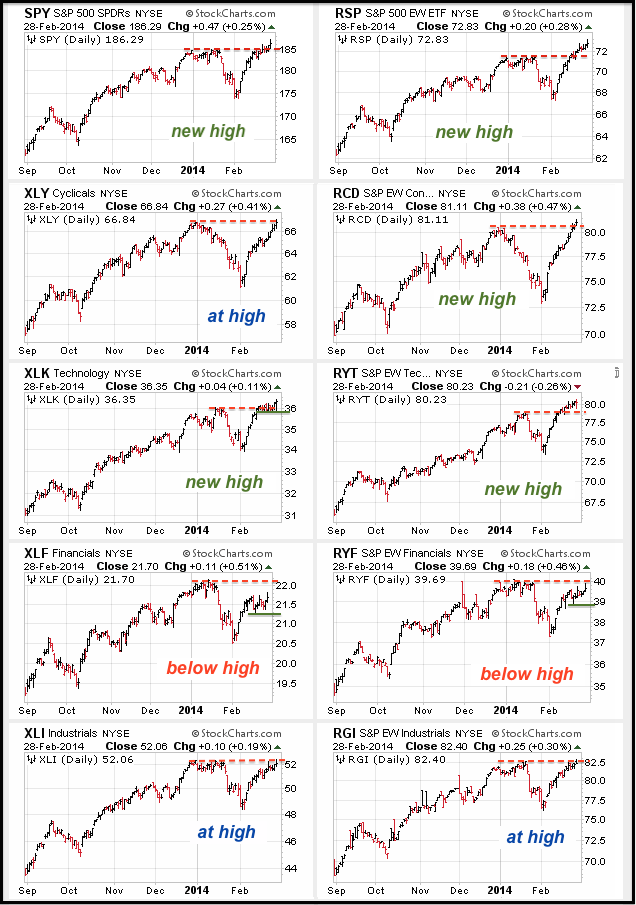
Finance Sector Lags as Consumer Discretionary Catches Up
by Arthur Hill,
Chief Technical Strategist, TrendInvestorPro.com
The market can be divided into nine sectors using the S&P Sector SPDRs and the Rydex Equal-weight Sector ETFs. These sectors can be subsequently divided into three groups: offensive, defensive and other. Technology, finance, consumer discretionary and industrials make up the offensive group, which is key to a...
READ MORE
MEMBERS ONLY
National Oilwell Varco and Two Others Make Big Moves in Relative Strength
by Arthur Hill,
Chief Technical Strategist, TrendInvestorPro.com
The first image shows a screen shot from the StockCharts Technical Rank (SCTR) sorted by change to highlight the biggest movers. Three of these show big moves from relatively low levels (TGT,EW,NOV). Big moves mean something is happening and we should check the charts. The second image shows...
READ MORE
MEMBERS ONLY
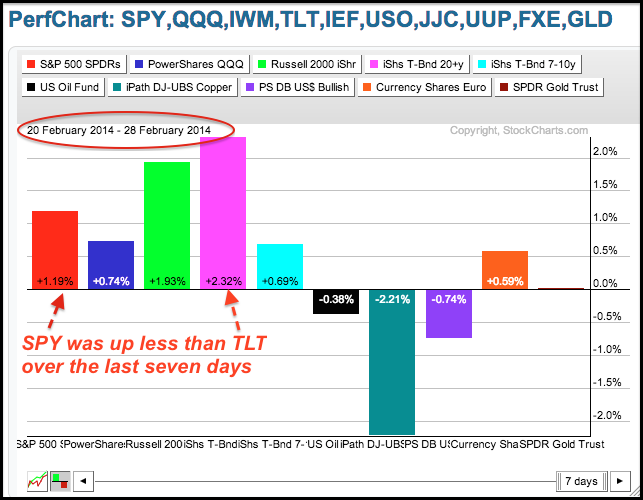
Stocks, and Bonds, Have A Good Week
by Arthur Hill,
Chief Technical Strategist, TrendInvestorPro.com
Buying pressure continues to outpace selling pressure as the major index ETFs moved higher on Thursday. The Russell MicroCap iShares (IWC) led the way with a .88% gain. The Russell 2000 ETF (IWM) is leading the major index ETFs with a 2.33% gain over the past week. Among the...
READ MORE
MEMBERS ONLY
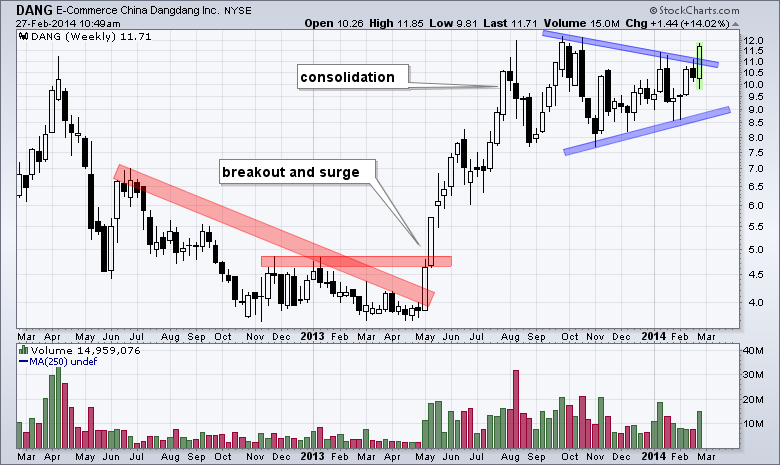
Chinese E-Commerce Stock Goes for a Breakout
by Arthur Hill,
Chief Technical Strategist, TrendInvestorPro.com
Shares of Dangdang ($DANG) are making a big move this month with a triangle breakout on expanding volume. First, notice how the stock surged from ~4 to ~12. Second, the triangle consolidation worked off overbought conditions. Third, the high volume breakout signals a continuation of this advance. Careful with this...
READ MORE
MEMBERS ONLY
Charts: AOL, FDX, JDSU, PAYX, UPS
by Arthur Hill,
Chief Technical Strategist, TrendInvestorPro.com
AOL Firms at Support.
FDX Extends Flag.
Plus JDSU, PAYX, UPS
Individual charts are below video.
Sorry but your browser doesn't support HTML5 video.
**This chart analysis is for educational purposes only, and should not
be construed as a recommendation to buy, sell or sell-short said securities**
This...
READ MORE
MEMBERS ONLY
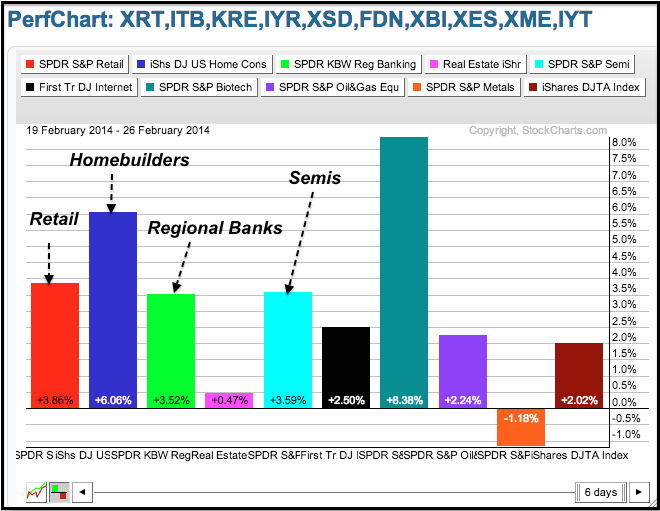
Small-caps, Homebuilders and Retailers Lead - As Do Treasuries
by Arthur Hill,
Chief Technical Strategist, TrendInvestorPro.com
Stocks continued their meandering ways with the Nasdaq 100 ETF (QQQ) edging lower and the Russell 2000 ETF (IWM) edging higher. There were, however, some significant movers that support overall market strength. IWM hit a new high and led the market (small-caps). The Retail SPDR (XRT) extended its run and...
READ MORE
MEMBERS ONLY
Treasuries Bounce, but Stocks Remain Strong
by Arthur Hill,
Chief Technical Strategist, TrendInvestorPro.com
Stocks meandered on Tuesday with some buying interest in the morning and selling pressure in the afternoon. The major index ETFs finished mixed with the Russell 2000 ETF (IWM) edging higher (.10%) and the S&P 500 SPDR (SPY) closing fractionally lower (-.04%). The sectors were also mixed...
READ MORE
MEMBERS ONLY
20+ YR T-Bond ETF Bounces off 200-day Moving Average
by Arthur Hill,
Chief Technical Strategist, TrendInvestorPro.com
Treasuries caught a bid as the 20+ YR T-Bond ETF (TLT) surged almost 1% and the 10-YR Treasury Yield ($TNX) fell back to 2.7%. Both are above their 200-day moving averages, but TLT is bouncing off the 200-day and $TNX falling towards the 200-day. Put another way, TLT successfully...
READ MORE
MEMBERS ONLY
Small-Caps Continue to Lead - Dollar Gets a Bounce
by Arthur Hill,
Chief Technical Strategist, TrendInvestorPro.com
Stocks started strong and remained strong most of the day, but selling pressure hit in the afternoon and stocks gave up some of their gains. The Russell 2000 ETF (IWM) led the way with a .73% gain and the Nasdaq 100 ETF (QQQ) advanced .64%. Seven of the nine sectors...
READ MORE
MEMBERS ONLY
Charts: BA, BZ, CYH, DSX, MED
by Arthur Hill,
Chief Technical Strategist, TrendInvestorPro.com
BA Hits Moment of Truth.
BZH Bounces off Key Retracement.
Plus CYH, DSX, MED
Individual charts are below video.
Sorry but your browser doesn't support HTML5 video.
**This chart analysis is for educational purposes only, and should not
be construed as a recommendation to buy, sell or sell-short...
READ MORE
MEMBERS ONLY
Asset Managers, Investment Services and Banks Lead Finance Sector
by Arthur Hill,
Chief Technical Strategist, TrendInvestorPro.com
The bulls lifted the Finance SPDR (XLF) with the DJ US Asset Managers Index, the DJ US Investment Services Index ($DJUSSB) and the DJ US Bank Index ($DJUSBK) leading the charge. All three were up more than 1%. Users can click on the industry names to see the stocks in...
READ MORE
MEMBERS ONLY
Small-Caps, Midcaps and Techs Lead the Way
by Arthur Hill,
Chief Technical Strategist, TrendInvestorPro.com
The major index ETFs dipped in the first half of the week and rebounded in the second half to extend their short-term uptrends. Even though these short-term uptrends look extended after sharp advances, there are no signs of weakness and the market is seeing strength in the right places. Also...
READ MORE
MEMBERS ONLY
Rydex Funds Highlight Industry Group Winners and Losers
by Arthur Hill,
Chief Technical Strategist, TrendInvestorPro.com
Stocks moved higher this week, but not all groups participated. As the Rydex industry fund MarketCarpet shows, the Financial Servives Fund (RYFIX) and the Banking Fund (RYKIX) declined and underperformed the market. On the leadership and relative strength side, the Biotech Fund (RYOIX) and the Healthcare Fund (RYHIX) show the...
READ MORE
MEMBERS ONLY
Key Tech Groups Hit New Highs - Small-Caps Perk Up
by Arthur Hill,
Chief Technical Strategist, TrendInvestorPro.com
Stocks pulled back for a day and then rebounded on Thursday with small-caps leading the way. All sectors were up, but the gains in three of the four offensive sectors were relatively muted. XLI led with a .94% gain, while XLK gained just .33%, XLY advanced .54% and XLF added...
READ MORE
MEMBERS ONLY
The Squeeze is on for Emcore Group $EMKR
by Arthur Hill,
Chief Technical Strategist, TrendInvestorPro.com
The Bollinger Bands are narrowing for Emcore (EMKR) as the stock moves into a tight consolidation. The indicator window confirms as BandWidth dipped to its lowest level in over six months. This volatility contraction could give way to a volatility expansion. A move above 5.05 would trigger an upside...
READ MORE
MEMBERS ONLY
Stocks, Gold and Bonds Decline after Fed Minutes
by Arthur Hill,
Chief Technical Strategist, TrendInvestorPro.com
Stocks started the week in strong uptrends, but were overbought after big moves in the first half of February. The release of the FOMC Minutes provided the trigger for some profit taking as stocks turned south in the afternoon. The declines, however, were relatively modest with the Nasdaq 100 ETF...
READ MORE
MEMBERS ONLY
Charts: AMZN, BTU, FDX, FIO, ITUB
by Arthur Hill,
Chief Technical Strategist, TrendInvestorPro.com
AMZN Underperforms with Pennant.
BTU Bounces with Good Volume.
Plus FDX, FIO, ITUB
Individual charts are below video.
Sorry but your browser doesn't support HTML5 video.
**This chart analysis is for educational purposes only, and should not
be construed as a recommendation to buy, sell or sell-short said...
READ MORE
MEMBERS ONLY
Intel Bounces on Low Volume and Underperforms
by Arthur Hill,
Chief Technical Strategist, TrendInvestorPro.com
The stock market surged over the last few weeks with the Nasdaq 100 leading the way. Intel also moved higher, but lagged as the price relative (INTC:$SPX ratio) hit a new low for the year this week. Also notice that the bounce occurred on very low volume and Intel...
READ MORE
MEMBERS ONLY
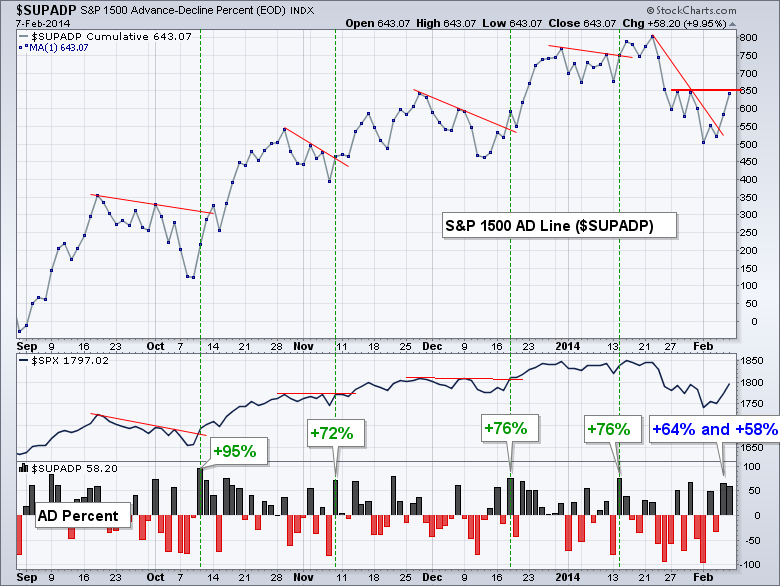
AD Line Hits New High as Small-Caps Perk Up
by Arthur Hill,
Chief Technical Strategist, TrendInvestorPro.com
Directional changes seem to be more important than magnitude indicators these days. It is not the first time, nor will it be the last. The advance over the last two weeks started with a seemingly meek reversal. Volume was low and breadth was not that impressive when the stock market...
READ MORE
MEMBERS ONLY
Google, Apple and Microsoft Power QQQ in February (video)
by Arthur Hill,
Chief Technical Strategist, TrendInvestorPro.com
The CandleGlance charts show the Nasdaq 100 ETF (QQQ) and its top five components (the video shows the top ten components). It is easy to see why QQQ is so strong. Google hit a new high above 1200 today, Apple is up 10% from its January low and Microsoft hit...
READ MORE
MEMBERS ONLY
QQQ Hits New High Even as TLT Bounces
by Arthur Hill,
Chief Technical Strategist, TrendInvestorPro.com
Stocks begin a four-day week in strong short-term uptrends that are quite extended. In just two weeks, SPY is up over 5.66%, QQQ is up 6.55% and IWM is up around 5%. Even though stocks are ripe for a short-term pullback or consolidation, the medium-term trends are up...
READ MORE
MEMBERS ONLY
Charts: APOL, BAC GES, MDR, RRD
by Arthur Hill,
Chief Technical Strategist, TrendInvestorPro.com
APOL Stalls after High Volume Decline.
BAC Holds Flag Break.
Plus GES, MDR, RRD
Individual charts are below video.
Sorry but your browser doesn't support HTML5 video.
**This chart analysis is for educational purposes only, and should not
be construed as a recommendation to buy, sell or sell-short...
READ MORE
MEMBERS ONLY
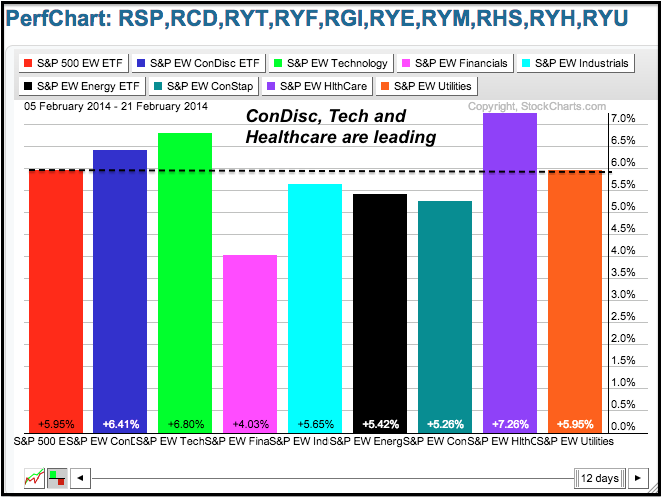
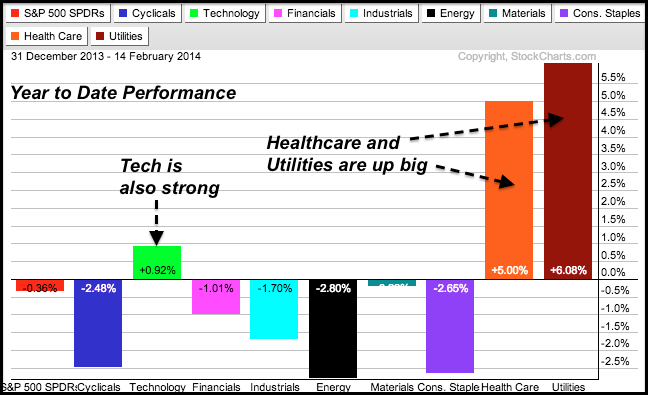
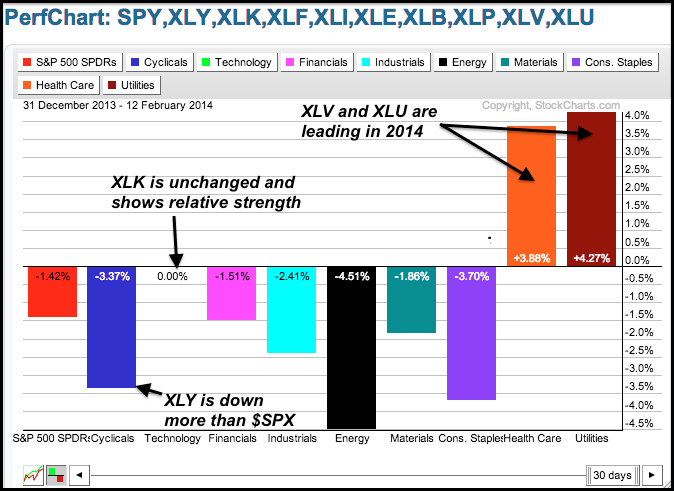
The S&P 500 is Flat this Year, but Three Sectors Rise Above
by Arthur Hill,
Chief Technical Strategist, TrendInvestorPro.com
Chartists can find sectors with consistent performance by analyzing PerfCharts across different timeframes. The three PerfCharts show different performance periods for the S&P 500 and the nine sector SPDRs. I am looking at year-to-date performance and then dividing 2014 into two parts. The first part covers the period...
READ MORE
MEMBERS ONLY
SCTRs Surge for HMO Stocks
by Arthur Hill,
Chief Technical Strategist, TrendInvestorPro.com
The StockCharts Technical Rank (SCTR) shows relative performance for the S&P 500 stocks, S&P SmallCap 600 and S&P MidCap 400. Stocks with the highest values show the most relative strength. The screenshot below shows the S&P 500 stocks with the biggest positive...
READ MORE
MEMBERS ONLY
QQQ Hits New High - Dollar Breaks Down
by Arthur Hill,
Chief Technical Strategist, TrendInvestorPro.com
Stocks opened weak after a decline in retail sales, but soon caught a bid and closed strong. Buying pressure in the face of negative news is positive for the stock market. Also note that stocks advanced even as the 20+ YR T-Bond ETF (TLT) moved higher. These two have been...
READ MORE
MEMBERS ONLY
Utilities are Leading the Market in 2014
by Arthur Hill,
Chief Technical Strategist, TrendInvestorPro.com
The screen shot below comes from a ChartList viewed in "summary" format using a one month price change. Overall, the market is quite mixed with five of the sector SPDRs down over the past month and only four up. The Utilities SPDR (XLU) and the Utilities Equal-Weight ETF...
READ MORE
MEMBERS ONLY
XLY Underperforms - IWM Hits Potential Reversal Zone
by Arthur Hill,
Chief Technical Strategist, TrendInvestorPro.com
Stocks turned a bit mixed on Wednesday. The Dow Diamonds (DIA) edged lower, while the Russell 2000 ETF (IWM) edged higher. The price movements in the sector SPDRs were quite small. Tech stocks were strong again as the Semiconductor SPDR (XSD) surged 1.77% to lead the way and record...
READ MORE
MEMBERS ONLY
Charts: ARUN, ASEI, BOOM, EMKR, FNSR, JBHT, MS, S
by Arthur Hill,
Chief Technical Strategist, TrendInvestorPro.com
ARUN Tests the Breakout Zone.
ASEI Forms Wedge near Key Retracement.
Plus BOOM, EMKR, FNSR, JBHT, MS, S
Individual charts are below video.
Sorry but your browser doesn't support HTML5 video.
**This chart analysis is for educational purposes only, and should not
be construed as a recommendation to...
READ MORE
MEMBERS ONLY
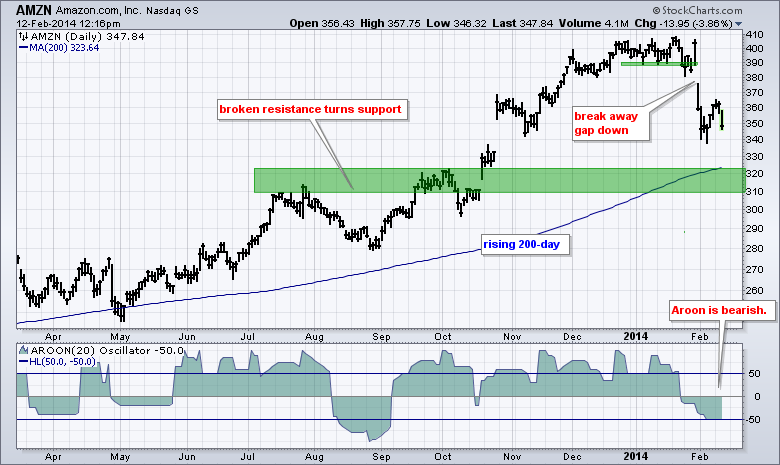
Amazon Starts Acting like a Retail Stock (video)
by Arthur Hill,
Chief Technical Strategist, TrendInvestorPro.com
Amazon (AMZN), the biggest internet retailer in the world, was immune to weakness in the retail group for most of January, but finally broke down with a break away gap. After an oversold bounce above 360, the stock is continuing lower today with a move below 350. The rising 200-day...
READ MORE
MEMBERS ONLY
QQQ Challenges Jan High - UUP Tests Support
by Arthur Hill,
Chief Technical Strategist, TrendInvestorPro.com
Stocks extended the rally with the major index ETFs gaining around 1%. The rally seemed big because the Dow gained almost 200 points, but it was actually modest in percentage terms. DIA did lead the way with a 1.27% advance. The Russell 2000 ETF (IWM) lagged again with a...
READ MORE
MEMBERS ONLY
View RSI on Steroids in the Market Carpet
by Arthur Hill,
Chief Technical Strategist, TrendInvestorPro.com
Looking for the big momentum movers? Check out the MarketCarpet using StochRSI in change mode. StochRSI is the Stochastic Oscillator applied to RSI, which makes it RSI on steroids. Clicking the change icon at the top shows the big movers. Today, we are seeing NE, CNX and GS with upside...
READ MORE
MEMBERS ONLY
TLT and UUP Test Support as GLD Surges
by Arthur Hill,
Chief Technical Strategist, TrendInvestorPro.com
Stocks extended their bounce with small gains in the major index ETFs on Monday. The Nasdaq 100 ETF (QQQ) led the way with a .57% gain and the S&P 500 SPDR (SPY) gained .18% on the day. The sectors were mixed with the Consumer Discretionary SPDR (XLY), Industrials...
READ MORE
MEMBERS ONLY
Charts: COST, FDX, GERN, GS, JBL, X
by Arthur Hill,
Chief Technical Strategist, TrendInvestorPro.com
COST Holds the Gap
FDX Breaks a Flag Line.
Pus GERN, GS, JBL, X
Individual charts are below video.
Sorry but your browser doesn't support HTML5 video.
**This chart analysis is for educational purposes only, and should not
be construed as a recommendation to buy, sell or sell-short...
READ MORE
MEMBERS ONLY
Altera Leads with New High for 2014
by Arthur Hill,
Chief Technical Strategist, TrendInvestorPro.com
Altera, which is part of the semiconductor group, is showing relative strength this year with a price breakout and new high for the year (2014). The stock established support from mid November to mid January and broke out with a gap in January. After some backing and filling, the stock...
READ MORE
MEMBERS ONLY
SPY Surges to Key Retracement - GLD Breaks Triangle
by Arthur Hill,
Chief Technical Strategist, TrendInvestorPro.com
Stocks rebounded at the end of the week with the S&P 500 SPDR (SPY) and Nasdaq 100 ETF (QQQ) posting modest gains (+.84% and +1.19%). The Russell 2000 ETF (IWM) and the Russell MicroCap iShares (IWC), however, posted weekly losses of 1.26% and 1.91%, respectively....
READ MORE
MEMBERS ONLY
Bullish Candlesticks Line up for a Reversal in XRT
by Arthur Hill,
Chief Technical Strategist, TrendInvestorPro.com
After a plunge below 78 to start the week, the Retail SPDR (XRT) firmed with a harami on Monday-Tuesday and then formed a hammer on Wednesday. These are bullish candlestick reversal patterns that require confirmation, which came with a gap and surge to 80. Even though the short-term reversal is...
READ MORE