MEMBERS ONLY
Stocks Surge, but Breadth Falls Short as Small Caps Lag
by Arthur Hill,
Chief Technical Strategist, TrendInvestorPro.com
Stocks got their oversold bounce with a decent advance, but small-caps lagged and breadth could have been stronger. SPY fell sharply on Monday and was down over 5% year-to-date at the time. The ETF firmed for two days and then bounced with its biggest 1-day advance of the year, which...
READ MORE
MEMBERS ONLY
Palo Alto Networks Resumes Uptrend with High Volume Signal
by Arthur Hill,
Chief Technical Strategist, TrendInvestorPro.com
Network security company Palo Alto Networks is resuming its uptrend with a flag breakout on twice its average volume. PANW surged to a new high earlier this year and pulled back with a flag the last few weeks. Notice that broken resistance turned into support in the 58 area. The...
READ MORE
MEMBERS ONLY
SPY Forms Extended Harami - UUP and GLD Hold Uptrends
by Arthur Hill,
Chief Technical Strategist, TrendInvestorPro.com
Stocks remained under pressure with the Russell 2000 ETF (IWM) falling .75% and the S&P 500 SPDR (SPY) losing .12%. Selling pressure, however, was contained as the Dow Diamonds (DIA) ended the day with a small gain. The sectors were mixed with the Energy SPDR (XLE) falling .98%...
READ MORE
MEMBERS ONLY
Three Stocks with a Selling Climax - Plus Three Firming at Support $ARG $TWX
by Arthur Hill,
Chief Technical Strategist, TrendInvestorPro.com
Three Stocks with a Selling Climax
Plus Three Firming at Support
Individual charts are below video.
Sorry but your browser doesn't support HTML5 video.
**This chart analysis is for educational purposes only, and should not
be construed as a recommendation to buy, sell or sell-short said securities**
This...
READ MORE
MEMBERS ONLY
Edwards Follows through on Candlestick Reversal Pattern
by Arthur Hill,
Chief Technical Strategist, TrendInvestorPro.com
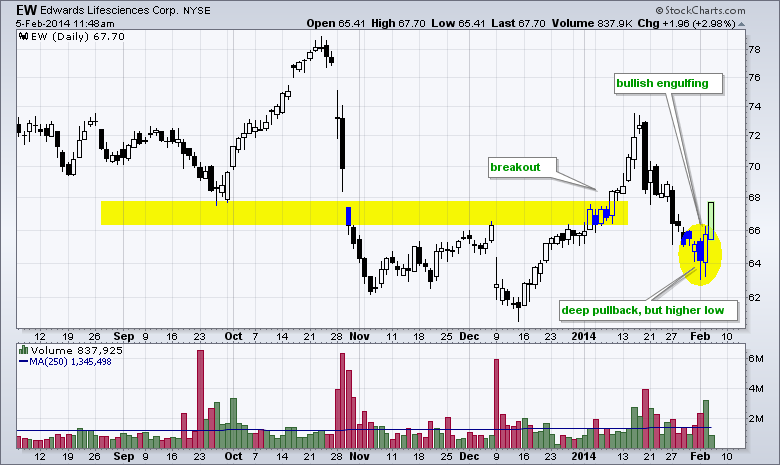
Edwards Life Sciences (EW) has been underperforming the biotech group for over a year, but the stock showed signs of buying interest with a bullish engulfing on high volume and follow through surge on Wednesday. Also note that support in the 65 area extends back to May and the stock...
READ MORE
MEMBERS ONLY
Oversold Bounces Produce Harami in Several Sector SPDRs
by Arthur Hill,
Chief Technical Strategist, TrendInvestorPro.com
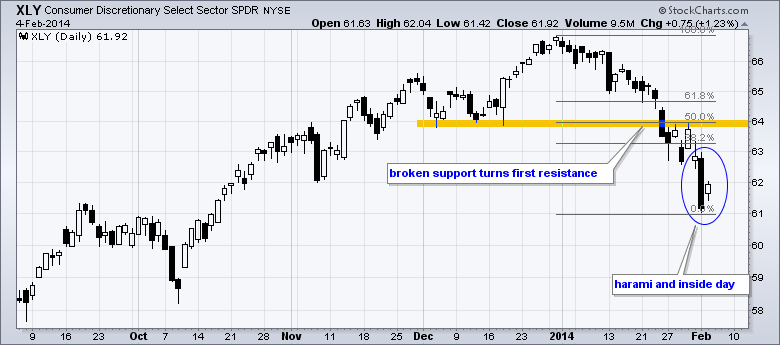
Stocks got a small bounce on Tuesday with mid-caps leading the way higher. All sectors were higher with the Consumer Discretionary SPDR (XLY), Finance SPDR (XLF) and Energy SPDR (XLE) gaining over 1%. All three were beaten down pretty good and were ripe for some sort of bounce. With a...
READ MORE
MEMBERS ONLY
Sector MarketCarpet in RSI Mode Reveals Most Oversold Stocks
by Arthur Hill,
Chief Technical Strategist, TrendInvestorPro.com
Stocks took a beating over the last few weeks, and some more than others. The Sector MarketCarpet below reflects the absolute value for RSI on February 3rd. Stocks with low RSI values have dark red squares, while stocks with relatively high values have green squares. Most of the green can...
READ MORE
MEMBERS ONLY
Four Small Caps and One Mega Cap Buck the Selling Pressure
by Arthur Hill,
Chief Technical Strategist, TrendInvestorPro.com
Sorry but your browser doesn't support HTML5 video.
**This chart analysis is for educational purposes only, and should not
be construed as a recommendation to buy, sell or sell-short said securities**
This commentary and charts-of-interest are designed to stimulate thinking. This analysis is
not a recommendation to buy,...
READ MORE
MEMBERS ONLY
Small-Caps Lead Lower - Breadth Indicator Prepares for Double Dip
by Arthur Hill,
Chief Technical Strategist, TrendInvestorPro.com
Stocks got slammed as the perfect storm just got more perfect. The list of negatives continues to grow. Starting internally, stocks were ripe for a correction in mid January and the Consumer Discretionary SPDR (XLY) has underperformed the entire year. Externally, the 20+ YR T-Bond ETF (TLT) has outperformed the...
READ MORE
MEMBERS ONLY
LinkedIn Tests Key Moving Average with Bullish Candlestick Pattern
by Arthur Hill,
Chief Technical Strategist, TrendInvestorPro.com
It has been a rough few months for LinkedIn as the stock fell from the 255 area in September to the 200 area in early December. The stock, however, is finding some support near the rising 200-day moving average with a big bullish engulfing. After a pullback in mid January,...
READ MORE
MEMBERS ONLY
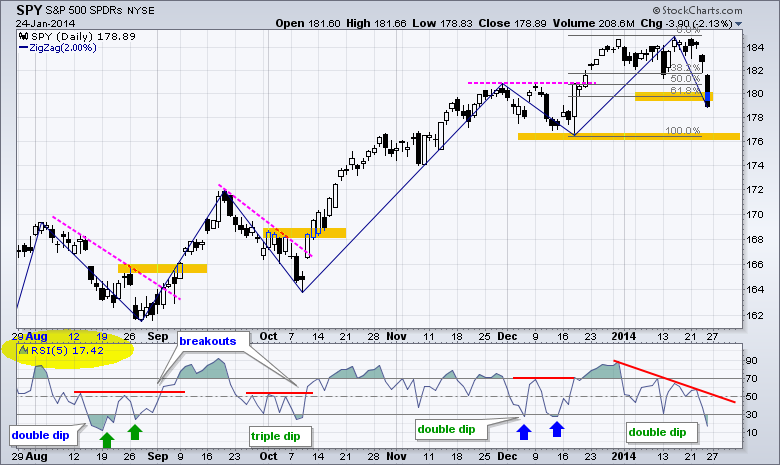
SPY Gaps and Goes Nowhere - TLT Extends Uptrend
by Arthur Hill,
Chief Technical Strategist, TrendInvestorPro.com
After a big decline two weeks ago, stocks moved into a choppy consolidation last week. SPY produced three gaps two weeks ago and another three gaps last week. SPY gapped down from resistance on 23-Jan and gapped down again on 24-Jan en route to a sharp two-day decline. This decline...
READ MORE
MEMBERS ONLY
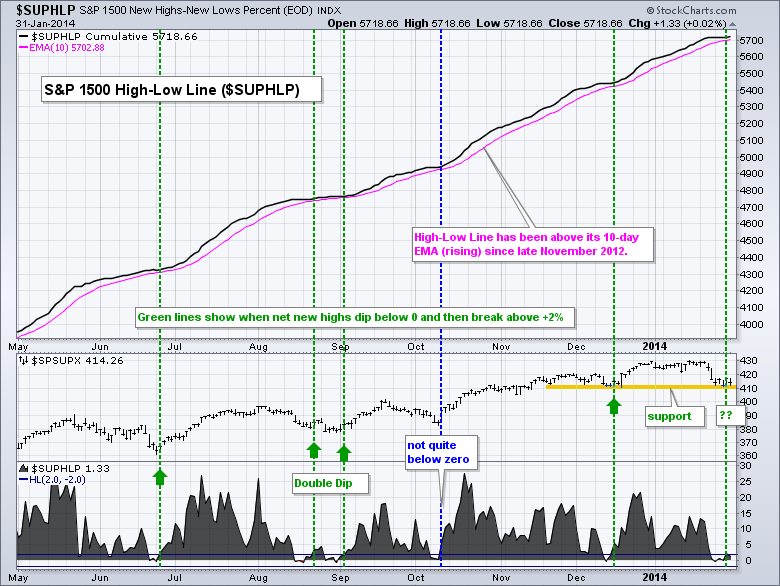
High-Low Percent Indicator Dips to a Reversal Zone
by Arthur Hill,
Chief Technical Strategist, TrendInvestorPro.com
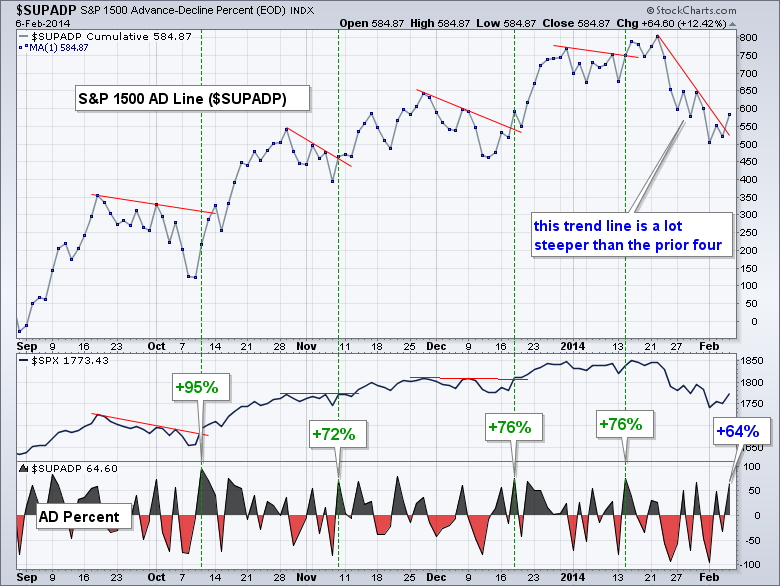
High-Low Percent for the S&P 1500 dipped into negative territory in late January. This is potentially significant because prior dips did not extend past the -2% level and marked turning points in the S&P 1500. The chart below shows the S&P 1500 High-Low Line...
READ MORE
MEMBERS ONLY
Canada Bucks the Trend as TSX Gains in January (video)
by Arthur Hill,
Chief Technical Strategist, TrendInvestorPro.com
It has been a rough year for global equity markets, but the S&P/TSX Composite ($TSX) is bucking the trend with a small gain year-to-date. Notice that the Hang Seng Composite ($HSI) and Nikkei 225 ($NIKK) are leading Asia lower, while the Bovespa ($BVSP) is weighing on Latin...
READ MORE
MEMBERS ONLY
Momentum Slips and Net New Highs Dip
by Arthur Hill,
Chief Technical Strategist, TrendInvestorPro.com
Stocks were hit with more selling pressure and the major index ETFs are now down year-to-date. This was enough to push the momentum indicators into negative territory and prompt a downgrade. This pullback, however, could be just a correction. Interestingly, large-caps led this decline and small-caps are holding up well....
READ MORE
MEMBERS ONLY
XLI and XLF Form Small Bearish Patterns
by Arthur Hill,
Chief Technical Strategist, TrendInvestorPro.com
Stocks got an oversold bounce with the major index ETFs gaining over 1% on the day. All nine sectors moved higher with the consumer discretionary, finance, technology, healthcare and utilities sectors gaining over 1%. The Home Construction iShares (ITB) lagged with a small loss and the Retail SPDR (XRT) only...
READ MORE
MEMBERS ONLY
UPS Makes Oversold with Improving RSI Scan
by Arthur Hill,
Chief Technical Strategist, TrendInvestorPro.com
After a sharp decline the last three days, the stock market was oversold and ripe for a bounce. Looking through the predefined scans page, chartists can find a great scan for this situation, such as the "oversold with an improving RSI" scan. While not every stock has a...
READ MORE
MEMBERS ONLY
Charts: ALTR, HFC, HUM, MSFT, TSO, VZ
by Arthur Hill,
Chief Technical Strategist, TrendInvestorPro.com
ALTR Attempts to Hold Breakout.
MSFT Bounces on Good Volume.
Plus HUM, HFC, TSO, VZ
Individual charts are below video.
Sorry but your browser doesn't support HTML5 video.
**This chart analysis is for educational purposes only, and should not
be construed as a recommendation to buy, sell or...
READ MORE
MEMBERS ONLY
SPY Tests Support as TLT and GLD Extend Uptrends
by Arthur Hill,
Chief Technical Strategist, TrendInvestorPro.com
After a small bounce late Monday and Tuesday, stocks opened weak and remained weak on Wednesday. Stocks are still short-term oversold and the long-term trend remains up. This means we have a setup for an oversold bounce. The chart below shows the 10-day SMA for S&P 1500 AD...
READ MORE
MEMBERS ONLY
A Major Bullish Reversal Pattern Takes Shape in TLT
by Arthur Hill,
Chief Technical Strategist, TrendInvestorPro.com
The 20+ YR T-Bond ETF (TLT), which is one of the best performing ETFs this year, is challenging its October high after a 5+ percent advance this year. The double bottom lows are around 101 and resistance is set at 108. A breakout here would target further strength to the...
READ MORE
MEMBERS ONLY
XSD Forms Bullish Candle at Key Level - SPY Firms
by Arthur Hill,
Chief Technical Strategist, TrendInvestorPro.com
Stocks firmed on Tuesday and managed a bounce with the Russell 2000 ETF (IWM) leading the way. Eight of the nine sectors were up with the Finance SPDR (XLF) and HealthCare SPDR (XLV) advancing over 1.3%. The Technology SPDR (XLK) fell as weakness in Apple hit this market-cap weighted...
READ MORE
MEMBERS ONLY
Charts: CVC, DF, DUK, KLAC, MCD
by Arthur Hill,
Chief Technical Strategist, TrendInvestorPro.com
CTXS Lags and Breaks Key Trend Line.
CVC Makes a Big Move on Good Volume.
Plus DS, DUK, KLAC, MCD
Individual charts are below video.
Sorry but your browser doesn't support HTML5 video.
**This chart analysis is for educational purposes only, and should not
be construed as a...
READ MORE
MEMBERS ONLY
Small-Caps Start to Lag - GLD and UUP Await the Fed
by Arthur Hill,
Chief Technical Strategist, TrendInvestorPro.com
Stocks started the day weak, got a bounce in the afternoon and then moved lower in the final thirty minutes of trading. Overall, the major index ETFs closed with losses and small-caps led the way lower as IWM fell 1.46%. Small-caps were holding up well, but are starting to...
READ MORE
MEMBERS ONLY
Utilities Sector Benefits as Market Turns Defensive
by Arthur Hill,
Chief Technical Strategist, TrendInvestorPro.com
The Sector Carpet is mostly red on Monday, but pockets of green can be seen within the utilities sector as money moves into this defensive area of the market. Pepco Holdings (POM) is leading the group with a 1.5% gain. DTE Energy (DTE) and Ameren (AEE) are also showing...
READ MORE
MEMBERS ONLY
SPY Becomes Oversold as IWM Tests Support
by Arthur Hill,
Chief Technical Strategist, TrendInvestorPro.com
Stocks were finally hit with strong selling pressure over the last two days. Despite a sharp two-day decline, the bigger trends remain up and the mean reversion players are thinking bounce. SPY fell over 2% for the fourth time since August. The chart below shows daily candlesticks with the two...
READ MORE
MEMBERS ONLY
Consumer Discretionary and Finance Sectors Fall in Sector Rankings
by Arthur Hill,
Chief Technical Strategist, TrendInvestorPro.com
It has been a rough year for stocks and two key offensive sectors are leading the way lower. I like to group the sector SPDRs into three groups: offensive, defensive and other. The consumer discretionary, technology, finance and industrials sectors are offensive because they are key to market performance. The...
READ MORE
MEMBERS ONLY
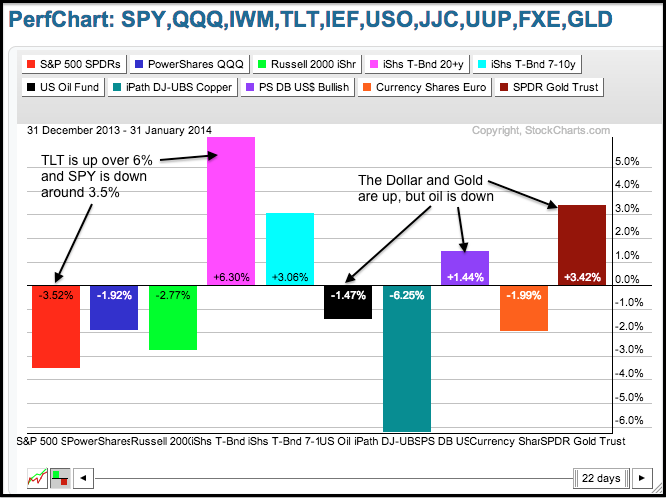
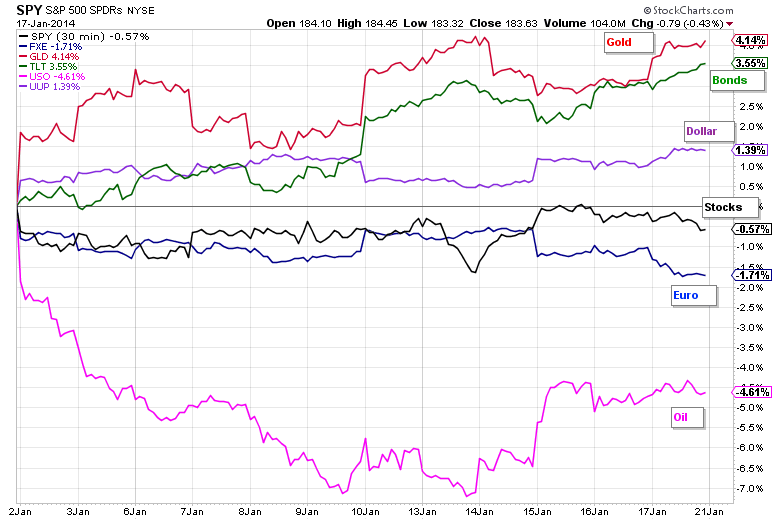
Gold and Treasuries Take Top Honors in 2014 (video)
by Arthur Hill,
Chief Technical Strategist, TrendInvestorPro.com
The stock market finished strong in 2013, but has not been able to gain much traction in 2014. Instead, money has moved into the Gold SPDR (GLD) and the 20+ YR T-Bond ETF (TLT). The intermarket PerfChart shows TLT and GLD with 4+ percent gains year-to-date. Meanwhile, the S&...
READ MORE
MEMBERS ONLY
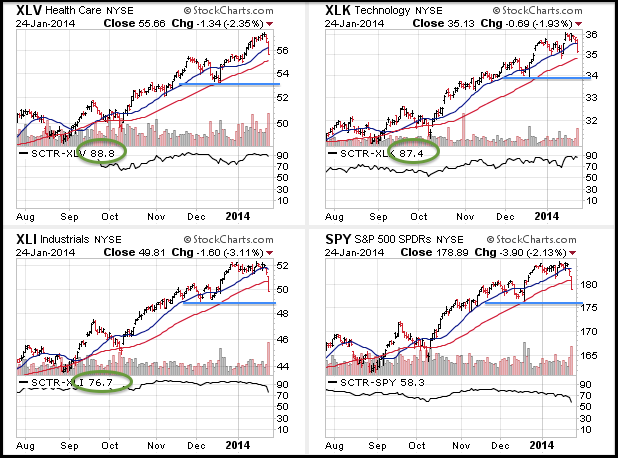
Pockets of Weakness Emerge, but Bulk of Evidence Still Bullish
by Arthur Hill,
Chief Technical Strategist, TrendInvestorPro.com
Stocks were hit with some selling pressure this week, but the bigger trends are unaffected and remain up. The market is split with pockets of weakness and pockets of strength. The consumer discretionary is lagging with a four week low, while the technology sector is leading with a new high...
READ MORE
MEMBERS ONLY
SPY Forges Breakaway Gap - GLD Extends Wedges
by Arthur Hill,
Chief Technical Strategist, TrendInvestorPro.com
Stocks got hit with selling pressure, but the declines were not that deep. The Dow Diamonds (DIA) led the way lower with a 1.08% loss. The Nasdaq 100 ETF (QQQ) held up the best with a .38% decline. All sectors were down with three of the four offensive sectors...
READ MORE
MEMBERS ONLY
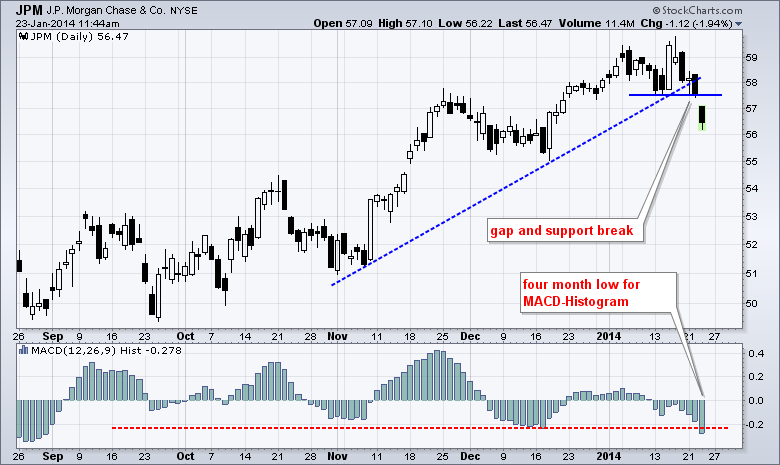
A Breakaway Gap and Key Break for JP Morgan
by Arthur Hill,
Chief Technical Strategist, TrendInvestorPro.com
JP Morgan (JPM) is leading the finance sector lower on Thursday with a gap and support break. This gap should be considered a breakaway gap as long as it remains unfilled. The indicator window shows the MACD Histogram moving to its lowest level in over four months. This means the...
READ MORE
MEMBERS ONLY
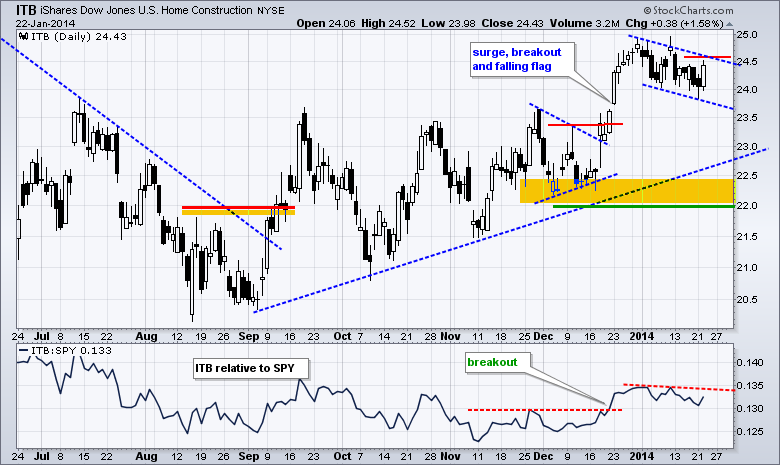
IWM Leads and Holds Breakout - ITB Forms Bull Flag
by Arthur Hill,
Chief Technical Strategist, TrendInvestorPro.com
The edging continues as stocks once again edged higher with techs and small-caps leading the way. The Dow Diamonds (DIA) once again lagged with a small loss, which can be blamed on IBM. The sectors were mixed with the Technology SPDR (XLK) falling a fraction and the Materials SPDR (XLB)...
READ MORE
MEMBERS ONLY
Charts: AFL, CIEN, DDR, HRB, IP, OXY
by Arthur Hill,
Chief Technical Strategist, TrendInvestorPro.com
AFL Underperforms with Bearish Pennant.
CIEN Recovers after Break Down.
Plus DDR, HRB, IP, JOY, OXY
Individual charts are below video.
Sorry but your browser doesn't support HTML5 video.
**This chart analysis is for educational purposes only, and should not
be construed as a recommendation to buy, sell...
READ MORE
MEMBERS ONLY
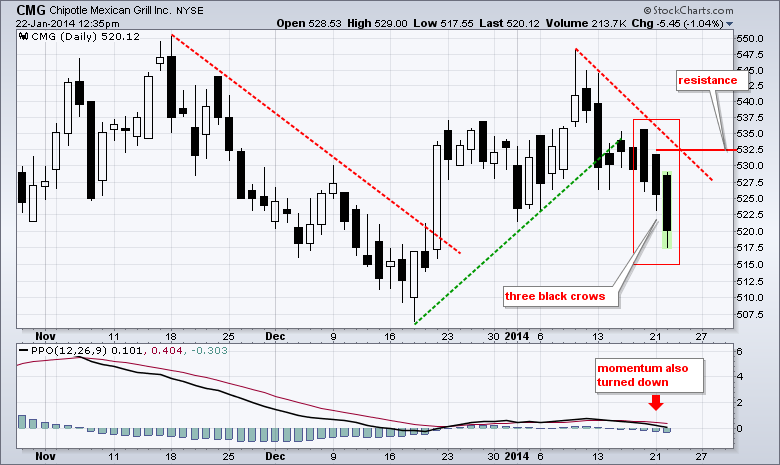
A Rare Bearish Candlestick Pattern Takes Shape in Chipotle (video)
by Arthur Hill,
Chief Technical Strategist, TrendInvestorPro.com
Momentum darling Chipotle (CMG) has come under selling pressure with eight filled candlesticks in a row. A filled, or black, candlestick forms when the close is below the open, which indicates selling pressure after each open. Should today's long filled candlestick remain, a rare three black crows pattern...
READ MORE
MEMBERS ONLY
XLY Remains a Drag, but XLK Holds its Breakout
by Arthur Hill,
Chief Technical Strategist, TrendInvestorPro.com
Stocks edged higher on Tuesday, which fits with the seasonal tendencies after a three day weekend in January. The Russell 2000 ETF (IWM) led the way with a .60% gain. The Dow Diamonds (DIA) lagged with a .21% loss though. Eight of the nine sectors were up with energy and...
READ MORE
MEMBERS ONLY
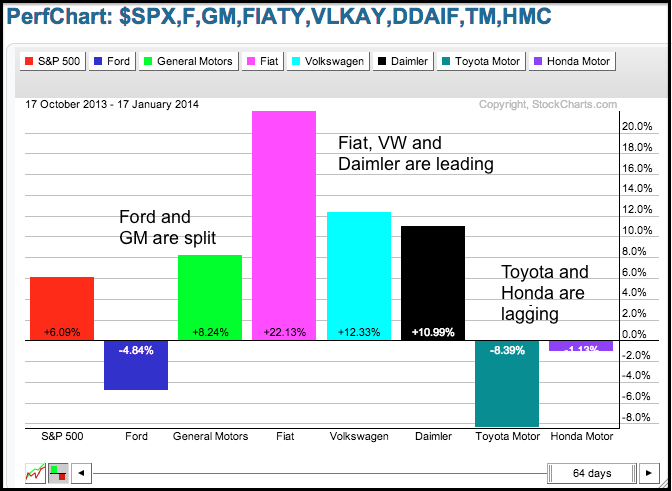
European Auto Makers Lead Group Higher
by Arthur Hill,
Chief Technical Strategist, TrendInvestorPro.com
The PerfChart below shows three month performance for seven auto stocks, six of which feature in the Global Auto ETF (CARZ). Notice that Fiat, VW and Damlier have the biggest gains. Even though these three are based in Europe, they have global reach and benefited from strong auto sales elsewhere....
READ MORE
MEMBERS ONLY
IWM Holds Breakout - GLD Forms Rising Wedge
by Arthur Hill,
Chief Technical Strategist, TrendInvestorPro.com
Stocks were all over the place last week and ended mixed. The major index ETFs swooned on Monday, but recovered with a surge on Tuesday and strong open on Wednesday. A little profit taking took hold on Thursday-Friday as stocks gave some back at the end of the week. Overall,...
READ MORE
MEMBERS ONLY
Charts: CERN, CNL, CPB, FAST, LOW, PNRA, QLGC
by Arthur Hill,
Chief Technical Strategist, TrendInvestorPro.com
Download 140121acCNL Holds Triangle Breakout.
CPB Fails at Resistance.
Plus FAST, LOW, PNRA, GLQC
Individual charts are below video.
Sorry but your browser doesn't support HTML5 video.
**This chart analysis is for educational purposes only, and should not
be construed as a recommendation to buy, sell or sell-short...
READ MORE
MEMBERS ONLY
EA Surges with Breakaway Gap on Big Volume $EA
by Arthur Hill,
Chief Technical Strategist, TrendInvestorPro.com
Electronic Arts (EA) came to life with its second bounce off support and a breakaway gap. This gap occurred on high volume and the stock broke above the late December high. Friday's move put EA into positive territory for the year. In addition, the StockCharts Technical Rank (SCTR)...
READ MORE
MEMBERS ONLY
A New High Epidemic Hits the Market
by Arthur Hill,
Chief Technical Strategist, TrendInvestorPro.com
New highs say it all. The AD Lines and AD Volume Lines hit new highs. Four of the five major index ETFs also hit new highs, as did two of the four offensive sectors hit new highs. We can argue about overbought conditions and the odds of a pullback, but...
READ MORE
MEMBERS ONLY
TLT Outperforms SPY - XLU Bounces off Key Retracement
by Arthur Hill,
Chief Technical Strategist, TrendInvestorPro.com
It was a mixed day for stocks as the major index ETFs treaded water most of the day. The Russell 2000 ETF (IWM) edged higher (+.12%), while the S&P 500 SPDR (SPY) edged lower (-.13%). The sectors were mixed with small losses in the offensive sectors (XLK,...
READ MORE
MEMBERS ONLY
Market Summary Shows Strength in Commodity ETFs
by Arthur Hill,
Chief Technical Strategist, TrendInvestorPro.com
As its name suggests, the Market Summary provides an excellent overview of the financial markets in one page. There are nine tables representing nine different groups. A quick scroll through Thursday's tables reveals some buying interest in several commodity-related ETFs: Copper (CU), Natural Gas (UNG), Sugar (SGG), Coffee...
READ MORE