MEMBERS ONLY
Gold Miners ETF Challenges First Resistance
by Arthur Hill,
Chief Technical Strategist, TrendInvestorPro.com
The Gold Miners ETF (GDX) remains in a downtrend overall, but the ETF is showing signs of life with a resistance challenge to start the year. Resistance in the 22-23 area stems from broken support, the August trend line and the early December high. GDX needs to clear this...
READ MORE
MEMBERS ONLY
AD Lines and AD Volume Lines Surge to New Highs
by Arthur Hill,
Chief Technical Strategist, TrendInvestorPro.com
Stocks finished the year strong as the major index ETFs and offensive sector SPDRs hit new highs. These new highs were confirmed with new highs in the AD Lines and AD Volume Lines. Net New Highs also expanded as the High-Low Lines hit new highs. New highs all around...
READ MORE
MEMBERS ONLY
UUP Challenges Resistance as GLD Forges Bear Trap
by Arthur Hill,
Chief Technical Strategist, TrendInvestorPro.com
Stocks were hit with selling pressure on the first trading day of the year. A little profit taking after a sharp eleven day advance is pretty normal. While this decline could extend further and retrace a portion of the December surge, I am viewing it as a small correction and...
READ MORE
MEMBERS ONLY
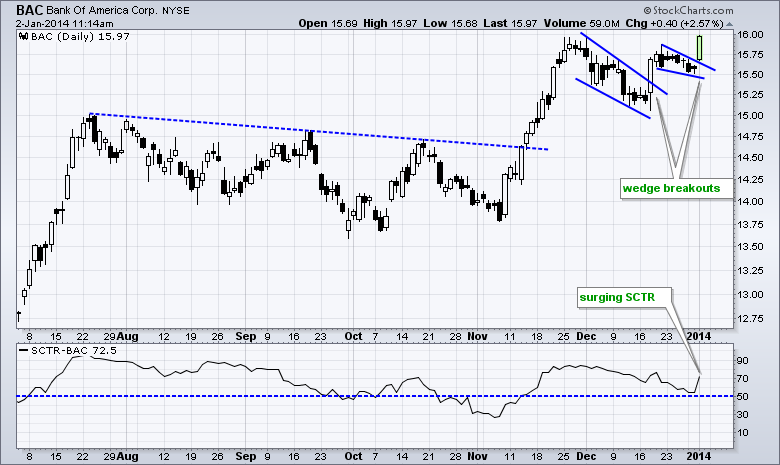
A Double Wedge Break For Bank of America
by Arthur Hill,
Chief Technical Strategist, TrendInvestorPro.com
Bank of America (BAC) is starting the New Year with a breakout on the price chart and surge in the StockCharts Technical Rank (SCTR). The SCTR is up over 15 points and back above 70, which made it easy to spot on the SCTR table when sorted by change. On...
READ MORE
MEMBERS ONLY
Charts: COP, FSLR, GPS, LUB, PG, TSM
by Arthur Hill,
Chief Technical Strategist, TrendInvestorPro.com
COP Firms on Good Volume.
FLSR Continues to Show Relative Weakness.
Plus GPS, LUB, PG, TSM
Individual charts are below video.
Sorry but your browser doesn't support HTML5 video.
**This chart analysis is for educational purposes only, and should not
be construed as a recommendation to buy, sell...
READ MORE
MEMBERS ONLY
Intraday AD Lines Confirm Market Strength
by Arthur Hill,
Chief Technical Strategist, TrendInvestorPro.com
Seasonality worked quite well over the last two weeks as the major index ETFs surged from December 16th to yearend. All were up 4% or more over the last eleven trading days. The Russell 2000 ETF (IWM) and Dow Diamonds (DIA) led with gains exceeding 5%. All sectors moved higher...
READ MORE
MEMBERS ONLY
HealthCare and Consumer Discretionary Sectors Duke it Out for Top Honors
by Arthur Hill,
Chief Technical Strategist, TrendInvestorPro.com
The Consumer Discretionary SPDR (XLY) and the HealthCare SPDR (XLV) are the top performing sectors year-to-date. Both are up over 40% and easily outperforming the S&P 500 SPDR (SPY), which is up a mere 29%. The Industrials SPDR (XLI) will take third place and the Finance...
READ MORE
MEMBERS ONLY
Baker Hughes Breaks Key Line on Intraday P&F Chart
by Arthur Hill,
Chief Technical Strategist, TrendInvestorPro.com
Baker Hughes (BHI) perked up over the last few weeks by establishing support in the lows 50s and triggering three bullish P&F signals. First, notice that the stock forged a Triple Top Breakout at 53.7. Second, BHI triggered a bullish Catapult with a move above 54. Third,...
READ MORE
MEMBERS ONLY
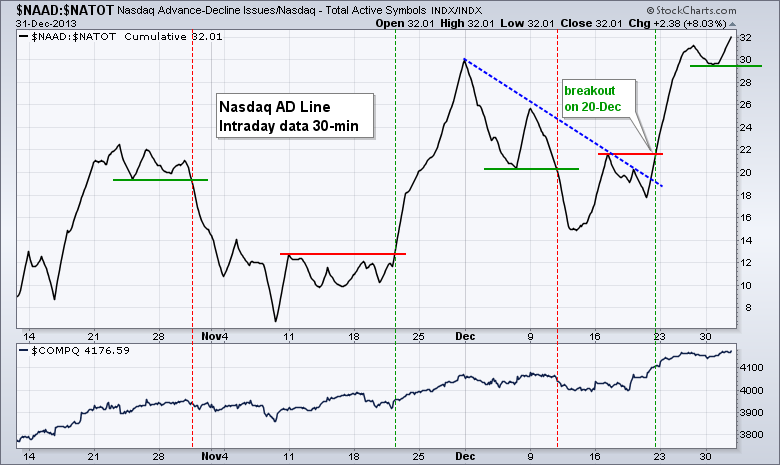
Nasdaq AD Line Confirms Underlying Strength
by Arthur Hill,
Chief Technical Strategist, TrendInvestorPro.com
The Nasdaq AD Line extended its year long uptrend with a surge and new high in December. The chart below shows the AD Line with a series of rising peaks and rising troughs (higher highs and higher lows). Also note that this new high in the AD Line confirms the...
READ MORE
MEMBERS ONLY
Could Copper Play Catch Up in 2014?
by Arthur Hill,
Chief Technical Strategist, TrendInvestorPro.com
The Copper ETN (JJC) is poised to challenge resistance after a channel breakout this month. Notice that the ETF successfully tested the spring-summer lows with a 5+ percent bounce this month. A break above the spring-summer highs would forge a higher high and argue for the start of...
READ MORE
MEMBERS ONLY
Relative Weakness in Retail is Offset by Three Key Groups
by Arthur Hill,
Chief Technical Strategist, TrendInvestorPro.com
The PerfChart below shows one-month performance for ten industry group ETFs. Even though I am concerned with relative weakness in the Retail SPDR (XRT), this concern is offset by relative strength in three other groups. It has been a good month for stocks with the Home Construction SPDR (ITB)...
READ MORE
MEMBERS ONLY
Pre-defined Technical Alerts Page Lights Up
by Arthur Hill,
Chief Technical Strategist, TrendInvestorPro.com
With a strong open on Monday, the pre-defined technical alerts page is showing lots of green for the stock market. Notice that five sector SPDRs hit new highs, three major indices hit new highs and the S&P 500 Bullish Percent Index surged above 80. The table below...
READ MORE
MEMBERS ONLY
SPY Breaks to New High - IWM Starts to Lead
by Arthur Hill,
Chief Technical Strategist, TrendInvestorPro.com
Programming Note: I will be taking time off between Christmas Eve and New Years. The next commentary for Art's Charts will be on Thursday, January 2nd. I wish everyone a very Merry Christmas season and a Happy New Year!
Stocks finished the week on a strong note as...
READ MORE
MEMBERS ONLY
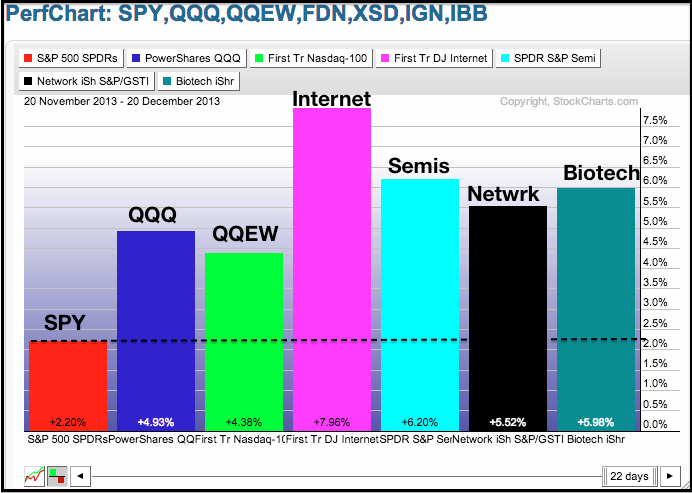
Tech Stocks Take Charge as 2014 Approaches
by Arthur Hill,
Chief Technical Strategist, TrendInvestorPro.com
Key industry group ETFs within the technology sector are leading the market. This shows a healthy appetite for risk and bodes well for the economy. The PerfChart below shows one-month performance for the S&P 500 ETF (SPY) and six tech-related ETFs. The Nasdaq 100 ETF and...
READ MORE
MEMBERS ONLY
Small-Caps Lag, but Bulk of Evidence Remains Bullish
by Arthur Hill,
Chief Technical Strategist, TrendInvestorPro.com
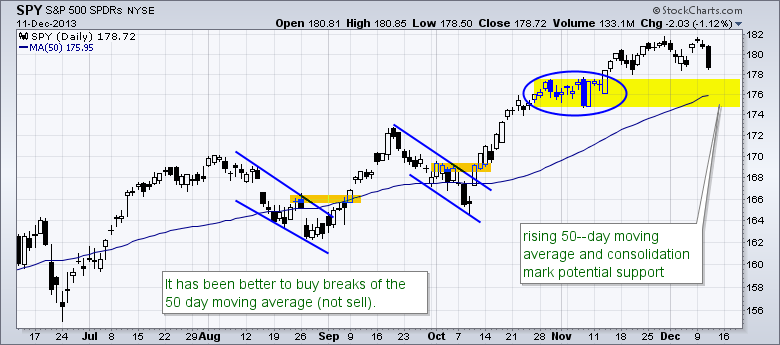
After correcting the first two weeks of December, stocks caught a big bid after the FOMC policy statement and the major index ETFs recouped their prior losses. SPY fell from 182 to 178 and then surged to 182 on Wednesday. These moves were enough to propel the Nasdaq AD Line...
READ MORE
MEMBERS ONLY
Intraday AD Lines Fail to Breakout - TLT Stalls at Support
by Arthur Hill,
Chief Technical Strategist, TrendInvestorPro.com
After big gains on Wednesday, stocks corrected a bit to digest these gains on Thursday. The Russell 2000 ETF (IWM) and the S&P MidCap 400 ETF (MDY) fell back with losses around .75% on the day. DIA edged higher with a fractional gain, while SPY edged lower. Eight...
READ MORE
MEMBERS ONLY
Sector Summary Reveals the Leading Steel Stocks
by Arthur Hill,
Chief Technical Strategist, TrendInvestorPro.com
A top-down browse through the sector summary shows that steel stocks are up in a down market on Thursday. Starting with the sector overall, chartists can see which sectors are leading and which are lagging. After clicking "materials sector", chartists will be taken to the industry groups...
READ MORE
MEMBERS ONLY
SPY Surges to Consolidation Resistance - GLD Breaks Support
by Arthur Hill,
Chief Technical Strategist, TrendInvestorPro.com
The Fed finally decided to taper and the markets are reacted in a big way. Note that the Fed merely reduced its quantitative easing from $85 billion per month to $75 billion. It is, however, a start that marks a change in Fed policy. I think stocks were just waiting...
READ MORE
MEMBERS ONLY
Charts of Interest: BAX, DHI, MXIM, NVDA, TIBX, XLNX
by Arthur Hill,
Chief Technical Strategist, TrendInvestorPro.com
BAX Surges to Wedge Trend Line on Good Volume.
DHI Affirms Support with Big Bounce.
Plus MXIM, NVDA, TIBX, XLNX
Individual charts are below video.
Sorry but your browser doesn't support HTML5 video.
**This chart analysis is for educational purposes only, and should not
be construed as a...
READ MORE
MEMBERS ONLY
Dow Surges Above Flag Resistance with Triple Digit Move
by Arthur Hill,
Chief Technical Strategist, TrendInvestorPro.com
The Dow is making a bold statement as it holds the resistance breakout from November and exceeds flag resistance. The Dow broke to new high with a move above 15700 in early November and the 15600-15700 area turns support. This level held on the throwback, which formed a falling...
READ MORE
MEMBERS ONLY
Techs and Small-Caps Show Relative Strength
by Arthur Hill,
Chief Technical Strategist, TrendInvestorPro.com
Today looks like a big day. First, we get housing starts and building permits before the open. Second, we get the Fed policy statement at 2PM ET. This is also Chairman Bernanke's last Fed meeting and last press conference, which will be at 2:30PM. Trading is likely...
READ MORE
MEMBERS ONLY
Hard Drive Makers Lead Tech Sector
by Arthur Hill,
Chief Technical Strategist, TrendInvestorPro.com
Reports of the death of the PC have been greatly exaggerated. Though not PC makers, the hard drive makers are strong with two hitting 52-week highs this week. Seagate (STX) and Western Digital (WDC) hit new highs and stand out on the predefined scans page. A search for STX...
READ MORE
MEMBERS ONLY
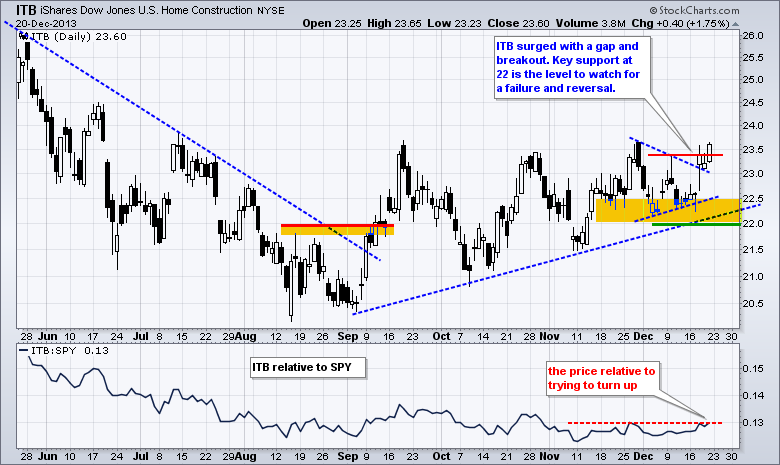
ITB Consolidates ahead of Data - SPY Surges off Support
by Arthur Hill,
Chief Technical Strategist, TrendInvestorPro.com
Stocks got a bounce on Monday with the Russell 2000 ETF (IWM) leading the way. The entire bounce, however, occurred in the first twenty minutes of trading. Even though there was no follow thru to the opening surge, the major index ETFs did hold their gains and finished the day...
READ MORE
MEMBERS ONLY
Charts of Interest: CRM, CVC, CY, IBM, KSS, NNA
by Arthur Hill,
Chief Technical Strategist, TrendInvestorPro.com
CRM Stalls at Support Zone.
CVC Forms Continuation Pattern after Breakout.
Plus CY, IBM, KSS and NNA
Individual charts are below video.
Sorry but your browser doesn't support HTML5 video.
**This chart analysis is for educational purposes only, and should not
be construed as a recommendation to buy,...
READ MORE
MEMBERS ONLY
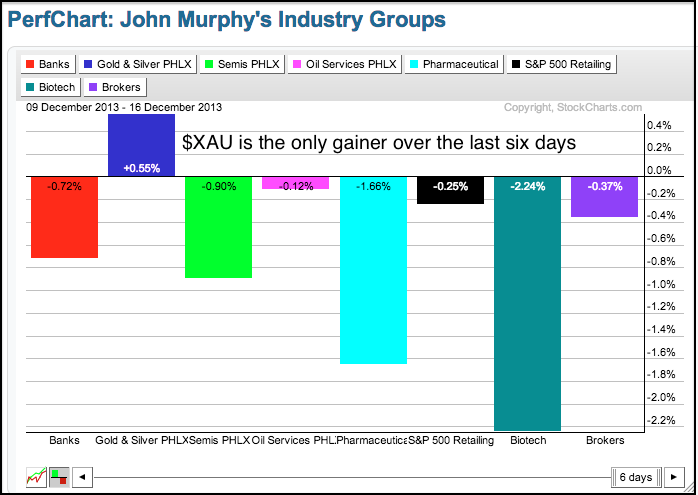
Gold&Silver Index Shows Short-term Relative Strength
by Arthur Hill,
Chief Technical Strategist, TrendInvestorPro.com
The PHLX Gold & Silver Index ($XAU) is actually showing some strength with a small gain over the last six days. Perhaps this is because most other industry group indices are down and XAU is a contrarian play. The PerfChart below shows John Murphy's eight industry groups since...
READ MORE
MEMBERS ONLY
Techs and Defensive Sectors Lead Market Lower
by Arthur Hill,
Chief Technical Strategist, TrendInvestorPro.com
Stocks extended their correction as the S&P 500 ETF (SPY) saw its biggest weekly decline since August. The Russell 2000 ETF (IWM) led the major index ETFs lower with a 2% decline last week. In an interesting twist, the defensive sectors showed the biggest losses. The Healthcare SPDR...
READ MORE
MEMBERS ONLY
Delta and SW Airlines Lead Industrials Sector
by Arthur Hill,
Chief Technical Strategist, TrendInvestorPro.com
The Sector MarketCarpet shows that Delta and Southwest, two airline stocks, are leading the industrials sector on Thursday. Airlines tend to move as a group and this means other airline stocks are likely strong as well. Note that both stock hit 52-week highs in late November and led the...
READ MORE
MEMBERS ONLY
NYSE Breadth Weakens, but Evidence Remains Bullish
by Arthur Hill,
Chief Technical Strategist, TrendInvestorPro.com
The December pullback weakened a few indicators, but the bulk of the long-term evidence remains bullish. Most notably, the NYSE AD Line formed a small bearish divergence, as did the NYSE AD Volume Line. The Nasdaq AD Line and AD Volume Line, however, did not form divergences and techs...
READ MORE
MEMBERS ONLY
Small-Caps Firm, but Techs Weaken as IGN Breaks Wedge
by Arthur Hill,
Chief Technical Strategist, TrendInvestorPro.com
Stocks put in a mixed performance on Thursday as the Russell 2000 ETF (IWM) edged higher and the Nasdaq 100 ETF (QQQ) edged lower. The sectors were also mixed with the Consumer Staples SPDR (XLP) taking the biggest hit (-1.38%). Techs were under pressure from the Networking iShares (IGN)...
READ MORE
MEMBERS ONLY
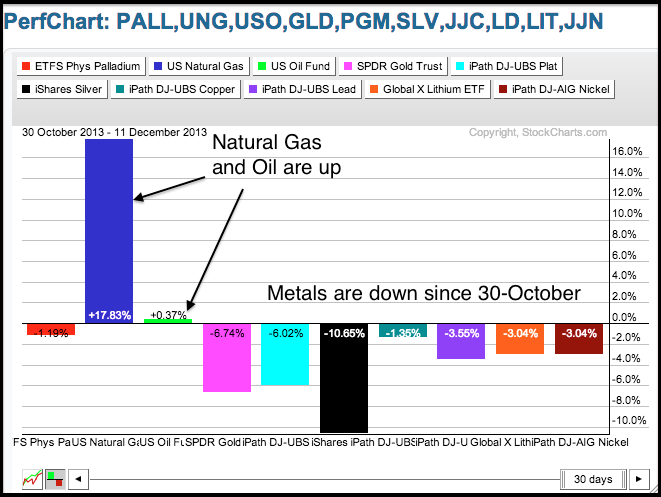
Natural Gas ETF Leads as Metals ETFs Lag
by Arthur Hill,
Chief Technical Strategist, TrendInvestorPro.com
The Natural Gas ETF (UNG) is on a tear with a 15+ percent gain since October 30th. The PerfChart below shows UNG with nine other commodity-related ETFs. The eight metal-related ETFs are down with the Gold SPDR (GLD) and Silver Trust (SLV) leading the way lower. The US...
READ MORE
MEMBERS ONLY
Correction Extends with Small-Caps Leading the Way
by Arthur Hill,
Chief Technical Strategist, TrendInvestorPro.com
Stocks extended their corrective ways as the major index ETFs fell over 1%. While most news outlets suggested that this was a taper tantrum, I am not so sure because stocks were up substantially in November, not to mention year-to-date. The prospects of a taper have been building...
READ MORE
MEMBERS ONLY
Charts of Interest: DDD, DNDN, EBAY, SYSS, TSM, XONE
by Arthur Hill,
Chief Technical Strategist, TrendInvestorPro.com
DDD Forms Dark Cloud at Prior High.
DNDN Edges Higher with Good Volume.
Plus EBAY, SYSS, TSM and XONE
Individual charts are below video.
Sorry but your browser doesn't support HTML5 video.
**This chart analysis is for educational purposes only, and should not
be construed as a recommendation...
READ MORE
MEMBERS ONLY
European Top 100 Index Breaks Channel and Underperforms
by Arthur Hill,
Chief Technical Strategist, TrendInvestorPro.com
The European Top 100 Index ($EUR) broke below the lower trend line of a five month channel with a sharp decline this month. In addition, notice that the index broke below the mid November low and these breaks are holding. European stocks are also showing relative weakness as the price...
READ MORE
MEMBERS ONLY
Small-Caps Turn Laggards as IWM Fills the Gap
by Arthur Hill,
Chief Technical Strategist, TrendInvestorPro.com
SPY and QQQ remain in short-term uptrends, but stocks are in a December funk of sorts. Small-caps are lagging as IWM filled its gap and failed to hold its breakout. As shown yesterday, the S&P 500 AD Line formed a bearish divergence and broke support. In...
READ MORE
MEMBERS ONLY
An Array of Patterns Takes Shape for TEVA
by Arthur Hill,
Chief Technical Strategist, TrendInvestorPro.com
Teva Pharmaceuticals (TEVA) has been all over the place since early October, but two bullish patterns are taking shape and the stock could be poised for a breakout. First, the stock formed a massive island reversal with the late October gap down and the late November gap up. Second, the...
READ MORE
MEMBERS ONLY
Charts of Interest: BOOM, CVC, FLIR, K, LXK, SWC
by Arthur Hill,
Chief Technical Strategist, TrendInvestorPro.com
BOOM Shows Relative Weakness.
CVC Breaks Out with Good Volume.
Plus FLIR, LXK, SWC
Individual charts are below video.
Sorry but your browser doesn't support HTML5 video.
Click here for iPad/iPhone Version
**This chart analysis is for educational purposes only, and should not
be construed as a...
READ MORE
MEMBERS ONLY
S&P 500 AD Line Forms Short-Term Divergence
by Arthur Hill,
Chief Technical Strategist, TrendInvestorPro.com
Stocks meandered on Monday with the Nasdaq 100 ETF (QQQ) edging higher (.41%) and the Russell 2000 ETF (IWM) closing fractionally lower (-.03%). Seven sectors were up and two were down (XLU and XLY). Despite weakness in the consumer discretionary sector, the Home Construction SPDR (ITB) and the Retail SPDR...
READ MORE
MEMBERS ONLY
A Dark Cloud forms over Seagate
by Arthur Hill,
Chief Technical Strategist, TrendInvestorPro.com
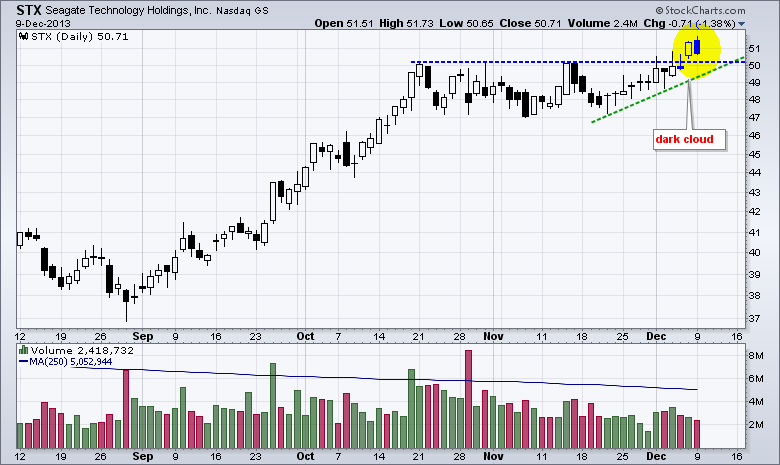
Seagate Technology (STX), which is a Nasdaq stock with a three letter symbol, opened strong and closed weak to make the dark cloud scan list. These are potentially bearish patterns that require confirmation. A move below 49.5 would break the three week trend line and produce a bull trap,...
READ MORE
MEMBERS ONLY
The January Effect Gets Earlier and Earlier
by Arthur Hill,
Chief Technical Strategist, TrendInvestorPro.com
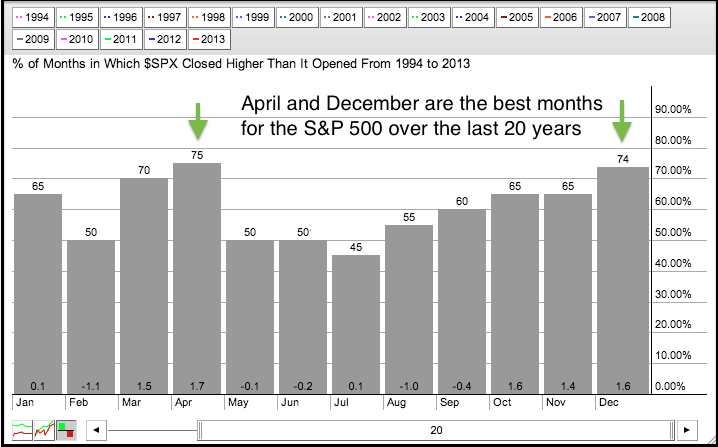
The "January effect" refers to the propensity for stocks to outperform in January and for small-caps to outperform large-caps in January. According to this theory, stocks tend to rise more in January than most other months and small-caps tend to rise even more. Chartists looking...
READ MORE
MEMBERS ONLY
Yield Curve Steepens as 10-Year Surges
by Arthur Hill,
Chief Technical Strategist, TrendInvestorPro.com
The yield curve is steepening as the 10-YR Treasury Yield ($TNX) surges more than the 2-YR Treasury Yield and the 3-Month Treasury Yield. A steepening yield curve confirms loose monetary policy and this could help banks, which make money by borrowing short and lending long.
Click this...
READ MORE