MEMBERS ONLY
Surge in Yields Could Signal Resumption of Bigger Uptrend
by Arthur Hill,
Chief Technical Strategist, TrendInvestorPro.com
Basic Elliott wave teaches us that there are two types of price movements: impulse and corrective. Similarly, Dow Theory teaches us that there are primary price movements and secondary price movements. Impulse and primary moves are in the direction of the bigger trend. Corrective and secondary price moves run counter...
READ MORE
MEMBERS ONLY
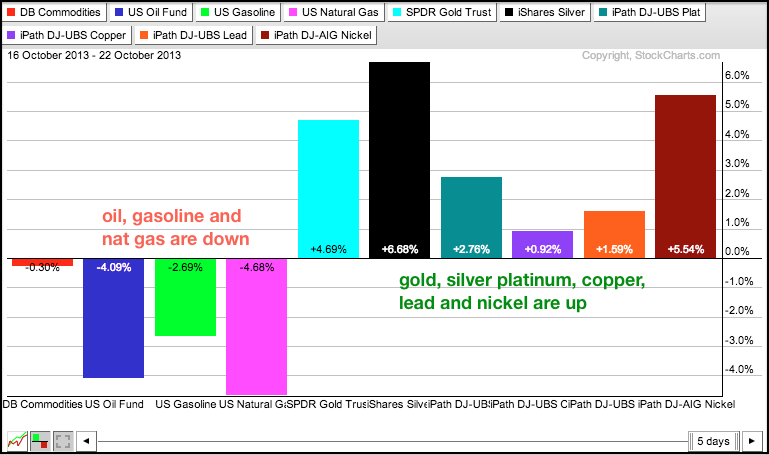
Dollar ETF Gains in October as Oil ETF Gets Hit Hard
by Arthur Hill,
Chief Technical Strategist, TrendInvestorPro.com
This PerfChart shows ten ETFs that cover the intermarket picture. Notice that nine of the ten moved higher with stocks and gold leading the way. Oil was hit the hardest with a 5+ percent loss. In a surprise, the Dollar and the Euro both gained. Dollar strength can be attributed...
READ MORE
MEMBERS ONLY
Small-Caps Start to Lag, but AD Lines Keep Pace
by Arthur Hill,
Chief Technical Strategist, TrendInvestorPro.com
The indicator summary remains firmly positive, but stocks stumbled this week with small-caps and financials weighing on the market. After big runs the last three weeks, the major index ETFs are again short-term overbought. However, these runs produced new highs to affirm the overall uptrends. Also note that the AD...
READ MORE
MEMBERS ONLY
Surging Dollar Rattles Gold and Oil
by Arthur Hill,
Chief Technical Strategist, TrendInvestorPro.com
Stocks were mostly weak on Thursday, but selling pressure was modest and there were a few pockets of strength. The Russell 2000 ETF (IWM) led the way lower with a .58% decline. The Nasdaq 100 Equal-Weight ETF (QQEW) managed a .03% gain on the day. Seven of the nine sector...
READ MORE
MEMBERS ONLY
LinkedIn Firms at Key Level as Aroon Indicators Converge
by Arthur Hill,
Chief Technical Strategist, TrendInvestorPro.com
LinkedIn (LNKD) was hit with a high volume decline on Wednesday, but managed to firm near a support zone on Thursday. Support stems from the mid August and early October lows. The indicator window shows the Aroon indicators converging below 30. This convergence suggests little directional movement over the last...
READ MORE
MEMBERS ONLY
Charts of Interest: ACN, BAC, C, HOG, JPM
by Arthur Hill,
Chief Technical Strategist, TrendInvestorPro.com
Big banks show relative weakness and short-term breakdowns.
BAC C JPM.
Plus $HOG and $ACN
Video is at top. Individual charts are below.
Click here for iPad/iPhone Version
**This chart analysis is for educational purposes only, and should not
be construed as a recommendation to buy, sell or sell-short...
READ MORE
MEMBERS ONLY
RSI Breaks Support on IWM Chart as Momentum Weakens
by Arthur Hill,
Chief Technical Strategist, TrendInvestorPro.com
Stocks finally took a breather with small-caps leading the way lower. The Russell 2000 ETF (IWM) fell 1.37% and the Russell Microcap ETF (IWC) fell 1.70%. All sectors were down, but the losses were relatively modest. The Consumer Staples SPDR (XLP) led the way lower with a .86%...
READ MORE
MEMBERS ONLY
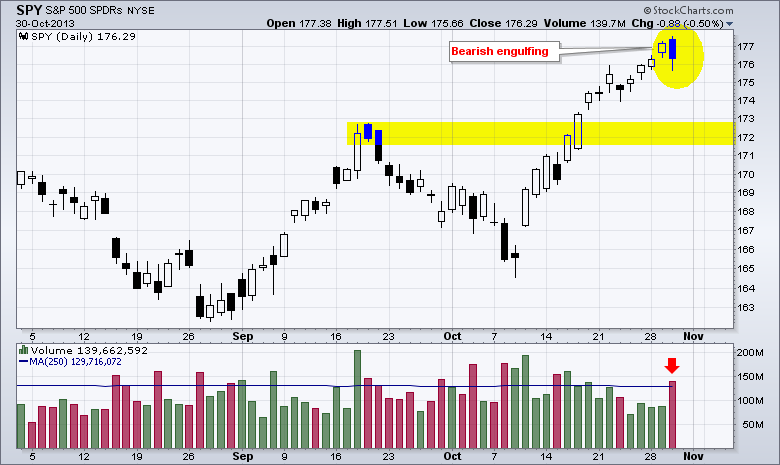
S&P 500 ETF Joins a Crowded Bearish Engulfing Scan
by Arthur Hill,
Chief Technical Strategist, TrendInvestorPro.com
With a strong open and weak close, dozens of stocks and ETFs made the bearish engulfing scan on Wednesday. These patterns form when the current open is above the prior close and the current close is below the prior open. The result is a black candlestick that engulfs the body...
READ MORE
MEMBERS ONLY
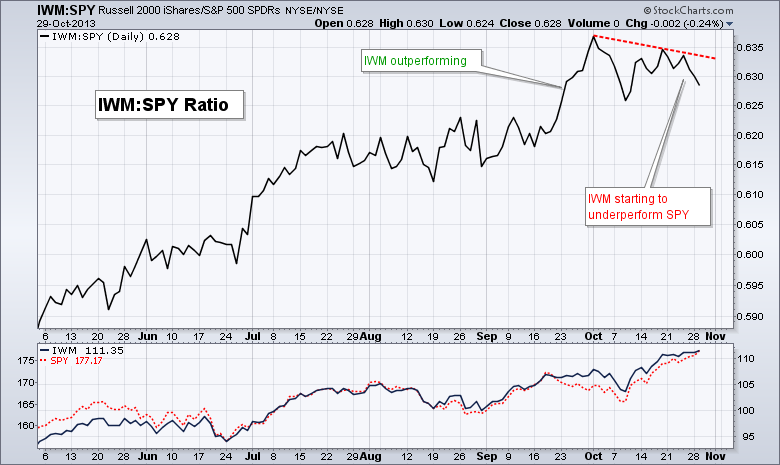
SPY Hits New High, but Small-Caps Lag
by Arthur Hill,
Chief Technical Strategist, TrendInvestorPro.com
The rally rabbit continued its run as the S&P 500 ETF (SPY) hit a new high. All major index ETFs were up, but the gains were modest and I am starting to see a little relative weakness in the Russell 2000 ETF (IWM) and S&P Midcap...
READ MORE
MEMBERS ONLY
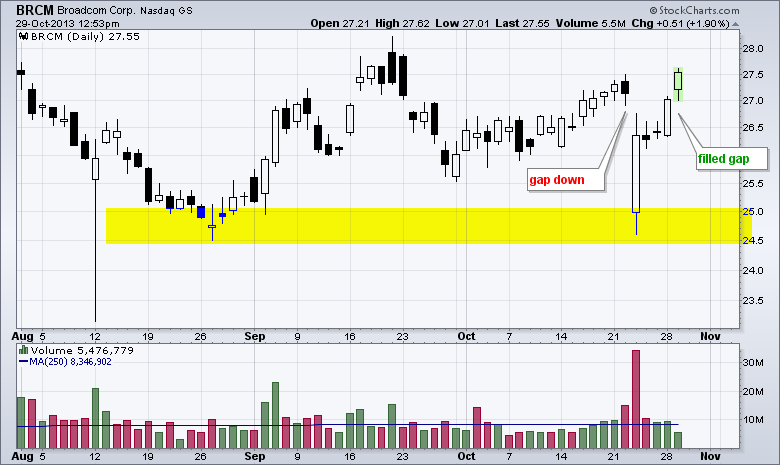
BroadCom Rallies Back to Fill the Gap
by Arthur Hill,
Chief Technical Strategist, TrendInvestorPro.com
BroadCom (BRCM) gapped down after an earnings miss and opened near 25 last week. The stock hit its low in the first 30 minutes with a spike in volume (6 million). The stock subsequently rallied and ended the day with over 30 million shares. Moreover, the stock continued higher the...
READ MORE
MEMBERS ONLY
Raff Channel Extends high for SPY - TLT Holds Breakout
by Arthur Hill,
Chief Technical Strategist, TrendInvestorPro.com
Stocks finished mixed on Monday with the Russell 2000 ETF (IWM) falling .05% and the S&P 500 ETF (SPY) rising .16%. The sectors were also mixed with relatively small moves, excluding the Consumer Staples SPDR (XLP), which surged 1.31% and hit a new high. Semis rebounded with...
READ MORE
MEMBERS ONLY
Charts: AMTD, ATVI, CPRT, CX, EA, RDC, TTWO, TSN
by Arthur Hill,
Chief Technical Strategist, TrendInvestorPro.com
AMTD Forms Flag after Breakout.
Aroon Indicators in Parallel Decline for $ATVI.
Plus $CPRT $CX $EA $RDC $TTWO $TSN
Video is at top. Individual charts are below.
**This chart analysis is for educational purposes only, and should not
be construed as a recommendation to buy, sell or sell-short said securities*...
READ MORE
MEMBERS ONLY
Hershey and Avon Lead Consumer Staples SPDR to New High
by Arthur Hill,
Chief Technical Strategist, TrendInvestorPro.com
The Consumer Staples SPDR (XLP) surged above its May-September highs and recorded a 52-week high with a big move over the last three weeks. A look at the Sector Market Carpet shows Hershey (HSY), Avon (AVP) and Coca-Cola (KO) leading with 2+ percent gains on Monday. HSY also recorded a...
READ MORE
MEMBERS ONLY
Oracle Forms a Bearish Pattern and Shows Relative Weakness
by Arthur Hill,
Chief Technical Strategist, TrendInvestorPro.com
Oracle (ORCL) held its own from July to September, but weakened in October and showed relative weakness. The indicator window shows the price relative turning down and breaking below the August-September lows. On the price chart, ORCL fell to 32 and then formed a rising wedge the last few weeks....
READ MORE
MEMBERS ONLY
AD Lines and AD Volume Lines Hit New Highs
by Arthur Hill,
Chief Technical Strategist, TrendInvestorPro.com
Stocks simply continue to march higher. Buying pressure may be waning, but it is still outpacing selling pressure. The Nasdaq and NYSE AD Lines and AD Volume Lines hit new highs. Net New Highs surged in October and four of the five major index ETFs recorded 52-week highs this month....
READ MORE
MEMBERS ONLY
XLY Leads the Market with a New High
by Arthur Hill,
Chief Technical Strategist, TrendInvestorPro.com
The major index ETFs edged higher with modest gains. Selling pressure hit some areas of the market, but there were some pockets of serious strength that lifted the stocks. In particular, the Home Construction iShares (ITB) continued its rise with a 2.84% advance on the day. Strength in housing...
READ MORE
MEMBERS ONLY
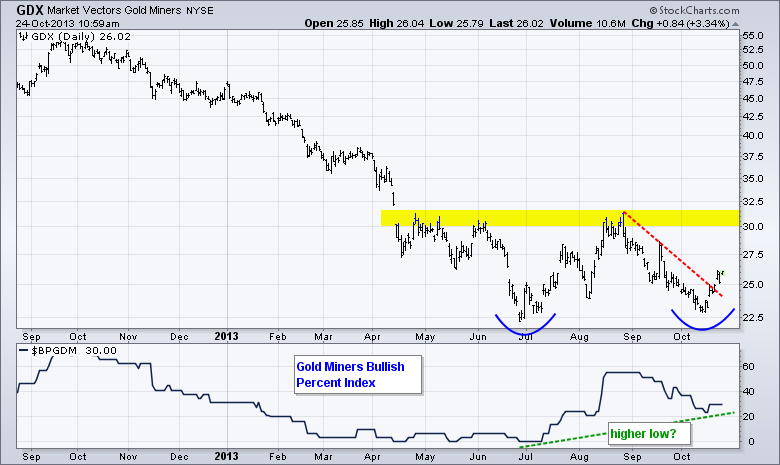
Gold Miners BPI Forms Bullish Divergence as GDX Bounces
by Arthur Hill,
Chief Technical Strategist, TrendInvestorPro.com
The Gold Miners ETF (GDX) got a nice bounce the last seven days with a break above the late August trend line. Even though the big trend remains down, the short-term trend is now up with this small breakout. Longer-term, a potential double bottom is taking shape with the August...
READ MORE
MEMBERS ONLY
Stocks Stall, but Major Index ETFs Maintain Short-Term Uptrends
by Arthur Hill,
Chief Technical Strategist, TrendInvestorPro.com
After hitting new highs for the move early Tuesday, stocks weakened over the last two days with the Technology SPDR (XLK) and Energy SPDR (XLE) leading the way lower. Over the last three days, the S&P 500 ETF (SPY) formed a reversal with a gap up, consolidation and...
READ MORE
MEMBERS ONLY
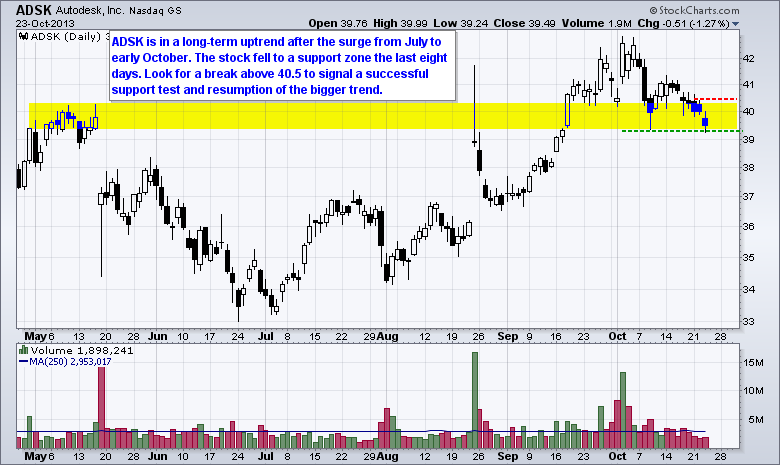
Charts of Interest: ADSK, CZR, SRPT, USG, WDAY
by Arthur Hill,
Chief Technical Strategist, TrendInvestorPro.com
ADSK Hits Support Zone after Pullback.
CZR Retraces 62% with a Wedge. Plus SRPT, USG, WDAY
Video is at top. Individual charts are below.
**This chart analysis is for educational purposes only, and should not
be construed as a recommendation to buy, sell or sell-short said securities**
Click here for...
READ MORE
MEMBERS ONLY
Stocks Extend Gains, Even as Treasuries Surge
by Arthur Hill,
Chief Technical Strategist, TrendInvestorPro.com
Stocks extended their rally with another broad based advance. The S&P 500 ETF (SPY) and the S&P Equal Weight ETF (RSP) both gained around .70% on the day. Eight of nine sectors were up with the Materials SPDR (XLB), Consumer Staples SPDR (XLP) and Utilities SPDR...
READ MORE
MEMBERS ONLY
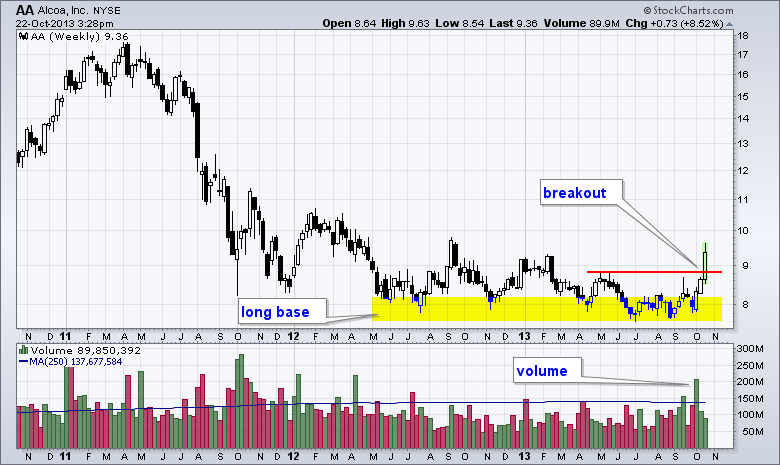
Alcoa Breaks Out of Massive Base Formation
by Arthur Hill,
Chief Technical Strategist, TrendInvestorPro.com
Alcoa moved below 9 in mid 2012 and proceeded to form a long base over the last 15 months. This base gave way to a reversal with a surge above 9 and a 52-week high (intraday). Also notice that the surge started with strong volume. This week's volume...
READ MORE
MEMBERS ONLY
Charts of Interest: COH, DOX, GTIV, LMT, RTN
by Arthur Hill,
Chief Technical Strategist, TrendInvestorPro.com
COH Firms within Falling Flag.
DOX Breaks out on Good Volume.
Plus GTIV, LMT and RTN
Video is at top. Individual charts are below.
**This chart analysis is for educational purposes only, and should not
be construed as a recommendation to buy, sell or sell-short said securities**
Click here for...
READ MORE
MEMBERS ONLY
TLT Holds Breakout Ahead of Employment Report
by Arthur Hill,
Chief Technical Strategist, TrendInvestorPro.com
Stocks treaded water with mixed trading on Monday. The Nasdaq 100 ETF (QQQ) edged higher with a .22% gain, while the Russell 2000 ETF (IWM) edged lower with a .20% loss. The sectors were mixed with the Technology SPDR (XLK) gaining .54% and the Healthcare SPDR (XLV) loosing .51%. Homebuilders...
READ MORE
MEMBERS ONLY
DITC Biotech SPDR Confirms Bearish Engulfing Pattern
by Arthur Hill,
Chief Technical Strategist, TrendInvestorPro.com
A short-term breakdown is in the works for the Biotech SPDR. The ETF returned to broken support and this zone turned into resistance as a bearish engulfing formed on Friday. The ETF followed up this reversal pattern with a trend line break on high volume. This break signals a continuation...
READ MORE
MEMBERS ONLY
QQQ Surges and TLT Breaks Out Ahead of Key Report
by Arthur Hill,
Chief Technical Strategist, TrendInvestorPro.com
The bull stampede continued last week as the Nasdaq 100 ETF (QQQ) led the major index ETFs to new highs. All sectors were higher last week with the Finance SPDR (XLF) and Energy SPDR (XLE) leading the charge. Finance is the big story because this sector went from relative weakness...
READ MORE
MEMBERS ONLY
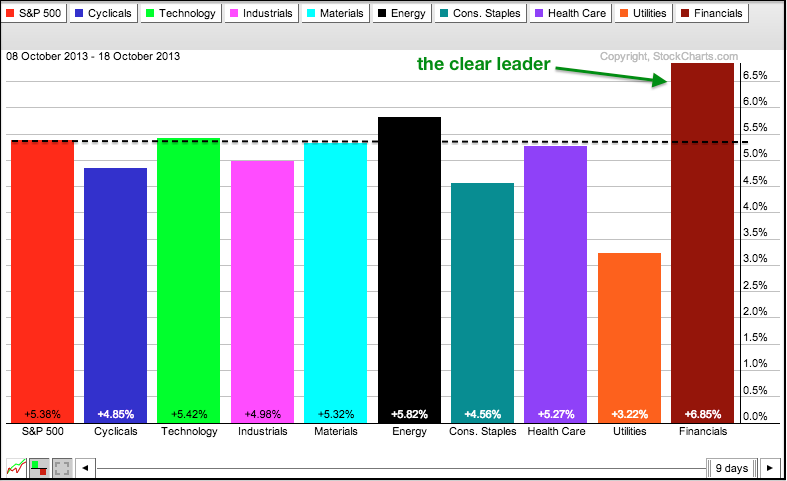
Financials Lead Stock Market to New Highs
by Arthur Hill,
Chief Technical Strategist, TrendInvestorPro.com
Stocks went on a tear the last two weeks with all indices and sectors moving higher. In the past week, we saw fresh 52-week highs in the Russell 2000 (small-caps), Nasdaq (techs) and the S&P 500 (broader market). These new highs affirm the long-term uptrends in stocks and...
READ MORE
MEMBERS ONLY
Consumer Discretionary and Tech Lag on Equal Weight PerfChart
by Arthur Hill,
Chief Technical Strategist, TrendInvestorPro.com
The S&P Equal Weight ETF (RSP) is up some 1.81% over the past month, but the Equal-weight Consumer Discretionary ETF (RCD) and Equal-weight Technology ETF (RYT) are up much less. These two "offensive sectors" are underperforming the broader market. In contrast, the Equal-weight Utilities ETF...
READ MORE
MEMBERS ONLY
Indicator Summary Supports Long-Term Uptrend in Stocks
by Arthur Hill,
Chief Technical Strategist, TrendInvestorPro.com
There are some minor divergences brewing, but the overall picture remains positive for stocks. The market is clearly strong as four of the five major index ETFs surged to new highs this week. The Dow SPDR (DIA) is the lone laggard because it remains below its September high. Breadth remains...
READ MORE
MEMBERS ONLY
TLT Breaks Flag Resistance as GLD Surges to Resistance
by Arthur Hill,
Chief Technical Strategist, TrendInvestorPro.com
Stocks continued their march higher with interest rate sensitive issues leading the charge. The Utilities SPDR (XLU) led the sectors higher with a 1.62% gain and the Home Construction iShares (ITB) surged above the mid September trend line. The 20+ Year T-Bond ETF (TLT) broke falling flag resistance and...
READ MORE
MEMBERS ONLY
IBM Weighs on Dow, Tech Sector and Computer Services Group
by Arthur Hill,
Chief Technical Strategist, TrendInvestorPro.com
IBM, also known as big blue, is weighing on the market with a gap down and 52-week low. This is not the first sign of weakness though. Notice that the stock peaked way back in March and its 50-day crossed below its 200-day in early August. The price relative (IBM:...
READ MORE
MEMBERS ONLY
SPY Hits New High as TLT Forms Bull Flag
by Arthur Hill,
Chief Technical Strategist, TrendInvestorPro.com
The government reopened as congress passed a deal and the president signed off. That is the good news. The bad news is that this process will repeat itself early next year. This would be funny, if it weren't so sad. Stocks, however, don't seem to care...
READ MORE
MEMBERS ONLY
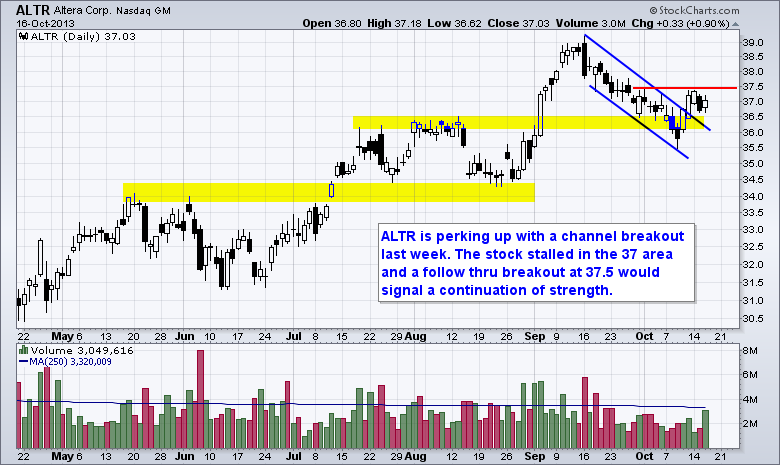
Charts of Interest: ALTR, CHRW, JNPR, LEN, WY
by Arthur Hill,
Chief Technical Strategist, TrendInvestorPro.com
ALTR Breaks Channel Resistance.
CHRW Hits Resistance at Gap.
Plus JNPR, LEN and WY
Video is at top. Individual charts are below.
**This chart analysis is for educational purposes only, and should not
be construed as a recommendation to buy, sell or sell-short said securities**
Click here for iPad/iPhone...
READ MORE
MEMBERS ONLY
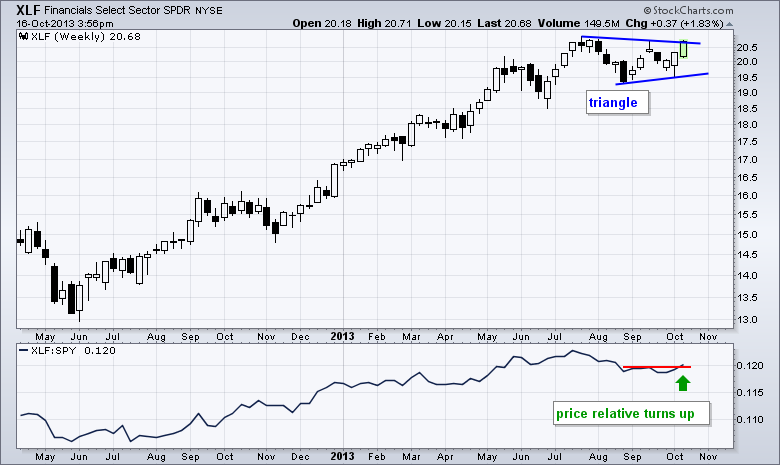
Finance SPDR Leads Market Higher as Price Relative Turns Up
by Arthur Hill,
Chief Technical Strategist, TrendInvestorPro.com
The Finance SPDR (XLF) led the market higher with a 1.83% surge on Wednesday. With this move, XLF is challenging triangle resistance and the September high. A breakout would signal a continuation of the bigger uptrend and argue for new highs. The indicator window shows the price relative (XLF:...
READ MORE
MEMBERS ONLY
Nasdaq 100 High-Low Percent Surges as New Highs Expand
by Arthur Hill,
Chief Technical Strategist, TrendInvestorPro.com
Despite a few negative dips, Nasdaq 100 High-Low Percent ($NDXHLP) has been mostly positive throughout 2013. The red arrows show the brief, and shallow, dips into positive territory. Last week's dip did not last long as High-Low Percent surged to 15% this week. A downtrend is pretty much...
READ MORE
MEMBERS ONLY
XSD, QQQ and IWM Hit New Highs and Lead
by Arthur Hill,
Chief Technical Strategist, TrendInvestorPro.com
The on-off deal in Washington DC was off on the open and back on by the close. Accordingly, stocks opened weak and closed strong with the Russell 2000 ETF (IWM) and Nasdaq 100 ETF (QQQ) hitting new highs. This means small-caps and big techs are showing relative strength, which is...
READ MORE
MEMBERS ONLY
Charts of Interest: AMD, PENN, PFE, RDC, RF, STI
by Arthur Hill,
Chief Technical Strategist, TrendInvestorPro.com
AMD Challenges Key Level with Volume.
PENN Forms Continuation Pattern after Breakout.
Plus PFE, RDC, RF, STI
Video is at top. Individual charts are below.
**This chart analysis is for educational purposes only, and should not
be construed as a recommendation to buy, sell or sell-short said securities**
Click here...
READ MORE
MEMBERS ONLY
SPY Holds the Gap, but Defensive Sectors Lead
by Arthur Hill,
Chief Technical Strategist, TrendInvestorPro.com
Signs of hope dissipated over the weekend as the war of words took over in Washington. It is hard to say what is a negotiating ploy and what it substantive. One this seems for sure though: this is going to go down to the wire and any deal will likely...
READ MORE
MEMBERS ONLY
Several Oil Equipment & Services Stocks Hit New Highs
by Arthur Hill,
Chief Technical Strategist, TrendInvestorPro.com
The Oil Equipment & Services industry was hot on Monday with several stocks hitting new highs. Chartists can find a list of new highs on the pre-defined scans page, which is updated throughout the trading day. This list can be sorted by sector or industry group by clicking the column...
READ MORE
MEMBERS ONLY
SCTR Surges above 50 for Vulcan Materials
by Arthur Hill,
Chief Technical Strategist, TrendInvestorPro.com
The StockCharts Technical Rank (SCTR) for Vulcan Materials surged above 50 to record the second biggest SCTR gain among S&P 500 stocks. On the price chart, the stock broke resistance with the Septmeber surge and broken resistance turned support as a bull flag formed. A break above flag...
READ MORE
MEMBERS ONLY
Indicator Summary Remains Positive Overall
by Arthur Hill,
Chief Technical Strategist, TrendInvestorPro.com
Stocks pulled back in early October, but the long-term uptrends were never in jeopardy and the indicator summary stayed green the entire time. Net New Highs for the Nasdaq and NYSE dipped to the zero line earlier this week, but bounced with Thursday's stock market surge. The trends...
READ MORE