MEMBERS ONLY
Charts of Interest: ATML, CREE, FLIR, LULU, VMC
by Arthur Hill,
Chief Technical Strategist, TrendInvestorPro.com
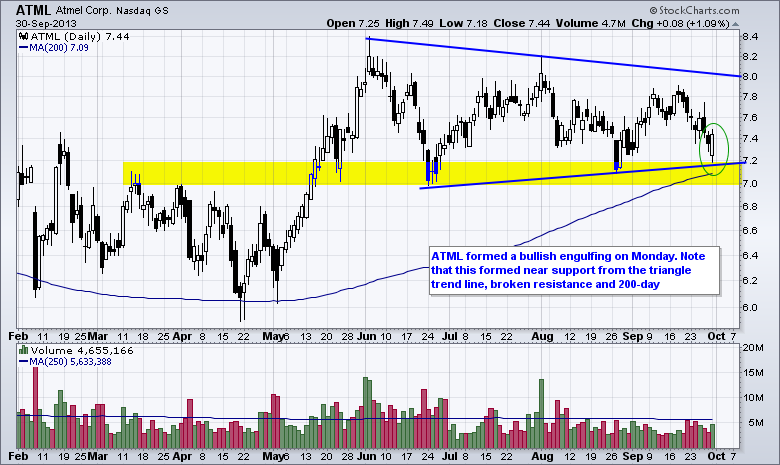
ATML Tests Support with Bullish Candlestick.
Broken Resistance Turns Support for CREE.
Plus FLIR, LULU, VMC
Video is at top. Individual charts are below.
**This chart analysis is for educational purposes only, and should not
be construed as a recommendation to buy, sell or sell-short said securities**
Click here...
READ MORE
MEMBERS ONLY
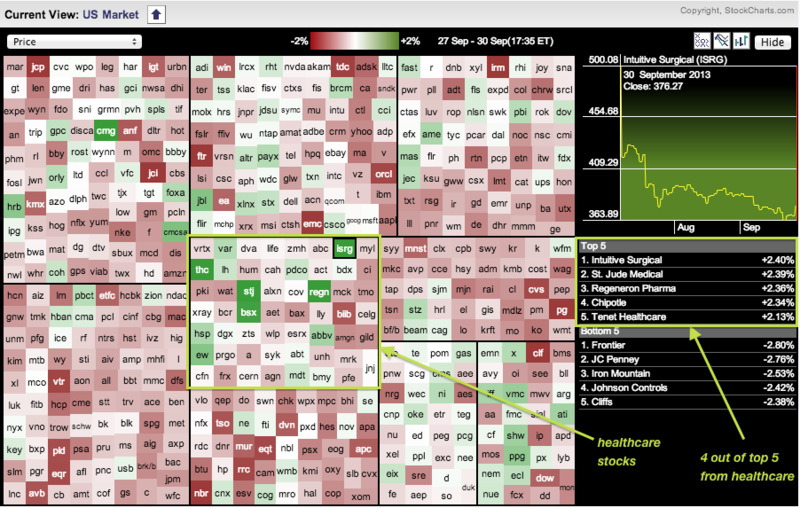
Sector Carpet Reveals Pockets of Strength within Healthcare
by Arthur Hill,
Chief Technical Strategist, TrendInvestorPro.com
The image below comes from today's sector Market Carpet. Notice that four of the top five performers in the S&P 500 come from the healthcare sector (ISRG, STJ, REGN and THC). All sectors were down on Monday, but Healthcare was the best performing sector because it...
READ MORE
MEMBERS ONLY
Short-term Uptrends Challenged as Shutdown Looms
by Arthur Hill,
Chief Technical Strategist, TrendInvestorPro.com
**This chart analysis is for educational purposes only, and should not
be construed as a recommendation to buy, sell or sell-short said securities**
Stock futures are trading sharply lower as the first government shut down in 17 years looms on the horizon. This little shutdown charade is not the...
READ MORE
MEMBERS ONLY
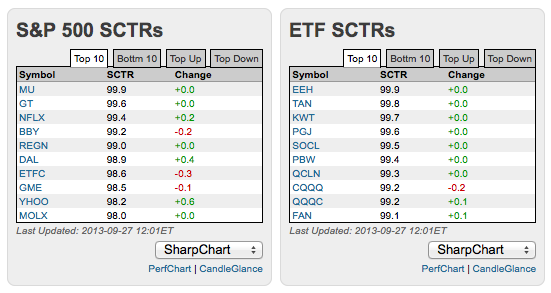
Top Up and Top Down SCTRs Highlight the Big Movers
by Arthur Hill,
Chief Technical Strategist, TrendInvestorPro.com
Looking for the relative movers and shakers in the market? Look no further than the StockCharts Technical Rank (SCTR) on the StockCharts home page. These tables can be found mid way down the home page. Today we can see Nasdaq OMX (NDAQ), Regions Financial (RF) and Microsoft (MSFT) showing relative...
READ MORE
MEMBERS ONLY
Small Caps and Nasdaq Lead the Market Higher
by Arthur Hill,
Chief Technical Strategist, TrendInvestorPro.com
**This chart analysis is for educational purposes only, and should not
be construed as a recommendation to buy, sell or sell-short said securities**
There is no change in the indicator table. All indicators remain in bull mode as the market remains strong. The Nasdaq AD Line and AD Volume...
READ MORE
MEMBERS ONLY
S&P 1500 AD Line Bounces to Establish Short-Term Support
by Arthur Hill,
Chief Technical Strategist, TrendInvestorPro.com
**This chart analysis is for educational purposes only, and should not
be construed as a recommendation to buy, sell or sell-short said securities**
The major index ETFs managed to eek out another gain with the Nasdaq 100 ETF (QQQ) leading the way (+.78%). Yahoo! (YHOO), Ebay (EBAY) and Bed...
READ MORE
MEMBERS ONLY
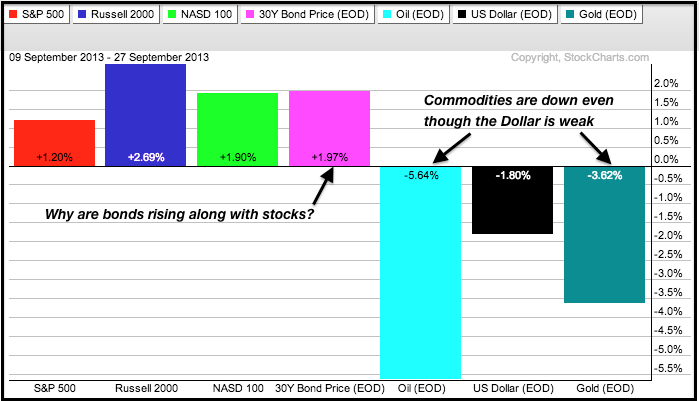
A September Surprise in Inter-market Correlations
by Arthur Hill,
Chief Technical Strategist, TrendInvestorPro.com
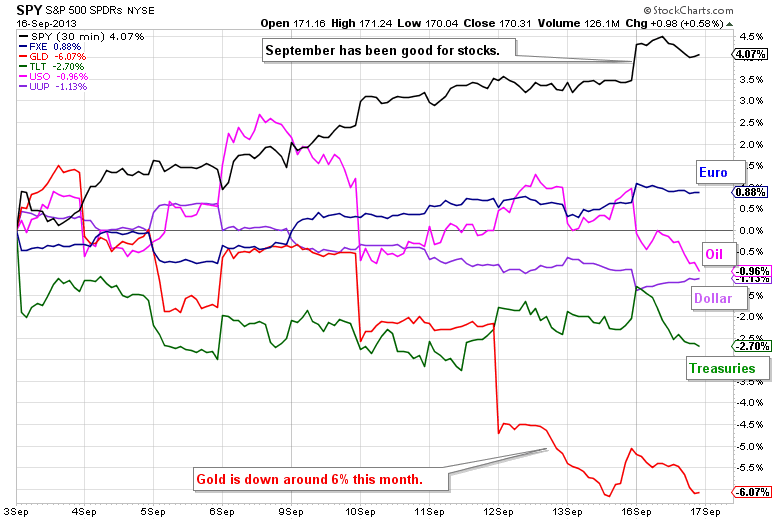
The PerfChart below shows six inter-market related ETFs. Notice that stocks are up with the Russell 2000 ETF (IWM) leading the way (blue). Bonds are also up for the month and this is strange because stocks and bonds are usually negatively correlated. On the other side, notice that gold,...
READ MORE
MEMBERS ONLY
A September Surprise in Inter-market Correlations (video)
by Arthur Hill,
Chief Technical Strategist, TrendInvestorPro.com
The PerfChart below shows six inter-market related ETFs. Notice that stocks are up with the Russell 2000 ETF (IWM) leading the way (blue). Bonds are also up for the month and this is strange because stocks and bonds are usually negatively correlated. On the other side, notice that gold,...
READ MORE
MEMBERS ONLY
IWM Shows Relative Strength as SPY Tests Support
by Arthur Hill,
Chief Technical Strategist, TrendInvestorPro.com
**This chart analysis is for educational purposes only, and should not
be construed as a recommendation to buy, sell or sell-short said securities**
Stocks edged lower with relatively mild selling pressure. The S&P 500 ETF (SPY) fell .26% and the Nasdaq 100 ETF (QQQ) lost .34% on...
READ MORE
MEMBERS ONLY
Charts of Interest: AA, ATVI, IMMR, SCHL, SLW, SYMC
by Arthur Hill,
Chief Technical Strategist, TrendInvestorPro.com
AA gets a Throwback to Broken Resistance.
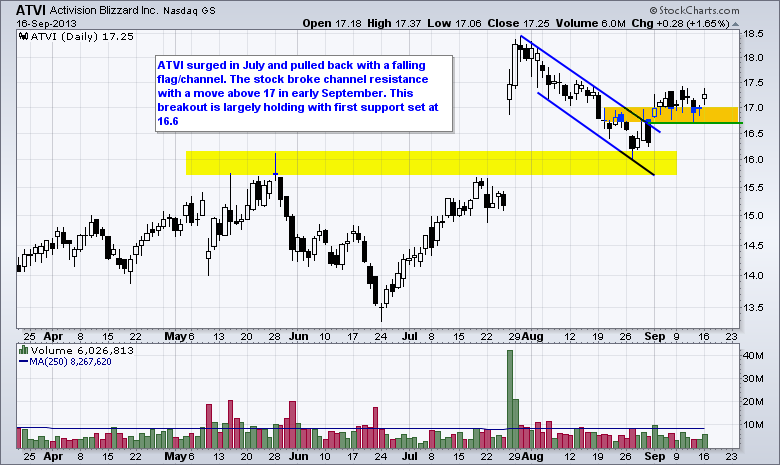
ATVI Underperforms in September.
Plus IMMR, SCHL, SLW, SYMC
Video is at top. Individual charts are below.
**This chart analysis is for educational purposes only, and should not
be construed as a recommendation to buy, sell or sell-short said securities**
Click here...
READ MORE
MEMBERS ONLY
Autozone Breaks Out of Bollinger Band Contraction (video)
by Arthur Hill,
Chief Technical Strategist, TrendInvestorPro.com
Autozone (AZO) surged off support and broke above the upper Bollinger Band with big volume on Wednesday. I found this stock because it made the predefined scans list (intraday). This move affirms support and opens the door for a continuation of the bigger uptrend.
Click this image for a live...
READ MORE
MEMBERS ONLY
Surging Treasuries Could Weigh on Stocks
by Arthur Hill,
Chief Technical Strategist, TrendInvestorPro.com
Stocks were mixed on Tuesday with the Russell 2000 ETF (IWM) gaining ground, the Dow SPDR (DIA) loosing ground and the S&P 500 ETF (SPY) closing flat. Relative weakness in finance, technology and healthcare weighed on the market. Homebuilders offered a bright spot as the Home Construction iShares...
READ MORE
MEMBERS ONLY
Netflix Hits New High, but Forms Bearish Reversal Pattern (video)
by Arthur Hill,
Chief Technical Strategist, TrendInvestorPro.com
Netflix opened at a new on Monday, but selling pressure quickly took hold and drove prices below 203 by the close. This intraday reversal forged a bearish engulfing pattern just above first support. Follow through below last week's low would argue for a deeper correction towards the 260-...
READ MORE
MEMBERS ONLY
SPY Gives Up Wednesday's Gain as TLT Breaks Out
by Arthur Hill,
Chief Technical Strategist, TrendInvestorPro.com
**This chart analysis is for educational purposes only, and should not
be construed as a recommendation to buy, sell or sell-short said securities**
Stocks were mostly lower on Monday with the finance sector weighing on the broader market. The Finance SPDR (XLF) fell 1.42% and the Regional Bank...
READ MORE
MEMBERS ONLY
Charts of Interest: ARUN, CLF, DE, GLW, NFLX
by Arthur Hill,
Chief Technical Strategist, TrendInvestorPro.com
$ARUN Shows Relative Weakness with Support Break.
$CLF Forms Trio of Bearish Candlestick Patterns.
Plus $DE, $GLW, $NFLX
Video is at top. Individual charts are below.
**This chart analysis is for educational purposes only, and should not
be construed as a recommendation to buy, sell or sell-short said securities*...
READ MORE
MEMBERS ONLY
JP Morgan Traces out Bearish Reversal Pattern (video)
by Arthur Hill,
Chief Technical Strategist, TrendInvestorPro.com
JP Morgan (JPM) broke short term support with a sharp decline on Monday. With a lower high taking shape, the stock is forming a larger head-and-shoulders reversal over the last few months. Also notice that JPM shows relative weakness and the Accumulation Distribution Line already broke the summer...
READ MORE
MEMBERS ONLY
GLD, USO and UUP Weaken as TLT Bounces
by Arthur Hill,
Chief Technical Strategist, TrendInvestorPro.com
**This chart analysis is for educational purposes only, and should not
be construed as a recommendation to buy, sell or sell-short said securities**
The on-off-on taper talk is back on again. That didn't take long. The markets prepared for a Fed taper from April to...
READ MORE
MEMBERS ONLY
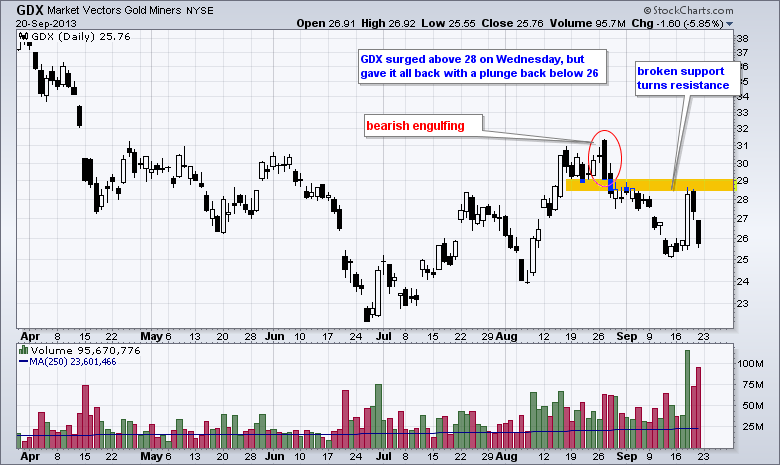
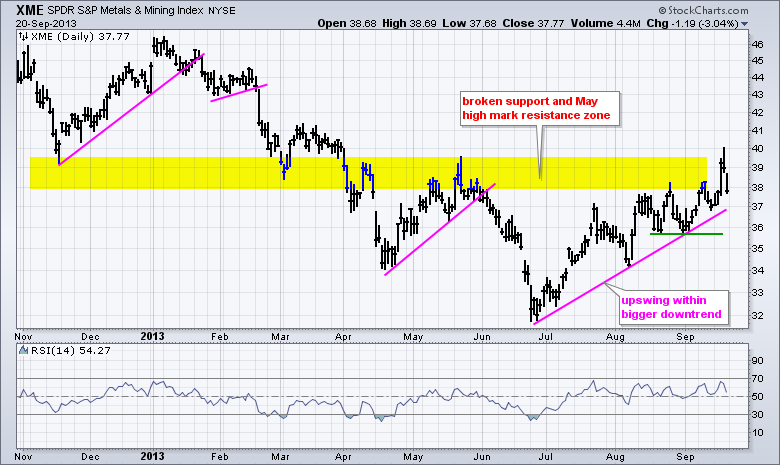
Metals & Mining SPDR Backs off Resistance with Sharp Decline
by Arthur Hill,
Chief Technical Strategist, TrendInvestorPro.com
After bottoming in late June and advancing some 15%, the Metals & Mining SPDR (XME) hit resistance in the 39 area with a pop-and-drop this week. The chart below shows XME surging above 39 on the FOMC statement day and then giving most of it back with a...
READ MORE
MEMBERS ONLY
Two Year Yield Gets Hit Hard on Fed Taper Change
by Arthur Hill,
Chief Technical Strategist, TrendInvestorPro.com
The Treasury market was thrown for a loop this week as the Fed unexpectedly decided not the taper. The chart below shows the 2-Year Treasury Yield ($UST2Y) bearing the brunt of this "adjustment". Notice how the yield advanced as tapering talk took hold from April to August....
READ MORE
MEMBERS ONLY
Nasdaq Lags NY Composite, but Nasdaq Breadth is Strong
by Arthur Hill,
Chief Technical Strategist, TrendInvestorPro.com
The indicator summary got another upgrade this week as SPY momentum improved. All indicators are in bull mode and the majority have been bullish since early December, which is one long run for bullish technicals. The NYSE AD Line is the lone laggard because it has yet to clear its...
READ MORE
MEMBERS ONLY
XLI, XLF, XLB and XLY Lead the Market Higher
by Arthur Hill,
Chief Technical Strategist, TrendInvestorPro.com
**This chart analysis is for educational purposes only, and should not
be construed as a recommendation to buy, sell or sell-short said securities**
After big moves on Wednesdays, the markets took a breather on Thursday and traded relatively flat. Stocks were flat, treasuries pulled back a little, gold stalled,...
READ MORE
MEMBERS ONLY
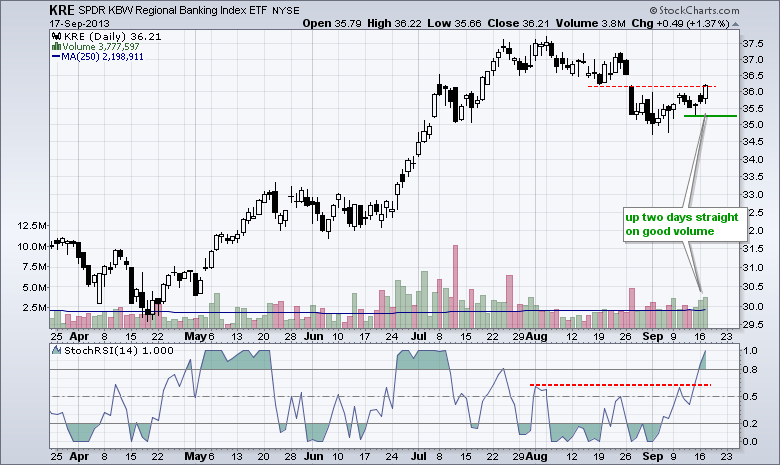
Regional Bank SPDR Breaks Flag Trend Line (video)
by Arthur Hill,
Chief Technical Strategist, TrendInvestorPro.com
The Regional Bank SPDR (KRE) perked up with a bounce above 36 on Tuesday, but gave it back with a sharp decline on Wednesday-Thursday. Broken support and the late August gap ultimately held as resistance. The flag break signals a continuation lower. Also notice that KRE shows relative weakness...
READ MORE
MEMBERS ONLY
Fed Spurs Buying Binge in Stocks, Gold and the Euro
by Arthur Hill,
Chief Technical Strategist, TrendInvestorPro.com
**This chart analysis is for educational purposes only, and should not
be construed as a recommendation to buy, sell or sell-short said securities**
It is amazing what a mere 10-15 billion Dollars can do. The Fed has been buying $85 billion worth of bonds for months now. With...
READ MORE
MEMBERS ONLY
Charts of Interest: CY, FSLR, GIS, SCTY, WDC, WY
by Arthur Hill,
Chief Technical Strategist, TrendInvestorPro.com
CY Bounces off Broken Support.
FSLR Forms Small Inverse HS Pattern.
Plus GIS, SCTY, WDC, WY
Video is at top. Individual charts are below.
**This chart analysis is for educational purposes only, and should not
be construed as a recommendation to buy, sell or sell-short said securities**
Click here...
READ MORE
MEMBERS ONLY
Falling Dollar Boosts Commodities
by Arthur Hill,
Chief Technical Strategist, TrendInvestorPro.com
The Dollar fell sharply on Wednesday and this provided a big boost to precious metals, copper and oil. The screen shot below comes from the Intraday Market Summary Page. The Silver Trust (SLV) led precious metals with a 6.44% surge. The Copper ETF (JJC) advanced over 3% and the...
READ MORE
MEMBERS ONLY
Region Banks Catch a Bid as IWM Exceeds August High
by Arthur Hill,
Chief Technical Strategist, TrendInvestorPro.com
**This chart analysis is for educational purposes only, and should not
be construed as a recommendation to buy, sell or sell-short said securities**
Stocks continued to plow higher as the Russell 2000 ETF (IWM) advanced around 1% and the Nasdaq 100 ETF (QQQ) gained .67% on the day. Eight...
READ MORE
MEMBERS ONLY
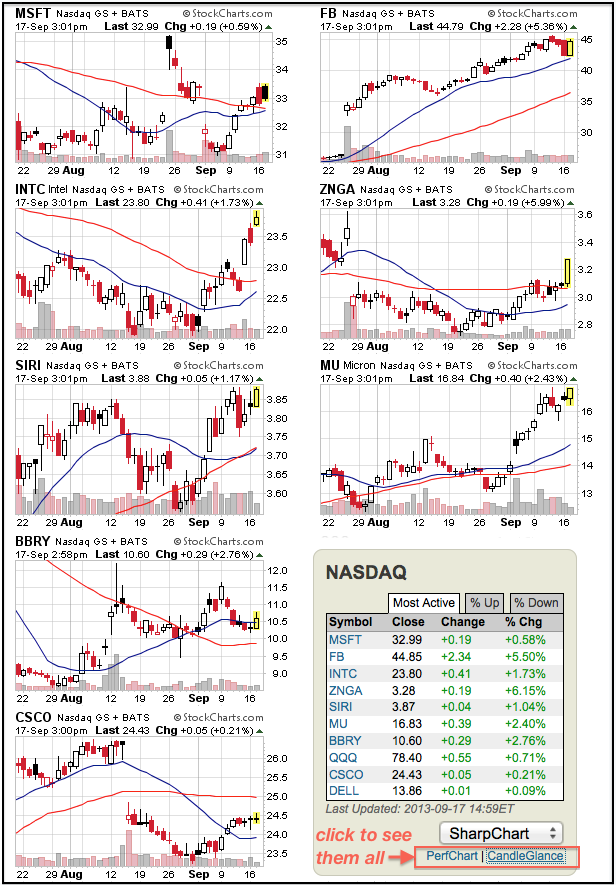
Most Active Stocks Power the Nasdaq Higher
by Arthur Hill,
Chief Technical Strategist, TrendInvestorPro.com
The Nasdaq is moving higher with eight of the ten most active stocks advancing. DELL and QQQ are also up, but I am leaving them out of the top ten. Facebook (FB) is leading the charge with a 5+ percent gain, and Intel is up over 1.5% on the...
READ MORE
MEMBERS ONLY
SPY Challenges August Highs as Gold Weakens
by Arthur Hill,
Chief Technical Strategist, TrendInvestorPro.com
**This chart analysis is for educational purposes only, and should not
be construed as a recommendation to buy, sell or sell-short said securities**
It was pop and drop for the stock market on Monday. Stocks opened strong on news that Lawrence Summers withdrew his name from contention for the...
READ MORE
MEMBERS ONLY
Charts of Interest: ATVI, EBAY, DANG, PMCS
by Arthur Hill,
Chief Technical Strategist, TrendInvestorPro.com
ATVI Holds Channel Breakout.
EBAY Shows Relative Weakness.
Plus DANG and PMCS
Video is at top. Individual charts are below.
**This chart analysis is for educational purposes only, and should not
be construed as a recommendation to buy, sell or sell-short said securities**
Click here for iPad/iPhone Version...
READ MORE
MEMBERS ONLY
Six Sector SPDRs Record Multi-year Highs
by Arthur Hill,
Chief Technical Strategist, TrendInvestorPro.com
The screenshot below comes from the Predefined Technical Alerts Summary. There is a lot of strength in the stock market with the Russell 2000 and Nasdaq hitting multi-year highs. Also note that six sector SPDRs also recorded multi-year highs....
READ MORE
MEMBERS ONLY
QQQ Holds Breakout as Treasuries Remain Weak
by Arthur Hill,
Chief Technical Strategist, TrendInvestorPro.com
**This chart analysis is for educational purposes only, and should not
be construed as a recommendation to buy, sell or sell-short said securities**
Stocks remain strong overall and look to get stronger because S&P 500 futures are trading around 1% higher in pre-market (4AM). Stocks and...
READ MORE
MEMBERS ONLY
Intel Breaks Out with Second Gap in Two Weeks
by Arthur Hill,
Chief Technical Strategist, TrendInvestorPro.com
Intel is on the move with its second gap of the month. Intel started September strong with a small gap and surge above 22.50. After a small three day pullback this week, the stock continued higher again with a gap above 23. Relative strength is also improving as the...
READ MORE
MEMBERS ONLY
NYSE Breadth and SPY Momentum Improve
by Arthur Hill,
Chief Technical Strategist, TrendInvestorPro.com
The indicator summary got a few upgrades this week. In particular, we saw an improvement in NYSE breadth. The NYSE AD Line held above its June low and surged over the last two weeks. With this advance, Net New Highs improved and the Cumulative Net New Highs line moved above...
READ MORE
MEMBERS ONLY
Gold and Treasuries Lag in September, Stocks Lead
by Arthur Hill,
Chief Technical Strategist, TrendInvestorPro.com
**This chart analysis is for educational purposes only, and should not
be construed as a recommendation to buy, sell or sell-short said securities**
Stocks took a breather on Thursday with the major index ETFs edging lower. The Russell 2000 ETF (IWM) led the way with a .73% decline. Seven...
READ MORE
MEMBERS ONLY
XLY, XLF and XLI Lead the Sectors in September
by Arthur Hill,
Chief Technical Strategist, TrendInvestorPro.com
It has been a good month for eight of the nine sectors. Eight of the nine are up month-to-date with the Consumer Discretionary SPDR (XLY), Industrials SPDR (XLI) and Finance SPDR (XLF) among the leaders. It is positive to see three of the four offensive sectors leading during...
READ MORE
MEMBERS ONLY
September Starts with Bang as XLY, XLI and XLF Lead
by Arthur Hill,
Chief Technical Strategist, TrendInvestorPro.com
**This chart analysis is for educational purposes only, and should not
be construed as a recommendation to buy, sell or sell-short said securities**
Stocks were mostly higher on Wednesday, but the gains were small and there were pockets of weakness in the market. The Dow Industrials SPDR (DIA) led...
READ MORE
MEMBERS ONLY
Charts of Interest: PCQ, PFE, PEP, SSP
by Arthur Hill,
Chief Technical Strategist, TrendInvestorPro.com
CQP Firms above Prior Low.
PFE Bounces off Key Retracement.
Plus PEP and SSP
Video is at top. Individual charts are below.
**This chart analysis is for educational purposes only, and should not
be construed as a recommendation to buy, sell or sell-short said securities**
Click here for iPad/...
READ MORE
MEMBERS ONLY
S&P 1500 AD Line Breaks Short-Term Resistance
by Arthur Hill,
Chief Technical Strategist, TrendInvestorPro.com
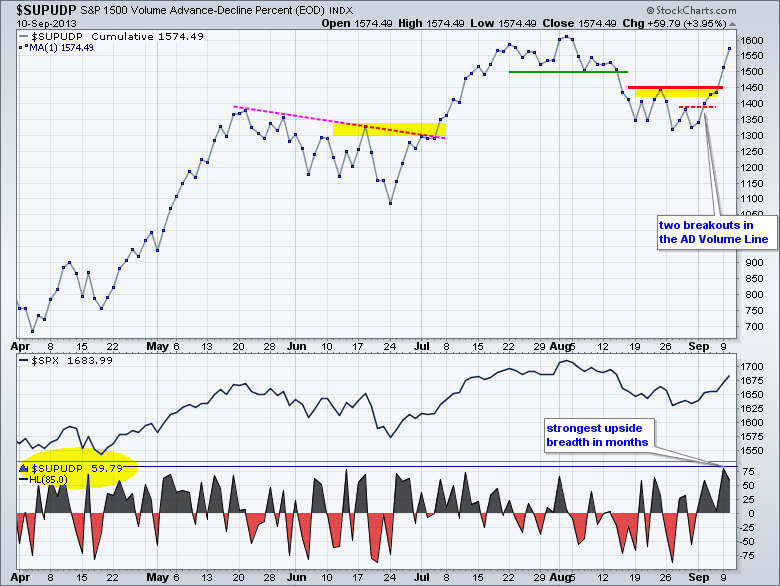
The video and chart below shows the AD Line for the S&P 1500 breaking above its mid August highs with a surge the last few days. This move appears to have ended the short-term downtrend that began in early August.
Click here for a live chart...
READ MORE
MEMBERS ONLY
AD Line and AD Volume Line Break Short-Term Resistance
by Arthur Hill,
Chief Technical Strategist, TrendInvestorPro.com
**This chart analysis is for educational purposes only, and should not
be construed as a recommendation to buy, sell or sell-short said securities**
Stocks put in another solid performance with the Russell 2000 ETF (IWM) and the S&P MidCap 400 SPDR (MDY) gaining around 1%. All nine...
READ MORE
MEMBERS ONLY
Finance SPDR Breaks Key Trend Line
by Arthur Hill,
Chief Technical Strategist, TrendInvestorPro.com
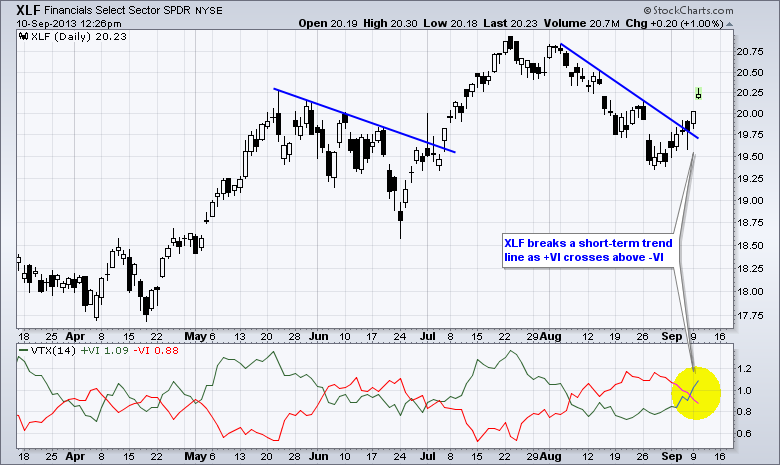
The Finance SPDR (XLF) is starting to perform with a nice surge over the last two weeks. Notice how the ETF broke the August trend line and filled the late August gap to signal an end to the current correction. The Vortex Indicators confirmed as +VI moved above -VI.
Click...
READ MORE