MEMBERS ONLY
QQQ Leads with New High - ITB Challenges Support Break
by Arthur Hill,
Chief Technical Strategist, TrendInvestorPro.com
**This chart analysis is for educational purposes only, and should not
be construed as a recommendation to buy, sell or sell-short said securities**
The bulls got into gear on Monday and pushed stocks higher across the board. The Russell 2000 ETF (IWM) led the major index ETFs with a...
READ MORE
MEMBERS ONLY
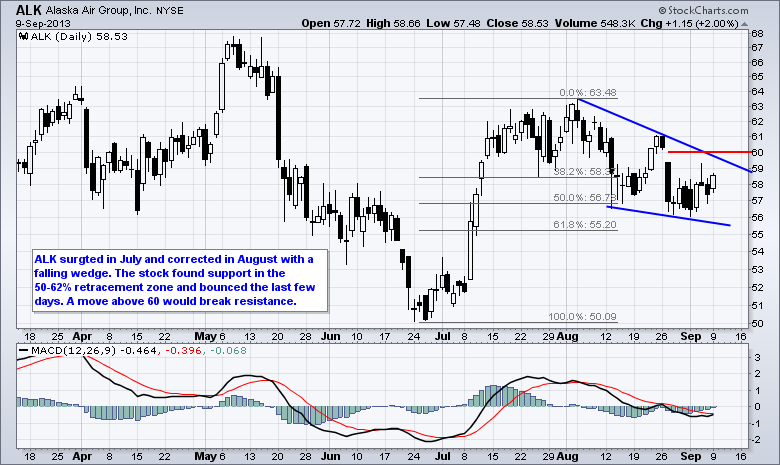
Charts of Interest: ALK, AZO, GE, MHK, SXT
by Arthur Hill,
Chief Technical Strategist, TrendInvestorPro.com
ALK Corrects with Falling Wedge.
AZO Lags the Market with Flat Flag.
Plus GE, MHK, SXT.
Video is at top. Individual charts are below.
**This chart analysis is for educational purposes only, and should not
be construed as a recommendation to buy, sell or sell-short said securities**
Click here...
READ MORE
MEMBERS ONLY
In Honor of Joe Granville; Volume May Lead Price for BAC
by Arthur Hill,
Chief Technical Strategist, TrendInvestorPro.com
Bank of America (BAC) hit a 52-week high in late July and then corrected with a falling flag or channel the last five weeks. Despite this correction, the indicator window shows On Balance Volume (OBV) remaining strong and hitting a new high last week. This suggests that BAC is...
READ MORE
MEMBERS ONLY
SPY and IWM Extend Bounces and Near Resistance
by Arthur Hill,
Chief Technical Strategist, TrendInvestorPro.com
**This chart analysis is for educational purposes only, and should not
be construed as a recommendation to buy, sell or sell-short said securities**
Stocks started September with strength as the Nasdaq 100 ETF (QQQ) and the Russell 2000 ETF (IWM) advance around 2% in a shortened week. All sectors...
READ MORE
MEMBERS ONLY
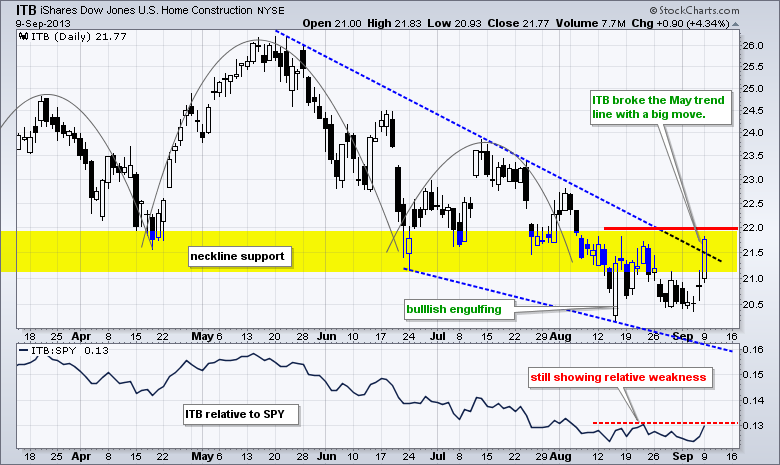
Home Construction iShares Bounces, but Remains Short of Breakout
by Arthur Hill,
Chief Technical Strategist, TrendInvestorPro.com
Treasury yields fell after Friday's jobs report and interest rate sensitive stocks got a bounce as utilities, REITs and homebuilders moved higher. My focus is on the Home Construction iShares (ITB) because this group is important to the consumer discretionary sector and housing is key to the overall...
READ MORE
MEMBERS ONLY
Walgreen Forms Inverse Head-and-shoulders Pattern
by Arthur Hill,
Chief Technical Strategist, TrendInvestorPro.com
After a big surge from November to May, Walgreen (WAG) consolidated with an inverse head-and-shoulders pattern. This version of the head-and-shoulders is a bullish continuation pattern. Also notice that the pattern from mid June to September looks like a cup-with-handle. A breakout at 51...
READ MORE
MEMBERS ONLY
Techs Lead as Nasdaq AD Volume Line Hits New High
by Arthur Hill,
Chief Technical Strategist, TrendInvestorPro.com
There is no change in the indicator table. Relative weakness in interest rate sensitive stocks is weighing on the NYSE as the NYSE AD Line and NYSE Net New Highs lag their Nasdaq counterparts. Stocks remain in corrective mode, but there are clear pockets of strength out there. Notice that...
READ MORE
MEMBERS ONLY
10 Year Yield Approaches 3% - UUP Builds on Breakout
by Arthur Hill,
Chief Technical Strategist, TrendInvestorPro.com
**This chart analysis is for educational purposes only, and should not
be construed as a recommendation to buy, sell or sell-short said securities**
Stocks edged higher with techs leading the way again. The Nasdaq 100 Equal-Weight ETF (QQEW) advanced .49%, but the S&P 500 ETF (SPY)...
READ MORE
MEMBERS ONLY
Steel ETF Challenges 200-day Moving Average
by Arthur Hill,
Chief Technical Strategist, TrendInvestorPro.com
The Steel ETF (SLX) is making some noise with a break above the flag trend line and challenge to the 200-day SMA. This moving average flattened just below resistance, which extends back to the May highs. With the 50-day turning up, price action is looking bullish and a...
READ MORE
MEMBERS ONLY
Techs Lead as QQQ Bounces off Support - USO Forms Wedge
by Arthur Hill,
Chief Technical Strategist, TrendInvestorPro.com
**This chart analysis is for educational purposes only, and should not
be construed as a recommendation to buy, sell or sell-short said securities**
Techs took the lead on Wednesday with semiconductor and networking stocks scoring nice gains. The Nasdaq 100 ETF (QQQ) relative strength with a 1% gain, while...
READ MORE
MEMBERS ONLY
Charts of Interest: AKAM, BHI, CME, EXPD, NBR, VMC
by Arthur Hill,
Chief Technical Strategist, TrendInvestorPro.com
AKAM Forms Cup-with-handle Pattern.
BHI Challenges Wedge Resistance.
Plus CME, EXPD, NBR, VMC
Video is at top. Individual charts are below.
**This chart analysis is for educational purposes only, and should not
be construed as a recommendation to buy, sell or sell-short said securities**
Click here for...
READ MORE
MEMBERS ONLY
Altera Leads Semis with Rim Breakout
by Arthur Hill,
Chief Technical Strategist, TrendInvestorPro.com
Altera (ALTR) is showing upside leadership with a breakout and 52-week high on good volume. Overall, the pattern at work looks like a cup-with-handle, which is a bullish pattern. The rim breakout completes the pattern and argues for higher prices. Broken resistance turns first support to watch...
READ MORE
MEMBERS ONLY
Stocks Hit with Pop and Drop as Early Gains Fade
by Arthur Hill,
Chief Technical Strategist, TrendInvestorPro.com
**This chart analysis is for educational purposes only, and should not
be construed as a recommendation to buy, sell or sell-short said securities**
Stocks got the old pop and drop on Monday. The major index ETFs opened higher on the heels of Asian and European strength. It was also...
READ MORE
MEMBERS ONLY
Utilities SPDR Breaks Pennant Support
by Arthur Hill,
Chief Technical Strategist, TrendInvestorPro.com
The Utilities SPDR (XLU) broke down as the 10-year Treasury Yield ($TNX) moved back above 2.8% on Monday. XLU was already in a downtrend after the lower high in July and mid August breakdown. After stalling with a pennant, the ETF broke pennant support to signal a continuation...
READ MORE
MEMBERS ONLY
SPY and QQQ Test Support Zones
by Arthur Hill,
Chief Technical Strategist, TrendInvestorPro.com
**This chart analysis is for educational purposes only, and should not
be construed as a recommendation to buy, sell or sell-short said securities**
It is the beginning of the month and stock futures are trading sharply higher this morning. The German DAX Index ($DAX) was up 1.74% on...
READ MORE
MEMBERS ONLY
Charts of Interest: ESRX, LINTA, SCCO, SCHL, SCHW
by Arthur Hill,
Chief Technical Strategist, TrendInvestorPro.com
ESRX Corrects with Falling Wedge.
LINTA Firms at Support Zone
Plus SCCO, SCHL, SCHW
Video at end of commentary
**This chart analysis is for educational purposes only, and should not
be construed as a recommendation to buy, sell or sell-short said securities**
Click here for iPad/iPhone Version
This...
READ MORE
MEMBERS ONLY
Gold Miners ETF Forms Big Bearish Engulfing
by Arthur Hill,
Chief Technical Strategist, TrendInvestorPro.com
The Gold Miners ETF (GDX) came under intense selling pressure earlier this week with a bearish engulfing and short-term support break. These two down days occurred on high volume. Also notice that the ETF is hitting resistance from the highs extending back to late April.
Click this image for...
READ MORE
MEMBERS ONLY
Evidence Remains Bullish, but Pockets of Weakness Remain
by Arthur Hill,
Chief Technical Strategist, TrendInvestorPro.com
August was not a nice month for stocks. The S&P 500 is on schedule to post its biggest monthly loss since May 2012. Even though the overall trend is up and the bulk of the evidence remains bullish, I get the feeling that this correction could extend because...
READ MORE
MEMBERS ONLY
Stocks Firm in Mixed Action - Dollar Goes for a Breakout
by Arthur Hill,
Chief Technical Strategist, TrendInvestorPro.com
**This chart analysis is for educational purposes only, and should not
be construed as a recommendation to buy, sell or sell-short said securities**
Market action was mixed on Thursday with the Russell 2000 ETF (IWM) advancing around 1% and the S&P 500 ETF (SPY) advancing just .24%...
READ MORE
MEMBERS ONLY
Airlines, Telecoms and Biotech Lead Essential Industry Groups
by Arthur Hill,
Chief Technical Strategist, TrendInvestorPro.com
Extra! and Pro users have access to the StockCharts Essentials ChartPack, which features 13 core chartlists with over 140 key charts. The image below shows the Essential US Industry Indexes in "summary" format and sorted by percent change. This makes it easy to distinguish between the leaders and...
READ MORE
MEMBERS ONLY
SPY Hits Top of Support Zone - UUP Consolidates at Support
by Arthur Hill,
Chief Technical Strategist, TrendInvestorPro.com
**This chart analysis is for educational purposes only, and should not
be construed as a recommendation to buy, sell or sell-short said securities**
Stocks got an oversold bounce on Wednesday, but the short-term trends remain down and this correction is likely to extent. The Nasdaq 100 ETF (QQQ)...
READ MORE
MEMBERS ONLY
Charts of Interest: ARMH, AVGO, BBBY, CTSH, TIBX
by Arthur Hill,
Chief Technical Strategist, TrendInvestorPro.com
ARMH Firms with Potential Triangle Forming.
AVGO Breaks Flag Resistance with Volume.
Plus BBBY, CTSH, TIBX
Video at end of commentary
**This chart analysis is for educational purposes only, and should not
be construed as a recommendation to buy, sell or sell-short said securities**
Click here for iPad/iPhone...
READ MORE
MEMBERS ONLY
Leveraged Gold ETFs Duke it Out on Ticker Cloud
by Arthur Hill,
Chief Technical Strategist, TrendInvestorPro.com
Want to see what's hot today? Check out the ticker cloud on the home page. The bigger the symbol, the more popular the chart. As you can see, the Direxion Gold Miners Bull 3X ETF (NUGT) and the Direxion Gold Miners Bear 3X ETF (DUST) are quite popular...
READ MORE
MEMBERS ONLY
Broad Based Decline Produces 90% Down Day
by Arthur Hill,
Chief Technical Strategist, TrendInvestorPro.com
**This chart analysis is for educational purposes only, and should not
be construed as a recommendation to buy, sell or sell-short said securities**
It was a good old fashion flight to safety on Tuesday. Stocks moved broadly lower, while the safe havens moved higher. The 20+ Year T-Bond...
READ MORE
MEMBERS ONLY
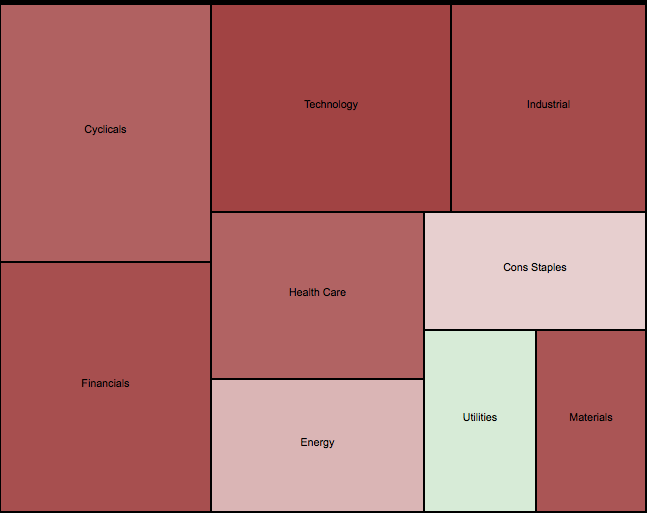
Utilities Buck the Trend with Show of Strength
by Arthur Hill,
Chief Technical Strategist, TrendInvestorPro.com
Looking for pockets of strength on a down day? Turn to the Sector Market Carpet. The first image shows the broad sector view with the utilities sector in light green. The other sectors are either red or a lighter shade of red, which means they are down. The second image...
READ MORE
MEMBERS ONLY
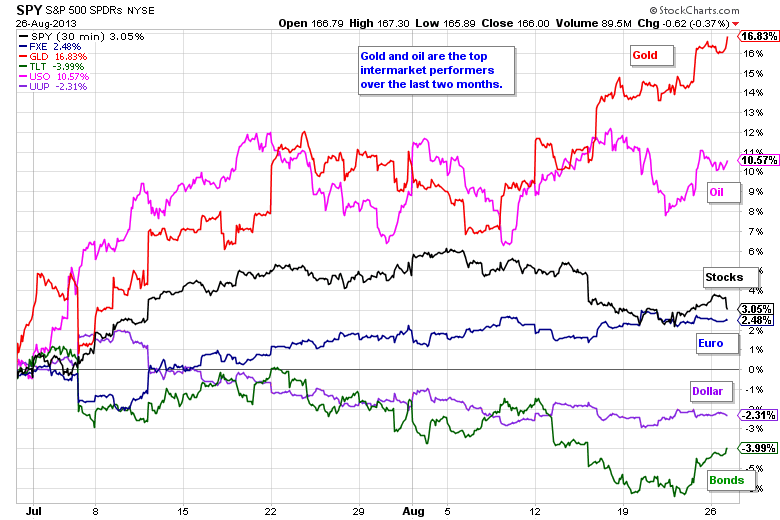
Oil and Gold Lead as Stocks Flounder
by Arthur Hill,
Chief Technical Strategist, TrendInvestorPro.com
**This chart analysis is for educational purposes only, and should not
be construed as a recommendation to buy, sell or sell-short said securities**
Despite a worse-than-expected durable goods report, stocks opened firmed and advanced in early trading. The major index ETFs were in positive territory in the...
READ MORE
MEMBERS ONLY
Charts of Interest: AXP, CRM, ENR, MDP, YUM
by Arthur Hill,
Chief Technical Strategist, TrendInvestorPro.com
AXP Breaks Triangle Trend Line.
CRM Forms Bear Flag.
Plus ENR, MDP, YUM
Video at end of commentary
**This chart analysis is for educational purposes only, and should not
be construed as a recommendation to buy, sell or sell-short said securities**
Click here for iPad/iPhone Version
This commentary...
READ MORE
MEMBERS ONLY
Bullish P&F Signals Outnumber Bearish Signals
by Arthur Hill,
Chief Technical Strategist, TrendInvestorPro.com
Chartists can get an idea of the overall market trend by comparing the number of bullish P&F signals with bearish P&F signals. StockCharts provides this data every day on the predefined scans page. Notice that there are 87 Triple Top Breakouts on the NYSE and only...
READ MORE
MEMBERS ONLY
QQQ Leads with Gap/Breakout - GLD Breaks Flag Resistance
by Arthur Hill,
Chief Technical Strategist, TrendInvestorPro.com
**This chart analysis is for educational purposes only, and should not
be construed as a recommendation to buy, sell or sell-short said securities**
Stocks started the week under selling pressure, but finished strong with a rally on Thursday and Friday. The major index ETFs closed up for the week...
READ MORE
MEMBERS ONLY
Toll Brothers Battles Support and Outperforms its Peers
by Arthur Hill,
Chief Technical Strategist, TrendInvestorPro.com
While the Home Construction iShares (ITB) battles broken support, Toll Brothers (TOL) is still holding support from the 2013 lows. The chart below shows TOL bouncing off support in mid August, but falling short of a breakout. The indicator window shows TOL relative to ITB using the price relative (TOL:...
READ MORE
MEMBERS ONLY
Evidence Remains Bullish as Nasdaq and Russell OutPerform
by Arthur Hill,
Chief Technical Strategist, TrendInvestorPro.com
The bulk of the evidence remains bullish, but recent weakness took its toll on SPY momentum as this indicator trio turned bearish. Momentum indicators are leading indicators and will be the first to turn. However, they are also the most prone to whipsaws and bad signals. Of note, the $COMPQ:...
READ MORE
MEMBERS ONLY
IWM Leads with Small Breakout - ITB Challenges the Neckline
by Arthur Hill,
Chief Technical Strategist, TrendInvestorPro.com
**This chart analysis is for educational purposes only, and should not
be construed as a recommendation to buy, sell or sell-short said securities**
Stocks moved higher on Thursday with the Russell 2000 ETF (IWM) and S&P MidCap 400 SPDR (MDY) leading the way. Both gained over 1%...
READ MORE
MEMBERS ONLY
Industrial Metals and Precious Metals Lead Commodity Groups
by Arthur Hill,
Chief Technical Strategist, TrendInvestorPro.com
The US Commodity Groups PerfChart shows the performance for five commodity groups and the CRB Index ($CRB). Energy prices weighed on the CRB Index as the GSCI Energy Index fell over 1% this past month. In contrast, the GSCI Industrial Metals Index ($GYX) and the GSCI Precious Metals Index ($GPX)...
READ MORE
MEMBERS ONLY
Stocks and Bonds Close Lower after Fed Minutes
by Arthur Hill,
Chief Technical Strategist, TrendInvestorPro.com
**This chart analysis is for educational purposes only, and should not
be construed as a recommendation to buy, sell or sell-short said securities**
Stocks went on a wild afternoon run as the Fed minutes hit the tape. Despite a bounce attempt, the major index ETFs sold off and ultimately...
READ MORE
MEMBERS ONLY
Charts: BAC, BIIB, DDD, IDTI, PG, UAL, UPS
by Arthur Hill,
Chief Technical Strategist, TrendInvestorPro.com
BAC Channels back to Broken Resistance.
BIIB Firms after Pullback.
Plus DDD, IDTI, PG, UAL, UPS
Video at end of commentary
**This chart analysis is for educational purposes only, and should not
be construed as a recommendation to buy, sell or sell-short said securities**
Click here for iPad/iPhone...
READ MORE
MEMBERS ONLY
High Volume Gap Provides Support for E*Trade on CandleVolume Chart
by Arthur Hill,
Chief Technical Strategist, TrendInvestorPro.com
The chart below shows E*Trade (ETFC) with CandleVolume charts to accent volume. Upside volume has been strong in general and the stock gapped above 14 with the biggest volume since the mid March gap down. This gap zone around 14 has turned support as the stock firms just above....
READ MORE
MEMBERS ONLY
S&P 500 ETF Recaptures the 50-day
by Arthur Hill,
Chief Technical Strategist, TrendInvestorPro.com
The S&P 500 ETF (SPY) broke below its 50-day moving average on Monday, but moved right back above on Tuesday. This moving average held from December to early June. SPY broke below in late June, but quickly recovered and recaptured the moving average. It looks like another...
READ MORE
MEMBERS ONLY
Selling Pressure Extends for Stocks and Treasuries
by Arthur Hill,
Chief Technical Strategist, TrendInvestorPro.com
**This chart analysis is for educational purposes only, and should not
be construed as a recommendation to buy, sell or sell-short said securities**
Selling pressure continued in both stocks and Treasuries on Monday. These two were negatively correlated most of the last two years, but have been positively correlated...
READ MORE
MEMBERS ONLY
Charts of Interest: CAKE, HCA, HTZ, IACI, WDC
by Arthur Hill,
Chief Technical Strategist, TrendInvestorPro.com
CAKE Stalls Below Prior High.
HCA Extends Flag Correction.
Plus HTZ, IACI, WDC
Video at end of commentary
**This chart analysis is for educational purposes only, and should not
be construed as a recommendation to buy, sell or sell-short said securities**
Click here for iPad/iPhone Version
This commentary...
READ MORE
MEMBERS ONLY
Children's Place Tests Neckline Support
by Arthur Hill,
Chief Technical Strategist, TrendInvestorPro.com
Children's Place formed a head-and-shoulders reversal pattern from late May to August and is currently testing neckline support. Notice that downside volume is outpacing upside volume and On Balance Volume (OBV) broke its June low this month.
Click this image for a live chart...
READ MORE