MEMBERS ONLY
Big Banks Power XLF with New Highs in BAC, JPM and MS
by Arthur Hill,
Chief Technical Strategist, TrendInvestorPro.com
The Finance SPDR (XLF) surged to a fresh 52-week high with leadership from Morgan Stanley (MS), Bank of America (BAC) and JP Morgan (JPM). The CandleGlance chart below shows these three hitting 52-week highs. It is hard to argue with upside leadership from the second biggest sector in the S&...
READ MORE
MEMBERS ONLY
Stocks Consolidate as Dollar Hits Support Zone
by Arthur Hill,
Chief Technical Strategist, TrendInvestorPro.com
Earnings season is turning rather mixed with financials showing strong results and techs more mixed. Morgan Stanley is the latest big financial player to report strong results. Intel, on the other hand, reported weak results with its fourth straight quarterly decline in revenues. Google and Microsoft on are on deck...
READ MORE
MEMBERS ONLY
Charts of Interest: AEO, BRCM, IVZ, LULU, MON
by Arthur Hill,
Chief Technical Strategist, TrendInvestorPro.com
AEO Breaks Down and Shows Relative Weakness.
IVZ Forms Pennant after Support Break.
Plus BRCM, LULU and MON.
Download MP4
This commentary and charts-of-interest are designed to stimulate thinking. This analysis is
not a recommendation to buy, sell, hold or sell short any security (stock ETF or otherwise).
We all...
READ MORE
MEMBERS ONLY
Patterson Energy Perks up with Surge and Bullish Continuation Pattern
by Arthur Hill,
Chief Technical Strategist, TrendInvestorPro.com
Patternson Energy (PTEN) has been lagging the market and the energy sector the last few months, but shows signs of life with a high volume surge and pennant. A pennant breakout would signal a continuation higher and target a move to the next resistance zone. Note that this is an...
READ MORE
MEMBERS ONLY
SPY Stalls Near May High as Raff Channel Marks Support
by Arthur Hill,
Chief Technical Strategist, TrendInvestorPro.com
Today is just like a Fed day because Chairman Bernanke begins his two day testimony before Congress. I would not expect any fireworks from his prepared testimony, but we could see markets react if there are any surprises during the question and answer session. Overall, major index ETFs remain in...
READ MORE
MEMBERS ONLY
Animated GIF shows Apple at Make-or-Break Level within Trading Range
by Arthur Hill,
Chief Technical Strategist, TrendInvestorPro.com
The animated chart below shows Apple at a key resistance zone right now. A double bottom could be forming, but the stock is in a long-term downtrend and stalling in the middle of the three month range. A move above 435 would open the door for a double bottom resistance...
READ MORE
MEMBERS ONLY
Stocks Remain Overbought as Earnings and Fed Heat Up
by Arthur Hill,
Chief Technical Strategist, TrendInvestorPro.com
Trading turned a bit mixed on Monday as stocks digested recent gains ahead of earnings and testimony from Fed Chairman Bernanke. This is a big week for earnings with Goldman Sachs, Coca-Cola and Yahoo! reporting on Tuesday. Wednesday and Thursday are the biggest days though. Bank of America, IBM, Intel...
READ MORE
MEMBERS ONLY
Charts of Interest: AMGN, DNDN, JBLU, PLCM, R
by Arthur Hill,
Chief Technical Strategist, TrendInvestorPro.com
AMGN Breaks Resistance with 7-day Advance.
PLCM Forms 11 month Base.
Plus DNDN, JBLU and R.
This commentary and charts-of-interest are designed to stimulate thinking. This analysis is
not a recommendation to buy, sell, hold or sell short any security (stock ETF or otherwise).
We all need to think for...
READ MORE
MEMBERS ONLY
A Momentum Breakout for the Uranium-Nuclear ETF
by Arthur Hill,
Chief Technical Strategist, TrendInvestorPro.com
The Uranium-Nuclear ETF (NLR) caught a bid last week and broke resistance to forge a 52-week high. Notice that a series of rising troughs (green line) preceded this breakout. The indicator window shows MACD confirming strength with a 52-week high of its own.
Click this image for a live chart...
READ MORE
MEMBERS ONLY
Consumer Discretionary and Finance Sectors Lead Market Higher
by Arthur Hill,
Chief Technical Strategist, TrendInvestorPro.com
Good morning Wall Street! After a little sand and sun, I am back in the saddle and ready to tackle the markets. Stocks and oil are running with the bulls as global economic prospects improve. Treasuries extended their downtrends as non-farm payrolls continued to improve. Money moving out is Treasuries...
READ MORE
MEMBERS ONLY
Utilities SPDR Establishes Resistance with Consolidation
by Arthur Hill,
Chief Technical Strategist, TrendInvestorPro.com
The Utilities SPDR (XLU) is consolidating at a potential support level and traders should watch the consolidation high for a breakout. First, notice how broken resistance and the Fibonacci retracements mark support in the 36-36 area. This is a good spot for a bounce, but a breakout is needed to...
READ MORE
MEMBERS ONLY
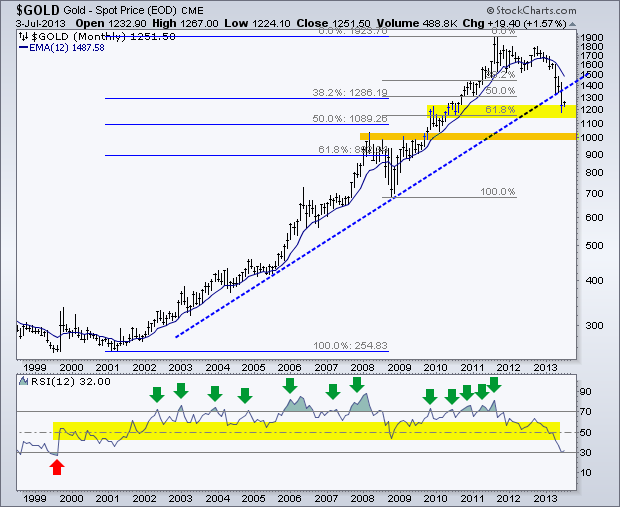
The Case for $1000 Gold
by Arthur Hill,
Chief Technical Strategist, TrendInvestorPro.com
Gold is medium-term oversold and ripe for a bounce, but the long-term trend remains down with a target in the $1000 area. There are two big moves defined by two sets of retracement lines on this chart. The first extends from the 2001 low to the 2011 high (±250 to...
READ MORE
MEMBERS ONLY
Technology SPDR Hits Moment of Truth at Fibonacci Cluster Zone
by Arthur Hill,
Chief Technical Strategist, TrendInvestorPro.com
After a plunge from mid May to mid June, the Technology SPDR (XLK) bounced back to the 31 area to reach its first resistance area. First, broken support turns into resistance here. Second, the Fibonacci retracements tools show a cluster in the 31-31.33 area. Notice that these Fibonacci retracements...
READ MORE
MEMBERS ONLY
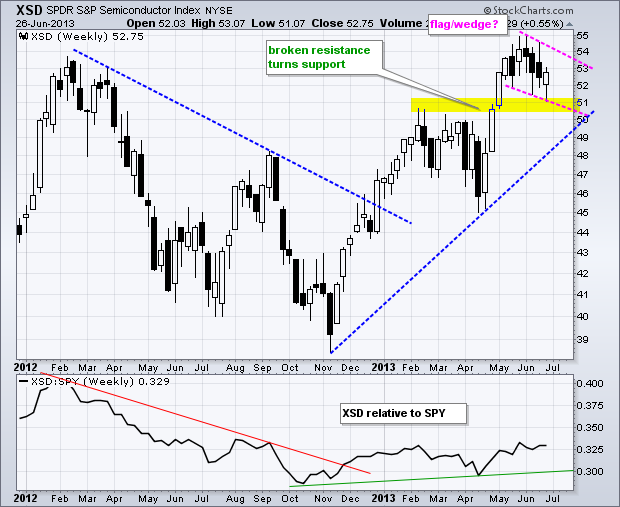
XSD Tests Breakout with Bullish Continuation Pattern
by Arthur Hill,
Chief Technical Strategist, TrendInvestorPro.com
The Semiconductor SPDR (XSD) is consolidating within an uptrend as broken resistance turns first support in the 51 area. A small wedge or pennant formed the last five weeks and a break above 54 would signal a continuation higher. The indicator window shows XSD relative to SPY. Notice how XSD...
READ MORE
MEMBERS ONLY
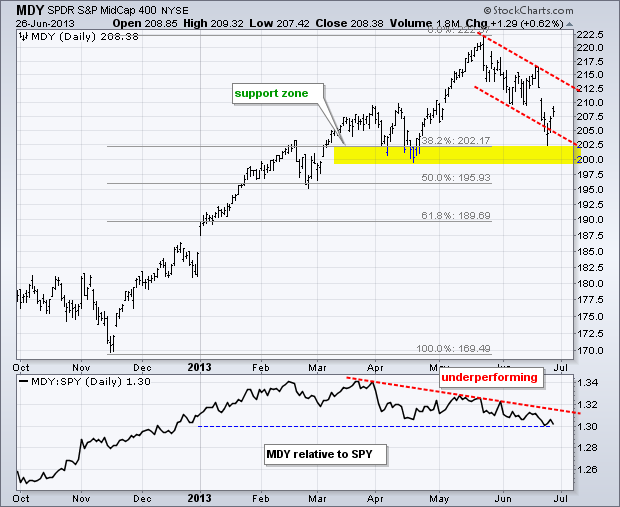
MidCap SPDR Bounces off Support Zone, but Still Lags
by Arthur Hill,
Chief Technical Strategist, TrendInvestorPro.com
After hitting a new high in mid May, the S&P MidCap 400 SPDR (MDY) fell back towards its April lows in June. Combined with the 38.2% retracement, these lows mark support in the 200-202 area. MDY has yet to fully recover from last week's plunge...
READ MORE
MEMBERS ONLY
SPY Hits First Resistance Zone - TLT Consolidates with Pennant
by Arthur Hill,
Chief Technical Strategist, TrendInvestorPro.com
Programming note: I will be on vacation from June 28 to July 12 (Friday to Friday). This is the all important two-week family vacation. My contributions to Art's Charts and the Market Message will resume on Monday, July 15. This will be the pause that refreshes! Thanks in...
READ MORE
MEMBERS ONLY
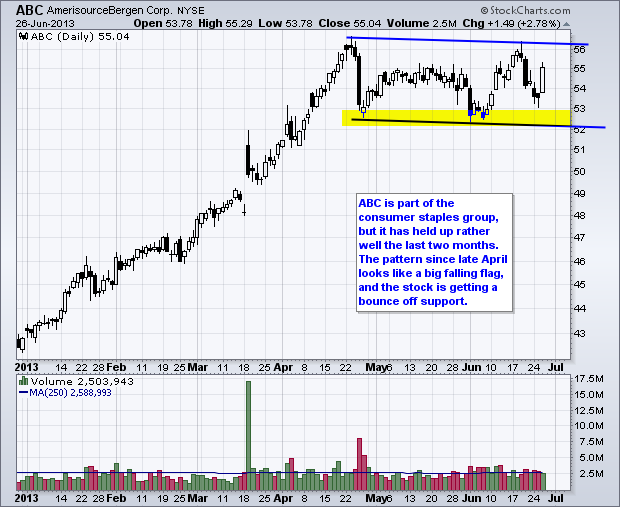
Charts of Interest: ABC, ALL, DOX, MCK, NYT
by Arthur Hill,
Chief Technical Strategist, TrendInvestorPro.com
ABC Extends Long Consolidation.
ALL Challenges Support Break.
Plus DOX, MCK and NYT.
This commentary and charts-of-interest are designed to stimulate thinking. This analysis is
not a recommendation to buy, sell, hold or sell short any security (stock ETF or otherwise).
We all need to think for ourselves when it...
READ MORE
MEMBERS ONLY
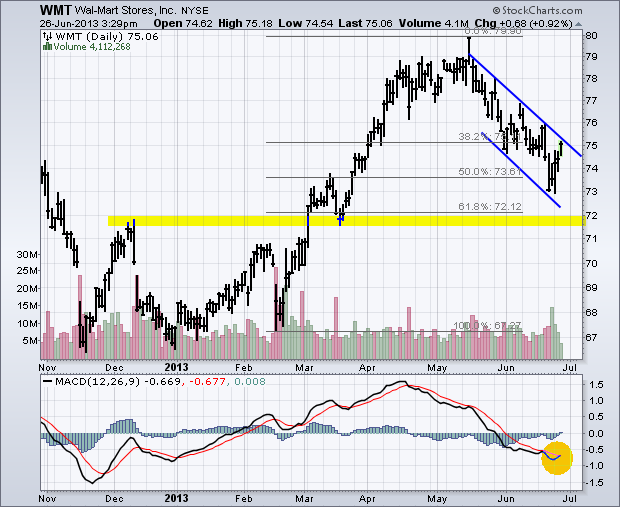
Wal-mart Comes Across Bullish Momentum Scan
by Arthur Hill,
Chief Technical Strategist, TrendInvestorPro.com
Wal-mart corrected with the rest of the market over the last two months and retraced 50-61.80% of its prior advance with a falling channel. The correction stopped just short of broken resistance in the 72 area as prices surged back above 75 the last few days. Also notice that...
READ MORE
MEMBERS ONLY
Dollar Holds its Breakout - Treasuries Remain Oversold
by Arthur Hill,
Chief Technical Strategist, TrendInvestorPro.com
Programming note: I will be on vacation from June 28 to July 12 (Friday to Friday). This is the all important two-week family vacation. My contributions to Art's Charts and the Market Message will resume on Monday, July 15. This will be the pause that refreshes! Thanks in...
READ MORE
MEMBERS ONLY
S&P 500 Breaks Bullish Support Line On P&F Chart
by Arthur Hill,
Chief Technical Strategist, TrendInvestorPro.com
With a move below 1570, the S&P 500 broke the blue Bullish Support Line and a new Bearish Resistance Line has been drawn (red). Looking at price action, there is a lot of support in the 1535-1540 area and this is the next target. Notice the three O-Columns...
READ MORE
MEMBERS ONLY
SPY and QQQ Become Oversold after Sharp Declines
by Arthur Hill,
Chief Technical Strategist, TrendInvestorPro.com
Stocks moved lower again on Monday with broad-based selling pressure. The decline was, however, contained because the major index ETFs gapped down, bounced and then moved lower in the final hour. All sectors were down with the Industrials SPDR (XLI) and Finance SPDR (XLF) leading the way. The defensive sectors...
READ MORE
MEMBERS ONLY
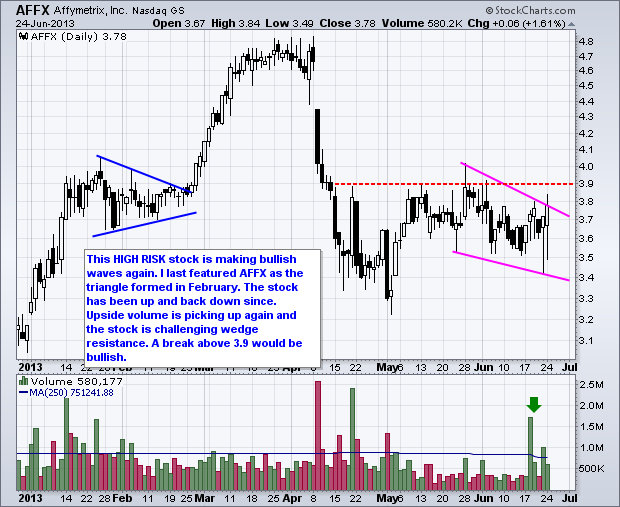
Charts of Interest: AFFX, ARUN, CHKP, FB, IPI
by Arthur Hill,
Chief Technical Strategist, TrendInvestorPro.com
AFFX Returns to Support and Firms with Good Volume.
ARUN Shows Relative Strength in June.
Plus CHKP, FB, IPI
This commentary and charts-of-interest are designed to stimulate thinking. This analysis is
not a recommendation to buy, sell, hold or sell short any security (stock ETF or otherwise).
We all need...
READ MORE
MEMBERS ONLY
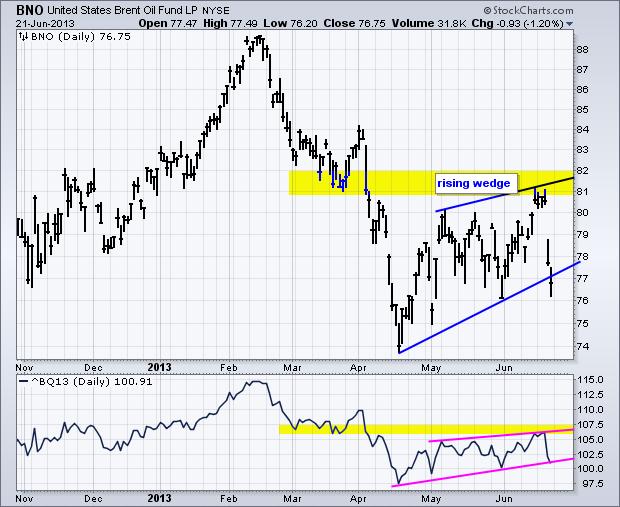
Brent Oil ETF Confirms Bearish Continuation Pattern
by Arthur Hill,
Chief Technical Strategist, TrendInvestorPro.com
Weakness in stocks and strength in the Dollar weighed on oil as Spot Light Crude ($WTIC) and Brent futures fell sharply. The chart below shows Brent Crude ETF (BNO) breaking wedge support with a plunge below 77. The indicator window shows August Brent (^BQ13) falling and testing the wedge trend...
READ MORE
MEMBERS ONLY
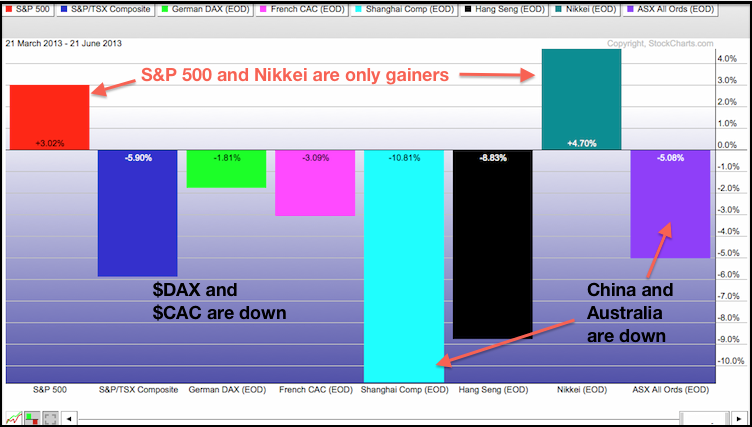
Stocks, Oil and Gold Broke Down and Now China is Plunging
by Arthur Hill,
Chief Technical Strategist, TrendInvestorPro.com
Chinese equities were hit hard on Monday with the Hang Seng Index ($HSI) falling over 2% and the Shanghai Composite ($SSEC) plunging over 5%. A surge in overnight repo rates (Chibor) is to blame. Note that the US experienced a similar rate surge just before the Lehman collapse. While I...
READ MORE
MEMBERS ONLY
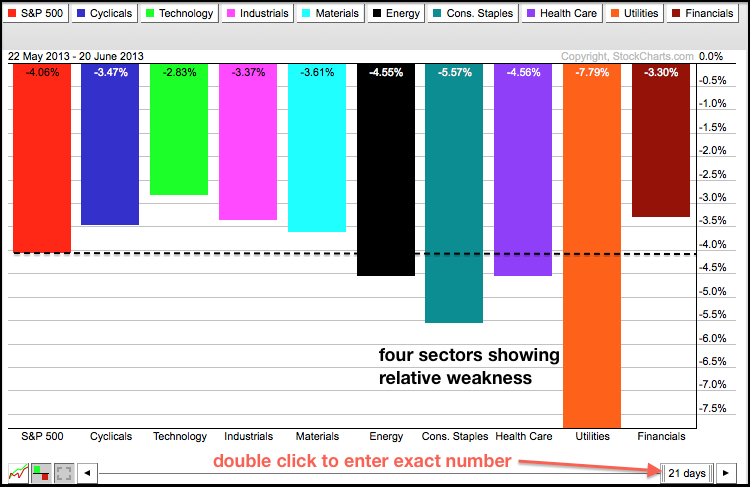
Defensive Sectors Offer no Safety and Lead the Way Lower
by Arthur Hill,
Chief Technical Strategist, TrendInvestorPro.com
The stock market peaked on May 22 and all sectors are down since then. The S&P 500 is down 4.09%, but the Consumer Staples SPDR (XLP), Healthcare SPDR (XLV) and Utilities SPDR (XLU) are down more and showing relative weakness. XLU is down a whopping 7.79%...
READ MORE
MEMBERS ONLY
NYSE Net New Highs Plunge as VIX Surges
by Arthur Hill,
Chief Technical Strategist, TrendInvestorPro.com
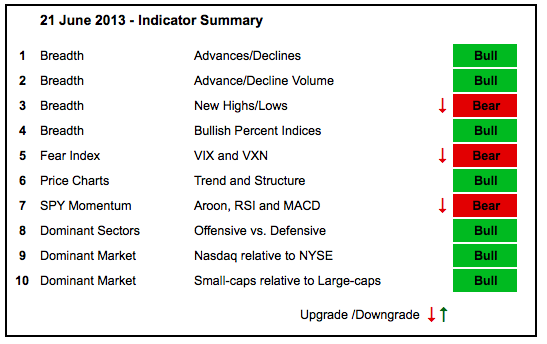
With weakness throughout June, three indicators were downgraded to bearish in the indicator summary. It is a rather strange trio though. Net New Highs are considered bearish because NYSE Net New Highs plunged to their lowest reading in over a year. The VIX surged above 20% to show the most...
READ MORE
MEMBERS ONLY
Stocks and Oil Break Down - Dollar Breaks Out
by Arthur Hill,
Chief Technical Strategist, TrendInvestorPro.com
Stocks were hit hard with the major index ETFs falling over 2% on the day. Even though this decline looks massive on a short-term basis, it is relatively small on a six to twelve month timeframe. All sectors were down with the defensive sectors leading the way lower, which is...
READ MORE
MEMBERS ONLY
Where's the Green? Juniper and JDS Uniphase Buck the Selling.
by Arthur Hill,
Chief Technical Strategist, TrendInvestorPro.com
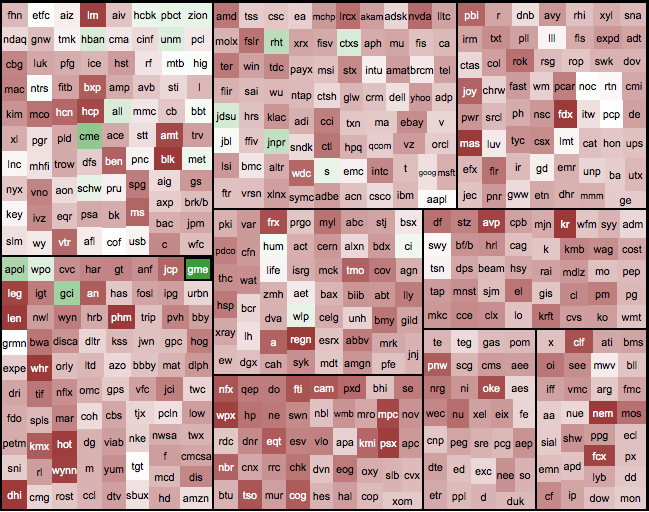
The stock market is down sharply on Thursday, but there are a few green shoots on the sector Market Carpet. In the technology sector, notice that Redhat (RHT), Citrix (CTXS), JDS Uniphase and Juniper (JNPR) are up so far today. In fact, the technology sector is holding up relatively well...
READ MORE
MEMBERS ONLY
SPY Fails at Key Retracement - UUP Surges
by Arthur Hill,
Chief Technical Strategist, TrendInvestorPro.com
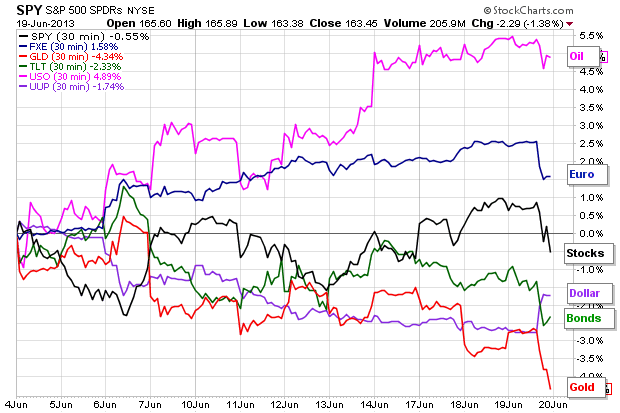
Stocks tried to front run the Fed and got burned when Bernanke stuck to his guns on tapering. The S&P 500 ETF (SPY) was up over 3% in the run up to the Fed meeting and fell 1.38% on Wednesday. The sharp decline in stocks warranted a...
READ MORE
MEMBERS ONLY
Charts of Interest: CB, FCX, JBHT, MAR, VRSN
by Arthur Hill,
Chief Technical Strategist, TrendInvestorPro.com
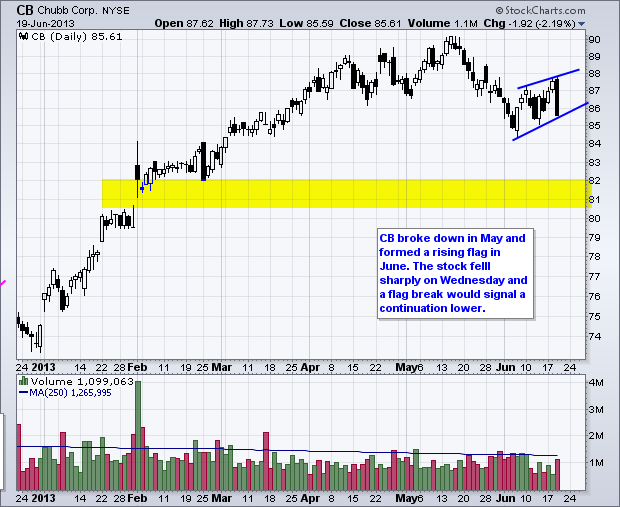
Bearish Continuation Patterns Takes Shape for CB.
FCX Cannot Hold a Bid.
Plus JBHT, MAR and VRSN.
This commentary and charts-of-interest are designed to stimulate thinking. This analysis is
not a recommendation to buy, sell, hold or sell short any security (stock ETF or otherwise).
We all need to think...
READ MORE
MEMBERS ONLY
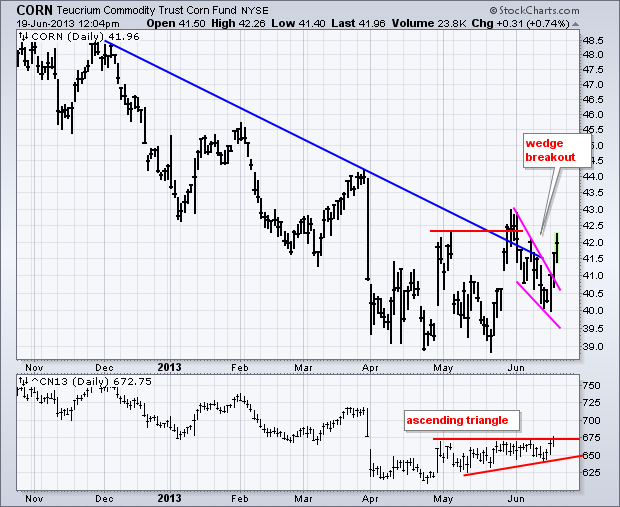
Corn ETN Leads Surge in Softs
by Arthur Hill,
Chief Technical Strategist, TrendInvestorPro.com
The Corn ETN (CORN) is leading a surge in soft commodities. The chart below shows the ETN breaking out in late May and then falling back in June with a wedge. The wedge low held above the prior lows and the ETN broke wedge resistance with a strong move the...
READ MORE
MEMBERS ONLY
IWM Breaks Channel Resistance - GLD Breaks Down Again
by Arthur Hill,
Chief Technical Strategist, TrendInvestorPro.com
Stocks extended their upswing as the major index ETFs broke channel resistance. Small-caps led this week's advanced as the IWM:SPY ratio moved to its highest level of the month. Relative strength in small caps suggests a good appetite for risk at the moment. There is a lot...
READ MORE
MEMBERS ONLY
Agribusiness ETF Attempts to Firm within Wedge
by Arthur Hill,
Chief Technical Strategist, TrendInvestorPro.com
The Agribusiness ETF (MOO) broke channel resistance with a surge above 55, but fell back rather sharply over the last four weeks. The five week trend is down as a falling wedge takes shape. Even though the ETF firmed the last five days, it remains short of a trend reversing...
READ MORE
MEMBERS ONLY
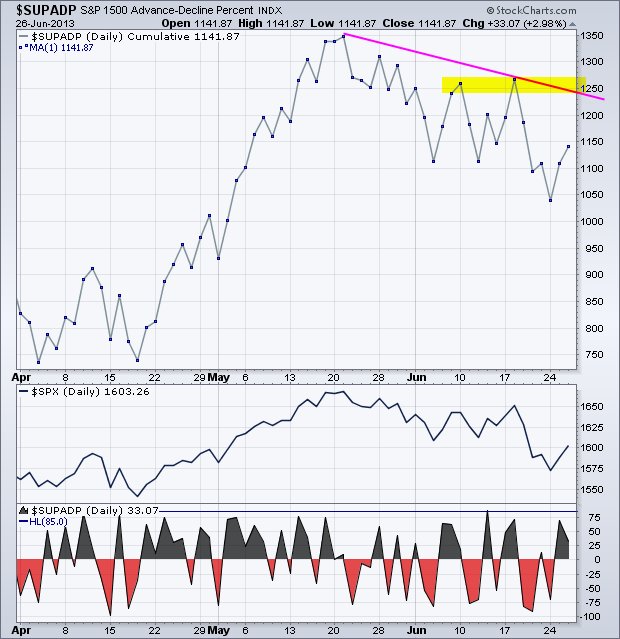
Watching Key Resistance for SPX and the Breadth Lines
by Arthur Hill,
Chief Technical Strategist, TrendInvestorPro.com
Stocks surged on the open on Monday, fell back in the afternoon and then popped near the close. Intraday price action was not that impressive because there was really no follow through to the morning surge. Even though the major index ETFs finished with modest gains on the day, they...
READ MORE
MEMBERS ONLY
Charts of Interest: ADI, ETFC, FDX, HON, NBR, PG, TSO
by Arthur Hill,
Chief Technical Strategist, TrendInvestorPro.com
ADI Surges with Two Bullish Patterns at Work.
ETFC Forms Bullish Consolidation after Big Surge.
Plus FDX, HON, NBR, PG, TSO
This commentary and charts-of-interest are designed to stimulate thinking. This analysis is
not a recommendation to buy, sell, hold or sell short any security (stock ETF or otherwise).
We...
READ MORE
MEMBERS ONLY
Netflix Holds Gap with Another Gap
by Arthur Hill,
Chief Technical Strategist, TrendInvestorPro.com
Netflix, which is no stranger to gaps, gapped up in April held this gap throughout May. A falling wedge pushed the stock back toward the gap zone in June, but this wedge ended with a gap on good volume. The breakout-gap is bullish as long as it holds.
Click this...
READ MORE
MEMBERS ONLY
SPY and IWM Consolidate with Channels - USO Breaks Out
by Arthur Hill,
Chief Technical Strategist, TrendInvestorPro.com
Trading has sure been choppy the last four weeks, and it could get even choppier as the Fed meets this week. Ugh. The talk of Fed tapering began 4-5 weeks ago and this triggered an adjustment in the markets. The PerfChart below shows the S&P 500, the 10-year...
READ MORE
MEMBERS ONLY
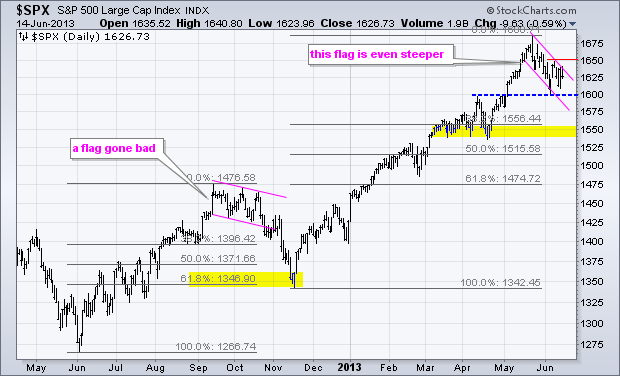
S&P 500 Remains with a Flag that Refuses to Fly
by Arthur Hill,
Chief Technical Strategist, TrendInvestorPro.com
The S&P 500 got a two day bounce last week and a nice surge on Thursday, but fell back Friday as it met resistance at 1650, which is now the short-term level to beat. Overall, notice that the index formed a falling flag type correction the last four...
READ MORE
MEMBERS ONLY
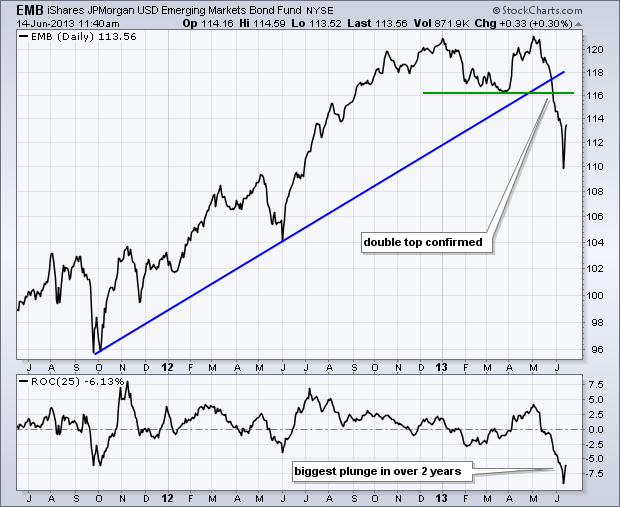
Emerging Market Bond ETF Confirms Bearish Reversal Pattern
by Arthur Hill,
Chief Technical Strategist, TrendInvestorPro.com
The iShares Emerging Market Bond ETF (EMB) formed a double top from December to May and confirmed this pattern with a support break in late May. Notice that the ETF fell over 8% as rumors of Fed tapering hit the market. This decline reflects some serious chaos and surely rattled...
READ MORE
MEMBERS ONLY
NYSE New Lows Expand, but Indicators Still Bullish Overall
by Arthur Hill,
Chief Technical Strategist, TrendInvestorPro.com
There is still no change in the indicator summary. Stocks corrected last four weeks and this correction weighed on the NYSE the most. The NYSE AD Line fell, but remains in an uptrend overall. NYSE Net New Highs turned negative for the first time since November. While I am concerned...
READ MORE