MEMBERS ONLY
IWM Nears Channel Resistance - UUP Sets Possible Bear Trap
by Arthur Hill,
Chief Technical Strategist, TrendInvestorPro.com
Stocks finished the week on a high note with the Dow Industrials closing above 14000 for the first time since 2007. The trend since mid November is pretty much straight up with the major index ETFs up double digits since these lows. The S&P 500 is up around...
READ MORE
MEMBERS ONLY
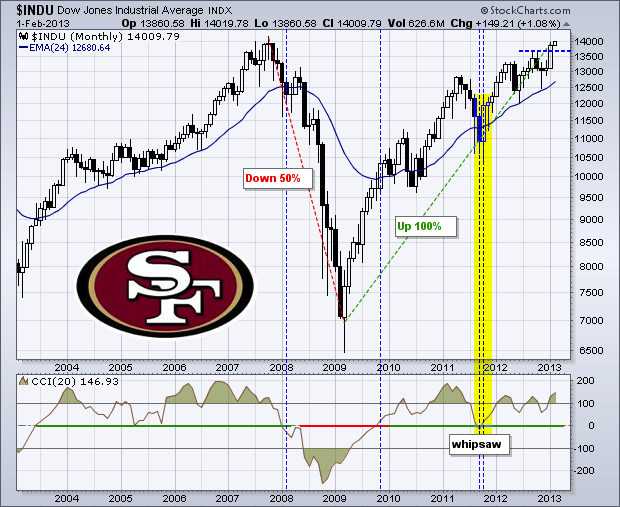
DOW MAKES A ROUND TRIP WITH 100% GAIN
by Arthur Hill,
Chief Technical Strategist, TrendInvestorPro.com
With a 150-point gain to end the week, the Dow Industrials closed above the next big number (14000) and hit a significant milestone. There is usually nothing special about round numbers, such as 14000, but this number is special because the Dow failed at 14000 in 2007. The financial crisis...
READ MORE
MEMBERS ONLY
This is What Risk-On Looks Like
by Arthur Hill,
Chief Technical Strategist, TrendInvestorPro.com
The markets are clearly in the mood to embrace risk. The S&P 500 and Spot Light Crude ($WTIC) are up over 10% since mid November, and the Euro Index ($XEU) is up over 6%. In contrast, the 30-Year US Treasury ($USB) and the US Dollar Index ($USD) are...
READ MORE
MEMBERS ONLY
Indicators Remain Strong, but Stocks are Overbought
by Arthur Hill,
Chief Technical Strategist, TrendInvestorPro.com
Stocks stalled the last four days, but this is not enough to affect the indicators, nine of which remain in bull mode. The major index ETFs are clearly overbought and the world is calling for a pullback, but we have yet to see it. I suspect we will get one...
READ MORE
MEMBERS ONLY
DBC Breaks Resistance - QQQ Tests Channel Support
by Arthur Hill,
Chief Technical Strategist, TrendInvestorPro.com
Stocks finished the day mixed as the market awaits the employment report. The Dow Industrials SPDR (DIA) edged lower, but the S&P MidCap 400 SPDR (MDY) edged higher. The sectors were mostly lower with the Basic Materials SPDR (XLB) falling around 1%. Declines in the Gold Miners ETF...
READ MORE
MEMBERS ONLY
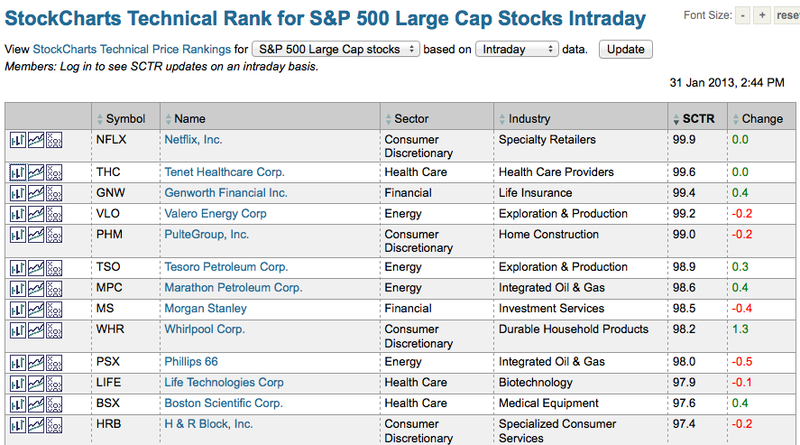
Tenet Healthcare and Boston Scientific Lead SCTR Table
by Arthur Hill,
Chief Technical Strategist, TrendInvestorPro.com
Want to find the leaders in the S&P 500? The StockCharts Technical Rank (SCTR) ranks the 500 S&P stocks from 0 to 100. The top 50 stocks in the index have scores from 90 to 100. These are deemed the stocks with the strongest technicals and...
READ MORE
MEMBERS ONLY
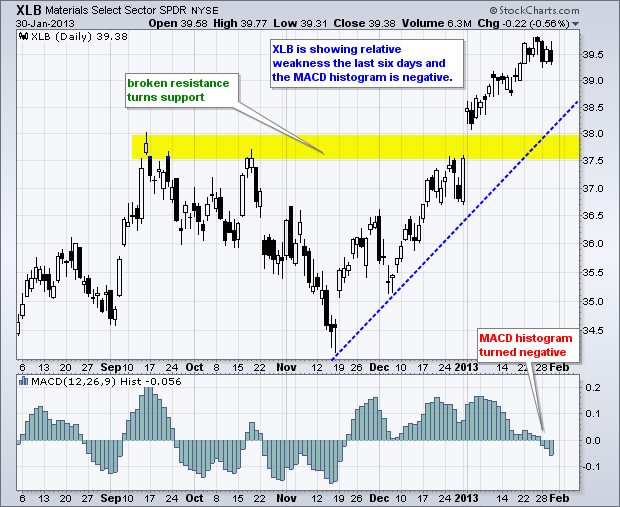
XLB Underperforms - SPY Hugs Channel Trend Line
by Arthur Hill,
Chief Technical Strategist, TrendInvestorPro.com
The bulls finally took a breather as stocks succumbed to some selling pressure on Wednesday. Small-caps led the way lower as the Russell 2000 ETF (IWM) fell over 1%. All sectors were down with the Industrials SPDR (XLI) falling .91% on the day. Given the run ups over the last...
READ MORE
MEMBERS ONLY
Charts of Interest: CIEN, KO, MBI, S, USB, WSM
by Arthur Hill,
Chief Technical Strategist, TrendInvestorPro.com
Careful out there.
It is earnings season, the employment report is Friday and the new month starts.
CIEN Breaks Down and Underperforms.
MBI Forms Triangle and Bounces on Good Volume.
Plus KO, S, USB, WSM
This commentary and charts-of-interest are designed to stimulate thinking. This analysis is
not a recommendation...
READ MORE
MEMBERS ONLY
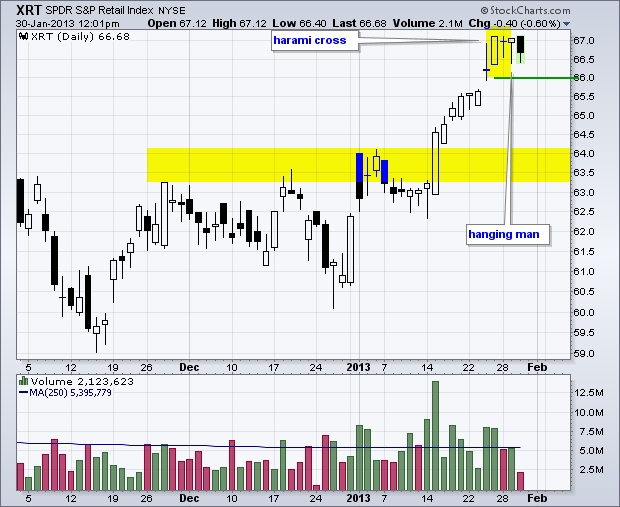
Bearish Candlesticks Take Shape for the Retail SPDR
by Arthur Hill,
Chief Technical Strategist, TrendInvestorPro.com
The bigger trends are clearly up for the Retail SPDR (XRT) as the ETF broke resistance with a big surge in January. However, XRT is short-term overbought after a big move and bearish candlesticks are taking shape. A harami-cross formed on Friday-Monday and a hanging man formed on Tuesday. A...
READ MORE
MEMBERS ONLY
SPY Extends Gains - USO Breaks Pennant Resistance
by Arthur Hill,
Chief Technical Strategist, TrendInvestorPro.com
Stocks started the day weak, but then caught a bid and the broad market indices moved higher the rest of the day. The final gains were not that big with the S&P 500 ETF (SPY) advancing .39% and the Dow Industrials SPDR (DIA) closing .42% higher. The sectors...
READ MORE
MEMBERS ONLY
RIMM Gap Turns into Exhaustion Gap with Fill
by Arthur Hill,
Chief Technical Strategist, TrendInvestorPro.com
Research in Motion (RIMM) has been one of the best performing stocks since late September. There is, however, evidence that the advance has exhausted itself as RIMM filled last week's gap above 16. This fill makes it an exhaustion gap that could give way to a retracement of...
READ MORE
MEMBERS ONLY
QQQ Bounces off Channel Line - UUP Forms Falling Flag
by Arthur Hill,
Chief Technical Strategist, TrendInvestorPro.com
Stocks started the week mixed with the Russell 2000 ETF (IWM) edging higher and the S&P 500 ETF (SPY) edging lower. And I do mean "edging" because the moves were fractional. The sectors were also mixed with the Basic Materials SPDR (XLB) falling around 1% and...
READ MORE
MEMBERS ONLY
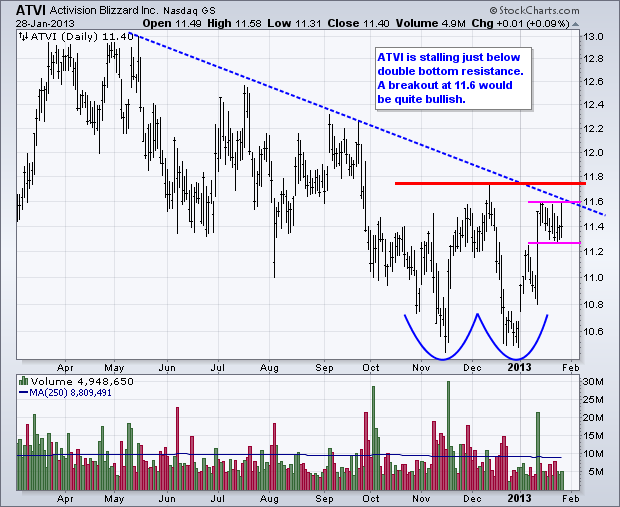
Charts of Interest: ATVI, BIDU, CHS, CVG, EA, GME
by Arthur Hill,
Chief Technical Strategist, TrendInvestorPro.com
Careful out there. Earnings seaon is in full swing.
ATVI Forms Flag Just Below Resistance.
BIDU Breaks Flag Resistance with Volume.
Plus CHS, CVG, EA, GME
This commentary and charts-of-interest are designed to stimulate thinking. This analysis is
not a recommendation to buy, sell, hold or sell short any security...
READ MORE
MEMBERS ONLY
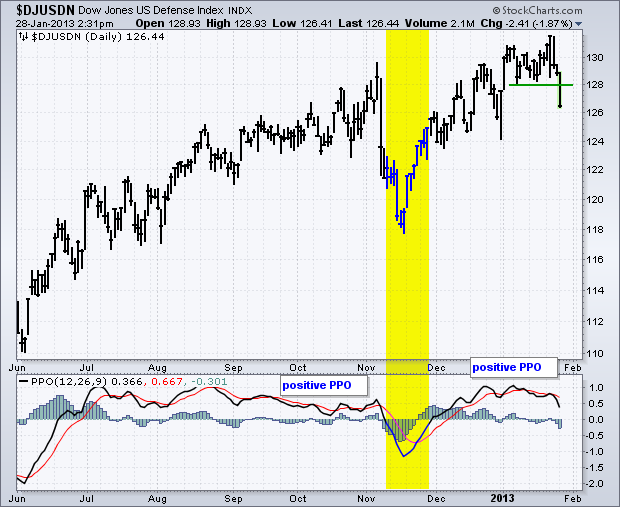
Defense Index Breaks Support on Sequestration Fears
by Arthur Hill,
Chief Technical Strategist, TrendInvestorPro.com
The DJ US Defense Index ($DJUSDN) was hit hard the last three days and broke below the January lows. This index is now down for the year, which means it is underperforming the broader market. The indicator window shows the Percent Price Oscillator (PPO) turning lower, but remaining in positive...
READ MORE
MEMBERS ONLY
Dow Surges to New High - TLT Breaks Down
by Arthur Hill,
Chief Technical Strategist, TrendInvestorPro.com
What more could a stock market want? The S&P 500 advanced the last eight days in a row and closed at a 52-week high. The Dow surged some 400 points in the last six days. Treasury bonds fell as market participants moved from safe-havens to riskier assets. The...
READ MORE
MEMBERS ONLY
Point & Figure Triple Top Breakouts Outpace Triple Bottom Breakdowns
by Arthur Hill,
Chief Technical Strategist, TrendInvestorPro.com
The P&F pattern table on the predefined scans page is a good place to gauge the long-term trend for the stock market. As with a Bullish Percent Index, chartists simply need to pick a pattern and then compare the number of stocks on bullish P&F signals...
READ MORE
MEMBERS ONLY
Majority of Indicators Remain in Bull Mode
by Arthur Hill,
Chief Technical Strategist, TrendInvestorPro.com
There are no changes in the indicator summary because stocks remained strong this week. QQQ and XLK were dragged down by Apple, but the Nasdaq 100 Equal-Weight ETF (QQEW) hit a new high, which means the average tech stock is doing just fine. The NYSE AD Line remains on an...
READ MORE
MEMBERS ONLY
QQQ Falls to Channel Trend Line - FXE Forms Flat Flag
by Arthur Hill,
Chief Technical Strategist, TrendInvestorPro.com
The broad market indices edged higher on Thursday, but Apple dominated ETFs moved lower (QQQ and XLK). Note that the Nasdaq 100 Equal-Weight ETF (QQEW) advanced .43% and the FirstTrust Internet ETF (FDN) was up over 2%. The Basic Materials SPDR (XLB) was up on the day, but several industry...
READ MORE
MEMBERS ONLY
Adobe Leaves Apple in the Dust
by Arthur Hill,
Chief Technical Strategist, TrendInvestorPro.com
Apple may not support flash on its iPhone and iPad, but that does not seem to bother Adobe (ADBE) shareholders. Adobe lagged Apple throughout 2012, but may be having the last laugh as it starts to outperform. Apple is up less than 5% over the last 12 months, while Adobe...
READ MORE
MEMBERS ONLY
QQQ Fails to Hold Breakout as AAPL Breaks Support
by Arthur Hill,
Chief Technical Strategist, TrendInvestorPro.com
Apple whiffed and the stock is trading sharply lower after hours. This means the Nasdaq, QQQ and the Technology SPDR (XLK) will also be down in early trading on Thursday. It seems to be an Apple and big tech specific issue because the Dow futures are up slightly and the...
READ MORE
MEMBERS ONLY
Charts of Interest: AMKR, ESRX, JBL, ORLY, PNRA, YUM
by Arthur Hill,
Chief Technical Strategist, TrendInvestorPro.com
ESRX Underperforms and Tests Wedge Support.
ORLY Firms at Support with Good Volume.
Plus AMKR, JBL, PNRA, YUM
This commentary and charts-of-interest are designed to stimulate thinking. This analysis is
not a recommendation to buy, sell, hold or sell short any security (stock ETF or otherwise).
We all need to...
READ MORE
MEMBERS ONLY
Silver Miners ETF Breaks Channel Support
by Arthur Hill,
Chief Technical Strategist, TrendInvestorPro.com
The Silver Miners ETF (SIL) is having a tough time this year with a failed gap and now a move below the early January low. After breaking down in November, the ETF formed a rising channel the last two months. SIL broke channel support today and continues to show relative...
READ MORE
MEMBERS ONLY
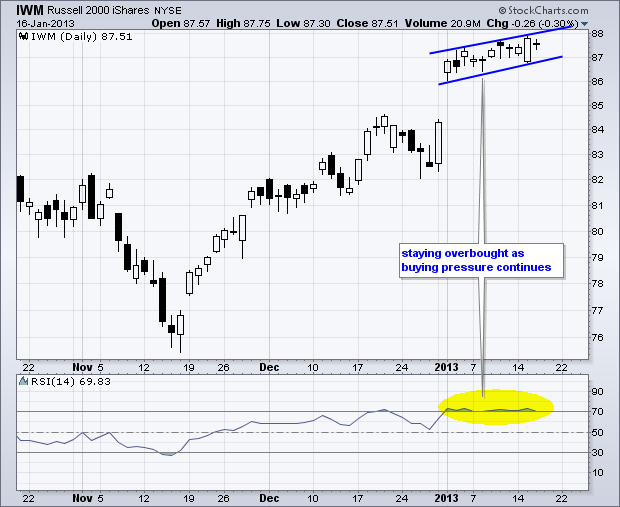
IWM Accelerates Higher as QQQ Stalls Near Resistance
by Arthur Hill,
Chief Technical Strategist, TrendInvestorPro.com
Stocks extended their gains on Tuesday with the Russell 2000 ETF (IWM) and S&P MidCap 400 SPDR (MDY) leading the way higher. Small-caps and mid-caps have been leading this market since mid November and show no signs of slowing down. Finance, materials, energy and utilities led the sectors...
READ MORE
MEMBERS ONLY
Utilities Perk up and Lead for a Day
by Arthur Hill,
Chief Technical Strategist, TrendInvestorPro.com
The Utilities SPDR (XLU) is showing some upside leadership on Tuesday with a .95% gain. This makes XLU the top performing sector so far. Energy (XLE), Financials (XLF) and Materials (XLB) are also performing well. You can find more leaders and laggards on the market summary page.
Click this image...
READ MORE
MEMBERS ONLY
SPY Holds Rising Channel - GLD Challenges Resistance
by Arthur Hill,
Chief Technical Strategist, TrendInvestorPro.com
Stocks surged out of the gates to start 2013 and the S&P 500 ETF (SPY) closed at its highest level of the year (13 days). Buying pressure continues has we head into a big week for earnings. Some 100 reports are scheduled today, around 120 on Wednesday and...
READ MORE
MEMBERS ONLY
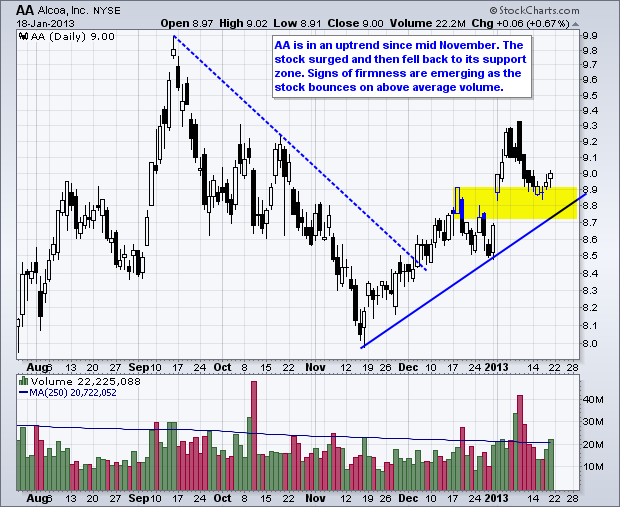
Charts of Interest: AA, PCG, RDC, SO
by Arthur Hill,
Chief Technical Strategist, TrendInvestorPro.com
Care out there. It is earnings season.
AA Falls back to Firs Support Zone.
PCG Surges and Forms Pennant.
Plus RDC and SO.
This commentary and charts-of-interest are designed to stimulate thinking. This analysis is
not a recommendation to buy, sell, hold or sell short any security (stock ETF or...
READ MORE
MEMBERS ONLY
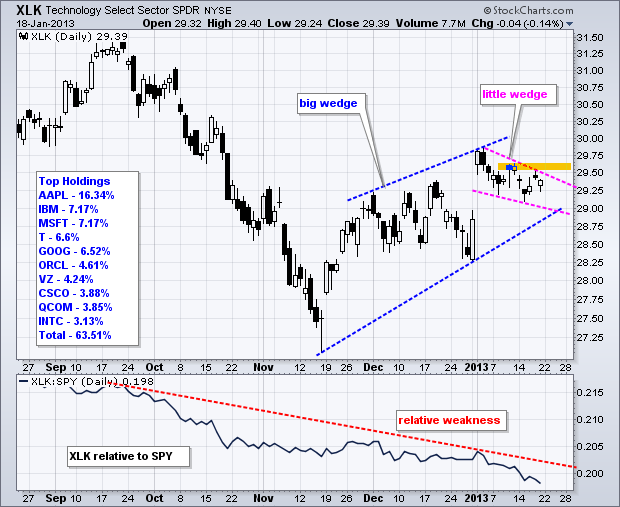
It's Big Wedge Versus Little Wedge for XLK
by Arthur Hill,
Chief Technical Strategist, TrendInvestorPro.com
The Technology SPDR (XLK) has been lagging the broader market for some time now, but the trend since mid November remains up and a bullish continuation pattern is taking shape this month. Weighed down by its top components, XLK has been lagging the S&P 500 ETF since September....
READ MORE
MEMBERS ONLY
Google Fills Gap and Shows Relative Weakness
by Arthur Hill,
Chief Technical Strategist, TrendInvestorPro.com
Stocks moved higher this week, but Google (GOOG) did not partake and fell rather sharply. Notice that the stock broke the November trend line and filled the 2-Jan gap. Yes, GOOG is below its 2-Jan open . The price relative (GOOG:SPY ratio) turned down and broke support this week. GOOG...
READ MORE
MEMBERS ONLY
Net New Highs Surge on NYSE and Nasdaq
by Arthur Hill,
Chief Technical Strategist, TrendInvestorPro.com
The only thing the bulls have to fear is bullishness itself. In other words, the bulk of the evidence is bullish, but stocks are getting overbought because the S&P 500 is up 10% since mid November (two months). The Russell 2000 ($RUT) is up over 15%. Except for...
READ MORE
MEMBERS ONLY
QQQ Challenges Resistance - TLT Fails at Resistance
by Arthur Hill,
Chief Technical Strategist, TrendInvestorPro.com
Stocks surged on Thursday with the S&P 500 hitting multi year highs. The Nasdaq and the Dow also surged and are poised to challenge their September highs. Stocks were buoyed by a surprisingly large jump in housing starts and a large decline in initial jobless claims. Even though...
READ MORE
MEMBERS ONLY
Big Banks Lead Lower on Most Active Lists
by Arthur Hill,
Chief Technical Strategist, TrendInvestorPro.com
The Dow is up triple digits and close to its Sep-Oct highs, but the NYSE most active list shows more decliners than gainers (7 to 3). Big banks (BAC,C,JPM) are leading the way lower on profit taking. The Nasdaq most active list, in contrast, shows nine up and...
READ MORE
MEMBERS ONLY
QQQ Forms Pennant - TLT Hits Resistance Zone
by Arthur Hill,
Chief Technical Strategist, TrendInvestorPro.com
Trading remains mixed overall, but the bias is still bullish as the major index ETFs hold their New Year's gains. SPY, MDY, QQEW and IWM have edged higher since gapping up on 2-Jan. QQQ, which has been weighed down by Apple, has traded flat. The bulls have the...
READ MORE
MEMBERS ONLY
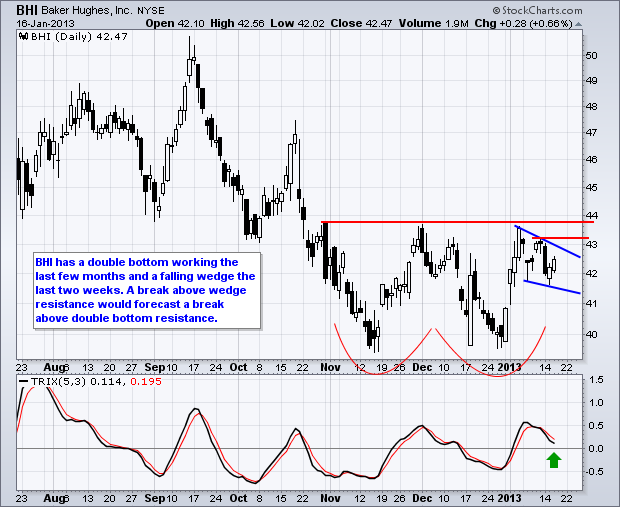
Charts of Interest: BHI, BRCM, GRMN, LH, ORLY, SCHL
by Arthur Hill,
Chief Technical Strategist, TrendInvestorPro.com
BRCM Holds Gap with Flat Flag.
GRMN Breaks Support and Forms Bear Flag.
Plus BHI, LH, ORLY, SCHL
This commentary and charts-of-interest are designed to stimulate thinking. This analysis is
not a recommendation to buy, sell, hold or sell short any security (stock ETF or otherwise).
We all need to...
READ MORE
MEMBERS ONLY
Risk is the Word as Stocks and Oil Lead Higher
by Arthur Hill,
Chief Technical Strategist, TrendInvestorPro.com
The markets have been in risk-on mode since mid November and continue to embrace risk. The chart below shows the S&P 500 ETF (SPY) and US Oil Fund (USO) performing the best. The 20+ Year T-Bond ETF (TLT) is performing the worst. Also note that the Euro Currency...
READ MORE
MEMBERS ONLY
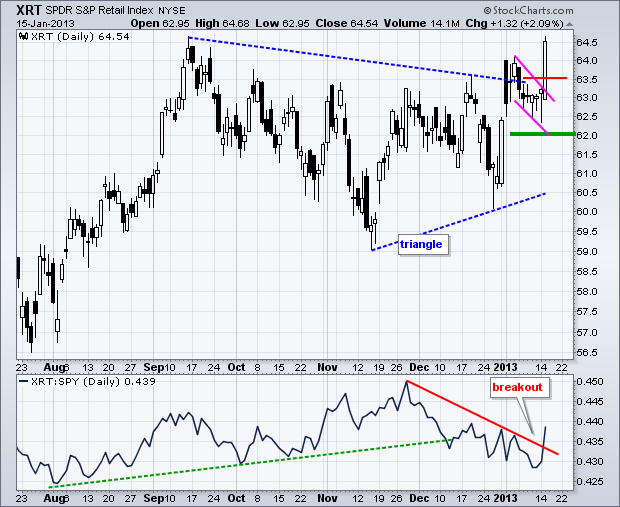
XRT Breaks Wedge Resistance and XLY Hits New High
by Arthur Hill,
Chief Technical Strategist, TrendInvestorPro.com
It is getting to be a familiar story. Stocks in general edged higher, but the Nasdaq 100 ETF (QQQ) edged lower because of weakness in Apple. AAPL broke support at 500 with a sharp decline on Tuesday. The company reports next Wednesday after the close. This is definitely one of...
READ MORE
MEMBERS ONLY
Activision Surges Off Support to Form Double Bottom
by Arthur Hill,
Chief Technical Strategist, TrendInvestorPro.com
Activision (ATVI) came to life with a gap and high-volume surge off support in 2013. The stock remains in a long-term downtrend, but could be forming a double bottom over the last three months. A break above the December high would confirm the pattern and reverse the downtrend.
Click this...
READ MORE
MEMBERS ONLY
QQQ Continues to Lag - GLD Consolidates with Triangle
by Arthur Hill,
Chief Technical Strategist, TrendInvestorPro.com
Stocks were mixed on Monday with the Dow Industrials SPDR (DIA) and Nasdaq 100 Equal-Weight ETF (QQEW) edging higher, while the Nasdaq 100 ETF (QQQ) and S&P 500 ETF (SPY) edged lower. QQQ was weighed down by weakness in QCOM, AAPL and GOOG. The Dow was helped by...
READ MORE
MEMBERS ONLY
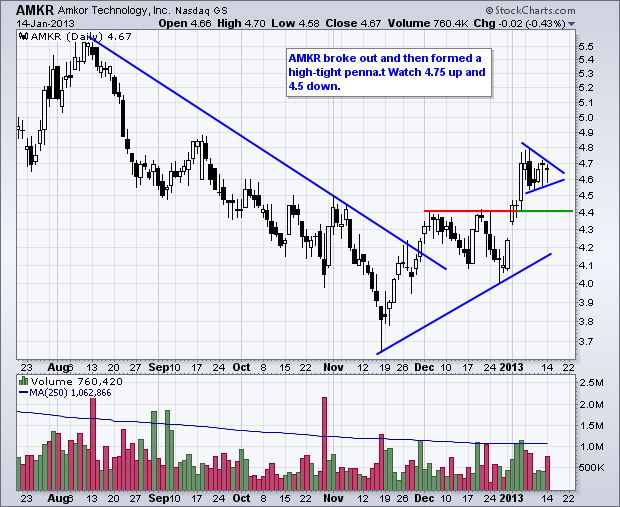
Charts of Interest: AMKR, AVP, CSX, EA, IBM, KGC, RSD/A
by Arthur Hill,
Chief Technical Strategist, TrendInvestorPro.com
AMKR Forms High-Tight Pennant.
AVP Firms at Key Retracement.
Plus CSX, EA, IBM, KGC, RSD/A
This commentary and charts-of-interest are designed to stimulate thinking. This analysis is
not a recommendation to buy, sell, hold or sell short any security (stock ETF or otherwise).
We all need to think for...
READ MORE
MEMBERS ONLY
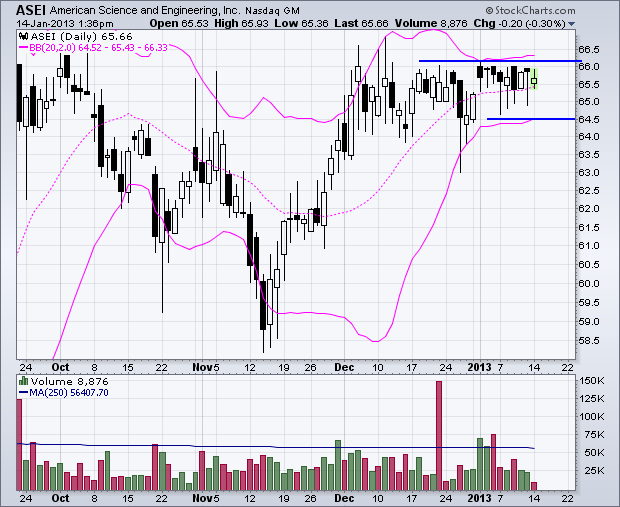
The Squeeze is on for American Science and Engineering
by Arthur Hill,
Chief Technical Strategist, TrendInvestorPro.com
American Science and Engineering (ASEI) surged in November and then moved into a trading range the last six week. Notice that volatility is contracting as the Bollinger Bands narrow. In particular, ASEI traded between 64.5 and 66.2 during January, which is a very tight range indeed. Watch these...
READ MORE
MEMBERS ONLY
SPY Holds Pennant Breakout, But TLT Surges and XRT Lags
by Arthur Hill,
Chief Technical Strategist, TrendInvestorPro.com
After big moves on 31-Dec and 2-Jan, stocks edged higher the last seven trading days. The S&P 500 ETF (SPY) closed at 146.06 on Wednesday (2-Jan) and at 147.07 on Friday (11-Jan). Even though the ability to hold the initial gains and edge higher is positive,...
READ MORE