MEMBERS ONLY
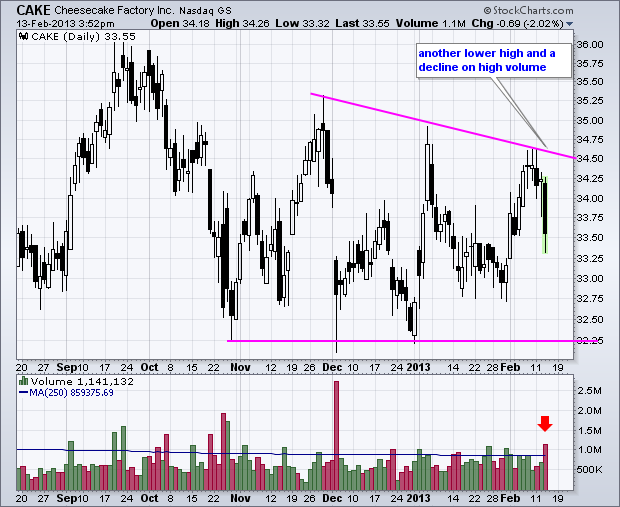
Cheesecake Factory Forms Lower High on Big Volume
by Arthur Hill,
Chief Technical Strategist, TrendInvestorPro.com
Even though exchange volume remains relatively light, Cheesecake Factory (CAKE) is trading above average volume and falling sharply. Notice that CAKE formed a lower high in early February and the next support zone resides in the 32.25-32.5 area.
Click this image for a live chart....
READ MORE
MEMBERS ONLY
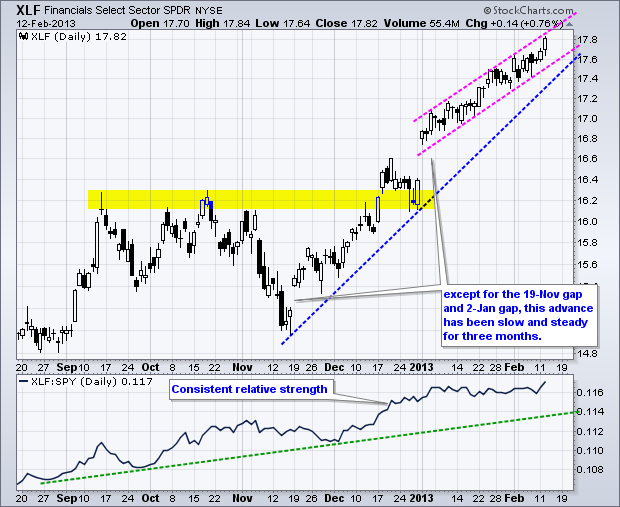
XLF Grinds to Another New High - TLT Forms Triangle
by Arthur Hill,
Chief Technical Strategist, TrendInvestorPro.com
Stocks were mixed again on Tuesday. The Nasdaq 100 ETF (QQQ) edged lower because Apple was weak, but the S&P 500 ETF (SPY) edged higher because financials were strong. Volume was below average again, but I would not read too much into this because we seem to be...
READ MORE
MEMBERS ONLY
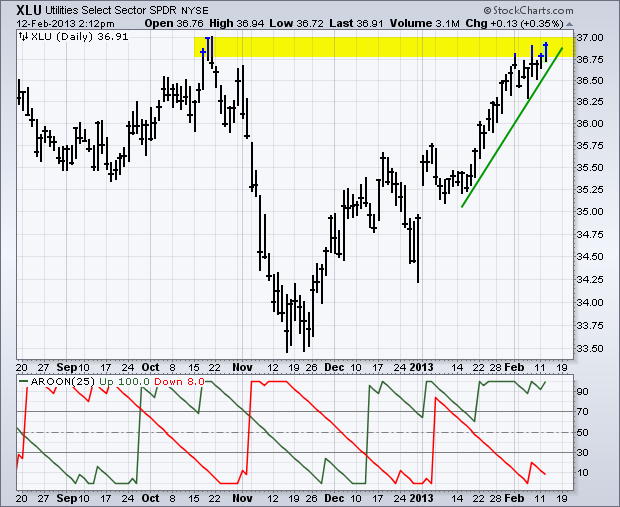
Utilities SPDR Quietly Challenges October High
by Arthur Hill,
Chief Technical Strategist, TrendInvestorPro.com
The Utilities SPDR (XLU) bottomed along with the broader market in mid November and advanced the last three months, but the advance has lagged in more ways than one. XLU is up less than SPY and SPY is already above its October high. Nevertheless, XLU is in a clear uptrend...
READ MORE
MEMBERS ONLY
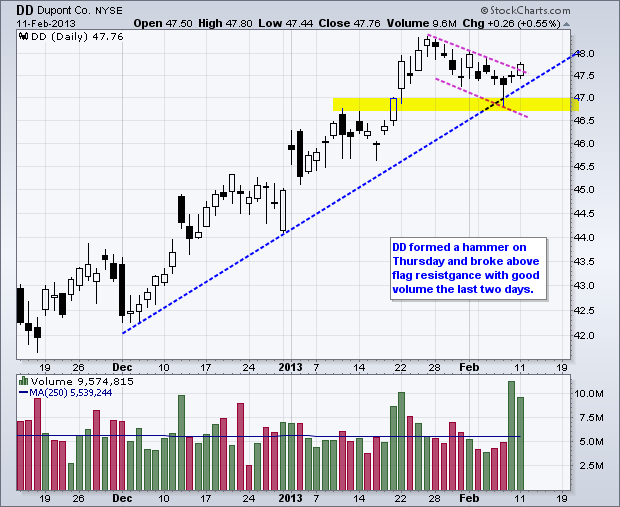
Charts of Interest: DD, FB, GT, ILMN, INTC, PCS, SCTY, SSYS
by Arthur Hill,
Chief Technical Strategist, TrendInvestorPro.com
DD Breaks Wedge Resistance with Good Volume.
SCTY Surges above Triangle Trend Line.
Plus FB, GT, ILMN, INTC, PCS, SSYS
This commentary and charts-of-interest are designed to stimulate thinking. This analysis is
not a recommendation to buy, sell, hold or sell short any security (stock ETF or otherwise)...
READ MORE
MEMBERS ONLY
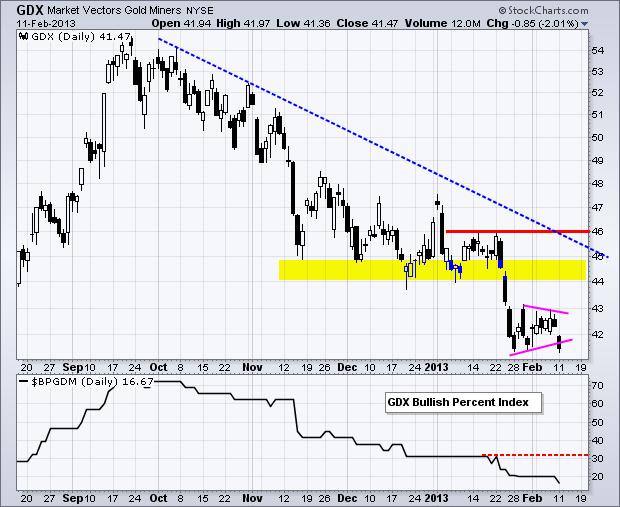
Gold and GDX Break Down - USO Breaks Flag Resistance
by Arthur Hill,
Chief Technical Strategist, TrendInvestorPro.com
Stocks were mixed on Monday with the S&P 500 ETF (SPY) edging lower (.02%) and the S&P 500 Equal-Weight ETF (RSP) edging higher (.03%). Yes, it was a mixed, and dull, day. The sector SPDRs were also mixed and the moves were small. The Gold...
READ MORE
MEMBERS ONLY
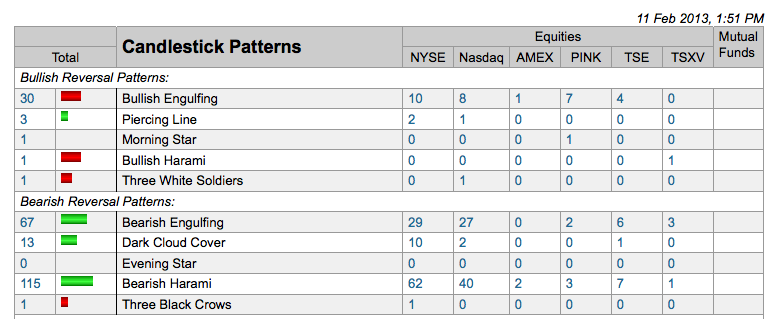
Bearish Candlestick Reversal Patterns Increase on Predefined Scans Page
by Arthur Hill,
Chief Technical Strategist, TrendInvestorPro.com
There was an uptick in the number of bearish candlestick reversals on Monday afternoon. As the screen shot below shows, there were 67 bearish engulfing patterns as of 1:51PM ET. There were also 13 dark cloud patterns and over 100 harami, which are like inside days. Chartists can click...
READ MORE
MEMBERS ONLY
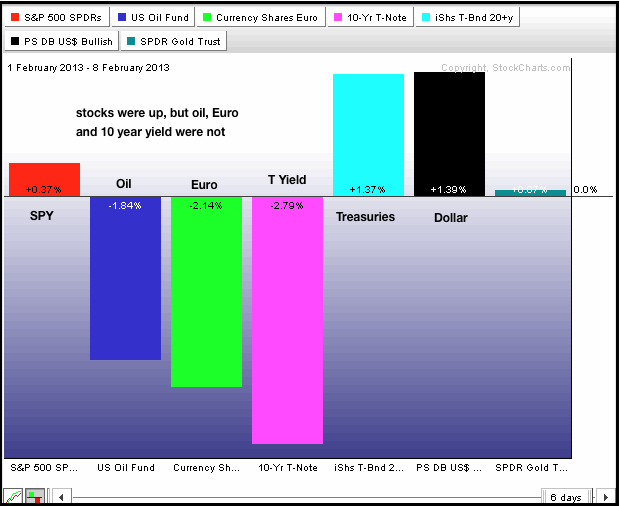
Treasuries Rise and Euro Falls, But Stocks Remain Strong
by Arthur Hill,
Chief Technical Strategist, TrendInvestorPro.com
Stocks bucked the intermarket headwinds and mixed economic data to finish positive again last week. The S&P 500 ETF (SPY) and the Russell 2000 ETF (IWM) are now up six consecutive weeks. The Nasdaq 100 ETF (QQQ) also got into the bull mood with a close above its...
READ MORE
MEMBERS ONLY
Watch the Rising Trend Line on the NYSE McClellan Summation Index
by Arthur Hill,
Chief Technical Strategist, TrendInvestorPro.com
The NYSE Summation Index ($NYSI) has been rising since the latter part of November and recently exceeded its September high. The trend here is clearly up with the November trend line marking first support. Even though the summation index flattened over the past week, it has yet to break this...
READ MORE
MEMBERS ONLY
Indicator Summary Shows No Weakness, But Stocks are Overbought
by Arthur Hill,
Chief Technical Strategist, TrendInvestorPro.com
There is no change in the indicator summary because the market did not move much this week. Stocks have been in a stalling pattern the last two weeks. The medium-term and long-term trends are clearly up, but this stall could signal the start of a corrective period that...
READ MORE
MEMBERS ONLY
IWM Holds Channel as QQQ Bounces off Support
by Arthur Hill,
Chief Technical Strategist, TrendInvestorPro.com
The stock market is holding up, but some external indicators are not. First, the US Dollar Fund (UUP) surged over the last few days and broke short-term resistance. Also note that bear trap from last Friday-Monday. Second, the Euro is falling has tensions heat up in Italy and...
READ MORE
MEMBERS ONLY
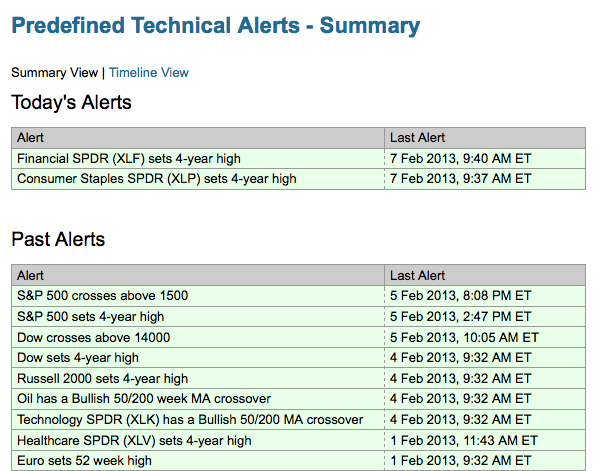
Technical Alerts from StockCharts Remain Positive in February
by Arthur Hill,
Chief Technical Strategist, TrendInvestorPro.com
The predefined technical alerts at StockCharts.com have been decidedly positive since January 2nd. You can view the history on the summary page. February continues to be a good month with eleven positive alerts and zero negative alerts. These realtime alerts are color coded for an easy assessment. You can...
READ MORE
MEMBERS ONLY
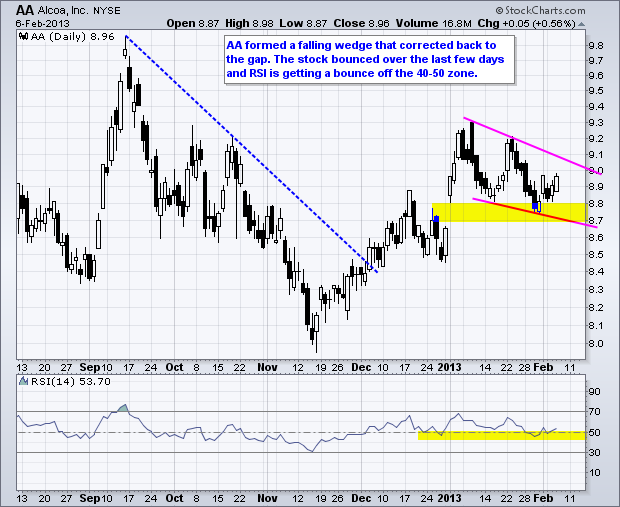
Charts of Interest: AA, AEO, INTC, TEVA, USB
by Arthur Hill,
Chief Technical Strategist, TrendInvestorPro.com
AA Bounces off Gap Zone.
AEO Breaks Wedge Resistance.
Plus INTC, TEVA, USB
This commentary and charts-of-interest are designed to stimulate thinking. This analysis is
not a recommendation to buy, sell, hold or sell short any security (stock ETF or otherwise).
We all need to think for ourselves...
READ MORE
MEMBERS ONLY
Intermarket Picture Picking up - TLT Bases as UUP Breaks Resistance
by Arthur Hill,
Chief Technical Strategist, TrendInvestorPro.com
Stocks were mixed on Wednesday as the Nasdaq 100 ETF (QQQ) edged lower and the S&P 500 ETF (SPY) edged higher. Trading was seriously subdued in the sector SPDRs. Utilities SPDR (XLU) provided the biggest advance (.30%), while the Technology SPDR (XLK) provided the biggest loss (.03%). These...
READ MORE
MEMBERS ONLY
Intel Traces out Bear Flag after Gap
by Arthur Hill,
Chief Technical Strategist, TrendInvestorPro.com
Intel (INTC) recorded a 52-week low in mid November and bounced with the rest of the market over the next two months. This bounce abruptly ended with a gap down to the mid November trend line. With a feeble rise the last few weeks, Intel formed a bear flag...
READ MORE
MEMBERS ONLY
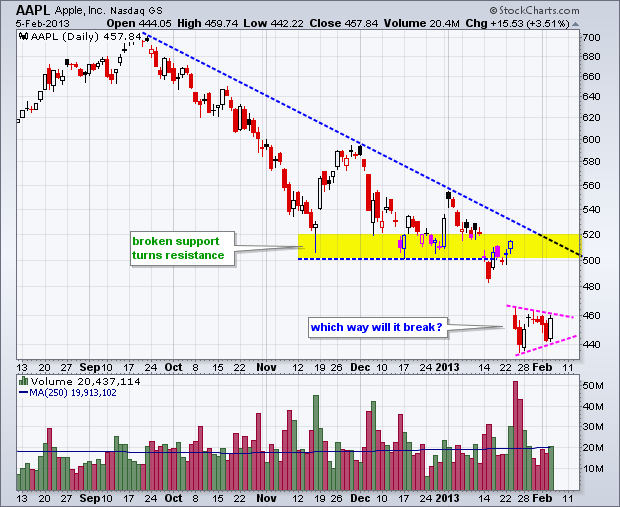
Apple Bounces within Pennant Pattern - QQQ Challenges Resistance
by Arthur Hill,
Chief Technical Strategist, TrendInvestorPro.com
Stocks rebounded with a big bang as the Nasdaq 100 ETF (QQQ) led the market higher. Yes, you read right. Microsoft, Intel, Cisco, and Dell all gained on the day and were on the most active list. Could the Dell LBO revive the old Winteldell machine? We shall see. Gains...
READ MORE
MEMBERS ONLY
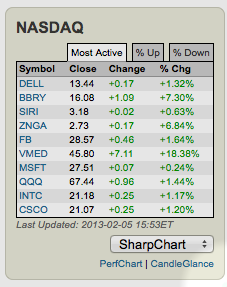
Nasdaq Parties Like its 1999 - MSFT, DELL, INTC and CSCO Lead
by Arthur Hill,
Chief Technical Strategist, TrendInvestorPro.com
A look at the ten most active stocks shows four old school tech stocks leading the charge. Microsoft, Dell, Intel and Cisco are all up and active. This table comes from the FreeCharts page. Chartists can see small candlestick charts for all ten by clicking the CandleGlance link or a...
READ MORE
MEMBERS ONLY
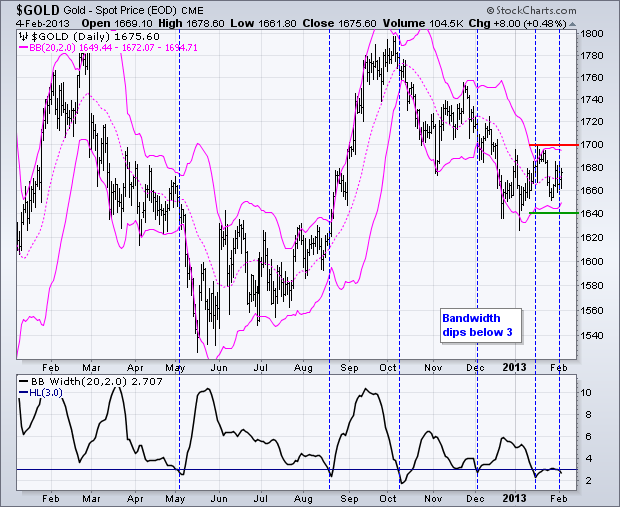
Bollinger Bands Narrow for Gold - QQQ Breaks Channel
by Arthur Hill,
Chief Technical Strategist, TrendInvestorPro.com
Although European issues got the blame for Monday's stock market decline, weakness should not come as a surprise because stocks were quite overbought and ripe for a corrective period. In addition to overbought conditions, two historical tendencies came into play on the second trading day of the month....
READ MORE
MEMBERS ONLY
Charts of Interest: ADBE, APOL, CCL, GES, ILMN, JCOM, NVDA
by Arthur Hill,
Chief Technical Strategist, TrendInvestorPro.com
ADBE Stalls and Underperforms in January.
APOL Forms a Bear Flag.
Plus CCL, GES, ILMN, JCOM, NVDA
This commentary and charts-of-interest are designed to stimulate thinking. This analysis is
not a recommendation to buy, sell, hold or sell short any security (stock ETF or otherwise).
We all need...
READ MORE
MEMBERS ONLY
Dollar and Gold Surge along with Treasuries
by Arthur Hill,
Chief Technical Strategist, TrendInvestorPro.com
Some fears in Spain and Italy triggered a move away from risk as the US Dollar Fund (UUP) and the 20+ Year T-Bond ETF (TLT) surged on Monday. Even though the Dollar is up sharply, also note that the Gold SPDR (GLD) is up and gold is attracting money....
READ MORE
MEMBERS ONLY
IWM Nears Channel Resistance - UUP Sets Possible Bear Trap
by Arthur Hill,
Chief Technical Strategist, TrendInvestorPro.com
Stocks finished the week on a high note with the Dow Industrials closing above 14000 for the first time since 2007. The trend since mid November is pretty much straight up with the major index ETFs up double digits since these lows. The S&P 500 is up around...
READ MORE
MEMBERS ONLY
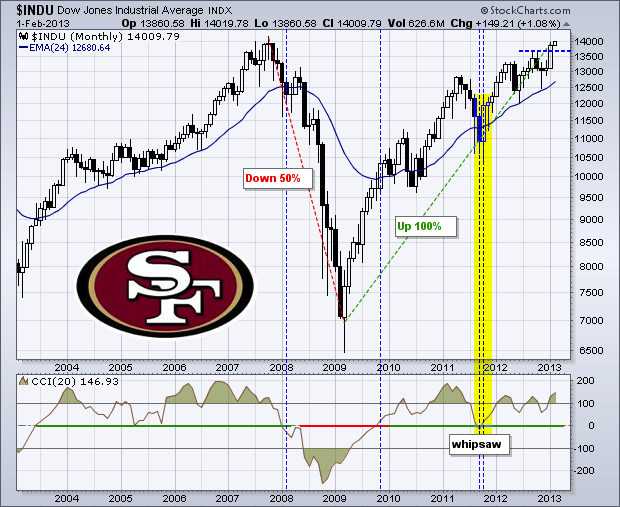
DOW MAKES A ROUND TRIP WITH 100% GAIN
by Arthur Hill,
Chief Technical Strategist, TrendInvestorPro.com
With a 150-point gain to end the week, the Dow Industrials closed above the next big number (14000) and hit a significant milestone. There is usually nothing special about round numbers, such as 14000, but this number is special because the Dow failed at 14000 in 2007. The financial...
READ MORE
MEMBERS ONLY
This is What Risk-On Looks Like
by Arthur Hill,
Chief Technical Strategist, TrendInvestorPro.com
The markets are clearly in the mood to embrace risk. The S&P 500 and Spot Light Crude ($WTIC) are up over 10% since mid November, and the Euro Index ($XEU) is up over 6%. In contrast, the 30-Year US Treasury ($USB) and the US Dollar Index ($USD)...
READ MORE
MEMBERS ONLY
Indicators Remain Strong, but Stocks are Overbought
by Arthur Hill,
Chief Technical Strategist, TrendInvestorPro.com
Stocks stalled the last four days, but this is not enough to affect the indicators, nine of which remain in bull mode. The major index ETFs are clearly overbought and the world is calling for a pullback, but we have yet to see it. I suspect we will get one...
READ MORE
MEMBERS ONLY
DBC Breaks Resistance - QQQ Tests Channel Support
by Arthur Hill,
Chief Technical Strategist, TrendInvestorPro.com
Stocks finished the day mixed as the market awaits the employment report. The Dow Industrials SPDR (DIA) edged lower, but the S&P MidCap 400 SPDR (MDY) edged higher. The sectors were mostly lower with the Basic Materials SPDR (XLB) falling around 1%. Declines in the Gold Miners ETF...
READ MORE
MEMBERS ONLY
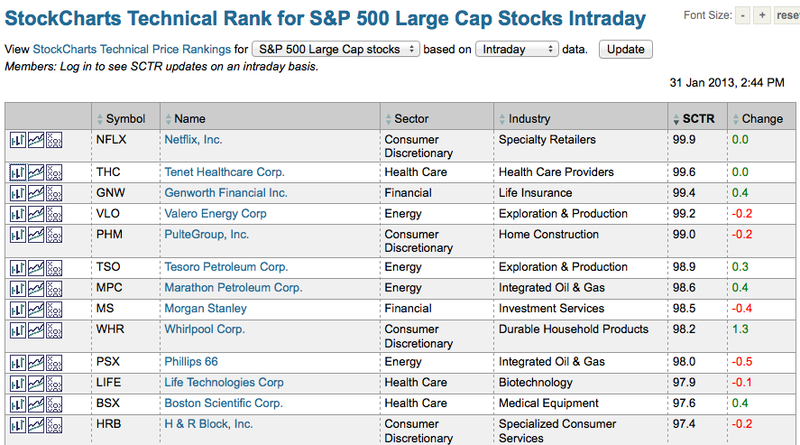
Tenet Healthcare and Boston Scientific Lead SCTR Table
by Arthur Hill,
Chief Technical Strategist, TrendInvestorPro.com
Want to find the leaders in the S&P 500? The StockCharts Technical Rank (SCTR) ranks the 500 S&P stocks from 0 to 100. The top 50 stocks in the index have scores from 90 to 100. These are deemed the stocks with the strongest technicals and...
READ MORE
MEMBERS ONLY
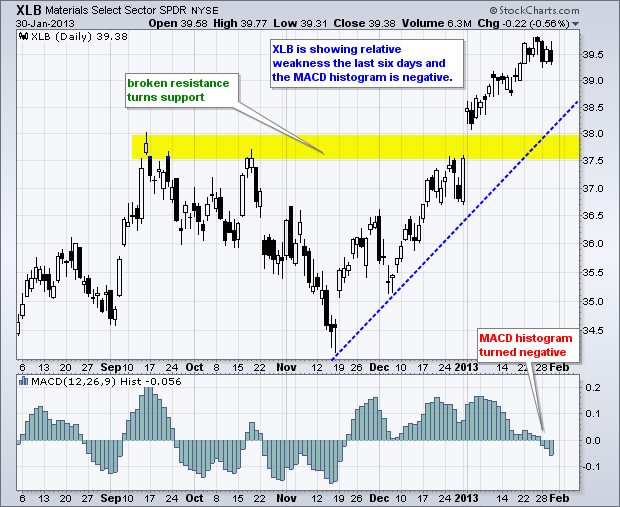
XLB Underperforms - SPY Hugs Channel Trend Line
by Arthur Hill,
Chief Technical Strategist, TrendInvestorPro.com
The bulls finally took a breather as stocks succumbed to some selling pressure on Wednesday. Small-caps led the way lower as the Russell 2000 ETF (IWM) fell over 1%. All sectors were down with the Industrials SPDR (XLI) falling .91% on the day. Given the run ups over the...
READ MORE
MEMBERS ONLY
Charts of Interest: CIEN, KO, MBI, S, USB, WSM
by Arthur Hill,
Chief Technical Strategist, TrendInvestorPro.com
Careful out there.
It is earnings season, the employment report is Friday and the new month starts.
CIEN Breaks Down and Underperforms.
MBI Forms Triangle and Bounces on Good Volume.
Plus KO, S, USB, WSM
This commentary and charts-of-interest are designed to stimulate thinking. This analysis is
not...
READ MORE
MEMBERS ONLY
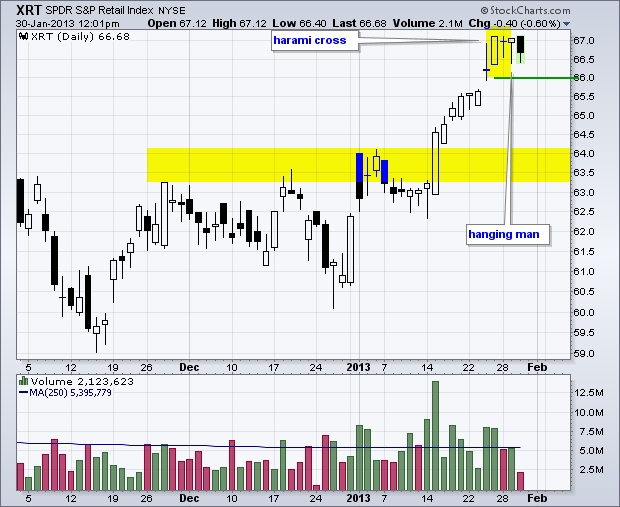
Bearish Candlesticks Take Shape for the Retail SPDR
by Arthur Hill,
Chief Technical Strategist, TrendInvestorPro.com
The bigger trends are clearly up for the Retail SPDR (XRT) as the ETF broke resistance with a big surge in January. However, XRT is short-term overbought after a big move and bearish candlesticks are taking shape. A harami-cross formed on Friday-Monday and a hanging man formed...
READ MORE
MEMBERS ONLY
SPY Extends Gains - USO Breaks Pennant Resistance
by Arthur Hill,
Chief Technical Strategist, TrendInvestorPro.com
Stocks started the day weak, but then caught a bid and the broad market indices moved higher the rest of the day. The final gains were not that big with the S&P 500 ETF (SPY) advancing .39% and the Dow Industrials SPDR (DIA) closing .42% higher. The sectors...
READ MORE
MEMBERS ONLY
RIMM Gap Turns into Exhaustion Gap with Fill
by Arthur Hill,
Chief Technical Strategist, TrendInvestorPro.com
Research in Motion (RIMM) has been one of the best performing stocks since late September. There is, however, evidence that the advance has exhausted itself as RIMM filled last week's gap above 16. This fill makes it an exhaustion gap that could give way to a retracement of...
READ MORE
MEMBERS ONLY
QQQ Bounces off Channel Line - UUP Forms Falling Flag
by Arthur Hill,
Chief Technical Strategist, TrendInvestorPro.com
Stocks started the week mixed with the Russell 2000 ETF (IWM) edging higher and the S&P 500 ETF (SPY) edging lower. And I do mean "edging" because the moves were fractional. The sectors were also mixed with the Basic Materials SPDR (XLB) falling around 1% and...
READ MORE
MEMBERS ONLY
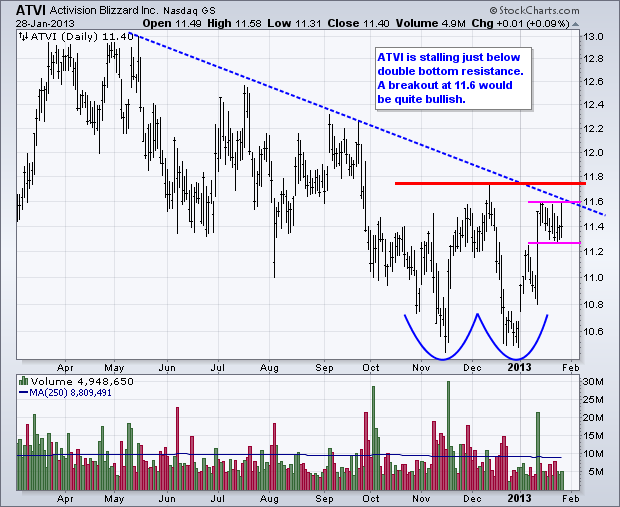
Charts of Interest: ATVI, BIDU, CHS, CVG, EA, GME
by Arthur Hill,
Chief Technical Strategist, TrendInvestorPro.com
Careful out there. Earnings seaon is in full swing.
ATVI Forms Flag Just Below Resistance.
BIDU Breaks Flag Resistance with Volume.
Plus CHS, CVG, EA, GME
This commentary and charts-of-interest are designed to stimulate thinking. This analysis is
not a recommendation to buy, sell, hold or sell short...
READ MORE
MEMBERS ONLY
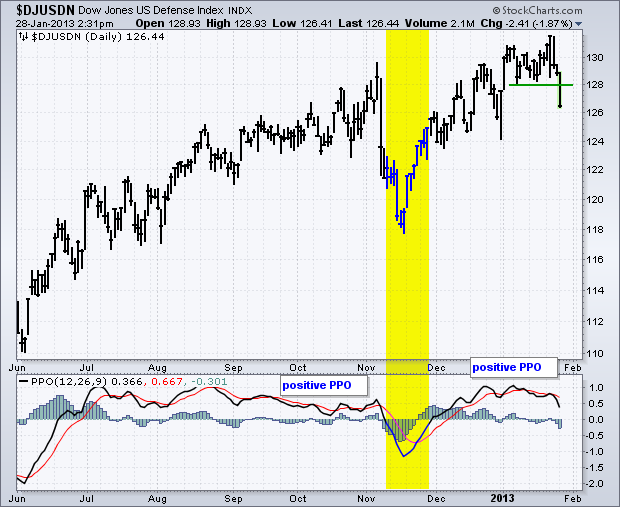
Defense Index Breaks Support on Sequestration Fears
by Arthur Hill,
Chief Technical Strategist, TrendInvestorPro.com
The DJ US Defense Index ($DJUSDN) was hit hard the last three days and broke below the January lows. This index is now down for the year, which means it is underperforming the broader market. The indicator window shows the Percent Price Oscillator (PPO) turning lower, but remaining in positive...
READ MORE
MEMBERS ONLY
Dow Surges to New High - TLT Breaks Down
by Arthur Hill,
Chief Technical Strategist, TrendInvestorPro.com
What more could a stock market want? The S&P 500 advanced the last eight days in a row and closed at a 52-week high. The Dow surged some 400 points in the last six days. Treasury bonds fell as market participants moved from safe-havens to riskier...
READ MORE
MEMBERS ONLY
Point & Figure Triple Top Breakouts Outpace Triple Bottom Breakdowns
by Arthur Hill,
Chief Technical Strategist, TrendInvestorPro.com
The P&F pattern table on the predefined scans page is a good place to gauge the long-term trend for the stock market. As with a Bullish Percent Index, chartists simply need to pick a pattern and then compare the number of stocks on bullish P&F...
READ MORE
MEMBERS ONLY
Majority of Indicators Remain in Bull Mode
by Arthur Hill,
Chief Technical Strategist, TrendInvestorPro.com
There are no changes in the indicator summary because stocks remained strong this week. QQQ and XLK were dragged down by Apple, but the Nasdaq 100 Equal-Weight ETF (QQEW) hit a new high, which means the average tech stock is doing just fine. The NYSE AD Line remains on...
READ MORE
MEMBERS ONLY
QQQ Falls to Channel Trend Line - FXE Forms Flat Flag
by Arthur Hill,
Chief Technical Strategist, TrendInvestorPro.com
The broad market indices edged higher on Thursday, but Apple dominated ETFs moved lower (QQQ and XLK). Note that the Nasdaq 100 Equal-Weight ETF (QQEW) advanced .43% and the FirstTrust Internet ETF (FDN) was up over 2%. The Basic Materials SPDR (XLB) was up on the day, but several...
READ MORE
MEMBERS ONLY
Adobe Leaves Apple in the Dust
by Arthur Hill,
Chief Technical Strategist, TrendInvestorPro.com
Apple may not support flash on its iPhone and iPad, but that does not seem to bother Adobe (ADBE) shareholders. Adobe lagged Apple throughout 2012, but may be having the last laugh as it starts to outperform. Apple is up less than 5% over the last 12 months, while Adobe...
READ MORE
MEMBERS ONLY
QQQ Fails to Hold Breakout as AAPL Breaks Support
by Arthur Hill,
Chief Technical Strategist, TrendInvestorPro.com
Apple whiffed and the stock is trading sharply lower after hours. This means the Nasdaq, QQQ and the Technology SPDR (XLK) will also be down in early trading on Thursday. It seems to be an Apple and big tech specific issue because the Dow futures are up slightly and the...
READ MORE
MEMBERS ONLY
Charts of Interest: AMKR, ESRX, JBL, ORLY, PNRA, YUM
by Arthur Hill,
Chief Technical Strategist, TrendInvestorPro.com
ESRX Underperforms and Tests Wedge Support.
ORLY Firms at Support with Good Volume.
Plus AMKR, JBL, PNRA, YUM
This commentary and charts-of-interest are designed to stimulate thinking. This analysis is
not a recommendation to buy, sell, hold or sell short any security (stock ETF or otherwise).
We all...
READ MORE