MEMBERS ONLY
Aussie Dollar Breaks Triangle Resistance
by Arthur Hill,
Chief Technical Strategist, TrendInvestorPro.com
The Australian Dollar Index ($XAD) broke above trend line resistance from a large triangle this week. Medium-term, the index is still trading in a range extending back to July 2012. A break above the July-September highs would argue for a challenge to the 2011 highs.
Click this image for a...
READ MORE
MEMBERS ONLY
NYSE AD Line and AD Volume Line Hit New Highs
by Arthur Hill,
Chief Technical Strategist, TrendInvestorPro.com
The vast majority of market indicators remain in bull mode. The Nasdaq AD Line broke above its
December high this week and the Nasdaq AD Volume Line broke above its September high. The Nasdaq
continues to lag the NY Composite, but tech stocks are starting to show a little life....
READ MORE
MEMBERS ONLY
SPY Breaks Pennant - GLD Forms Higher Low and Bounces
by Arthur Hill,
Chief Technical Strategist, TrendInvestorPro.com
Stocks moved higher on Thursday with the major index ETFs scoring modest gains, very modest gains.
The S&P 100 ETF (OEF) led the way with a whopping .80% advance. The Finance SPDR (XLF) led the
sectors with a 1.27% gain on renewed confidence in US banks. Semiconductors...
READ MORE
MEMBERS ONLY
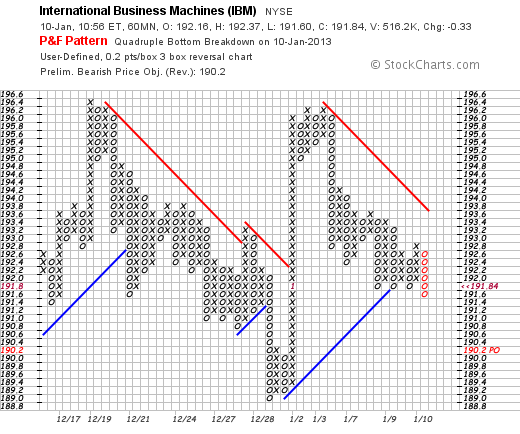
IBM Forges Quadruple Bottom Breakdown on P&F Chart
by Arthur Hill,
Chief Technical Strategist, TrendInvestorPro.com
IBM has been underperforming the broader market for several months and continued this trend with a break below support. On the P&F chart, notice how the stock formed three O-Columns with equal lows in January. The current O-Columnm which is red, broke below these lows to forge the...
READ MORE
MEMBERS ONLY
Charts of Interest: AAN, BMC, CVX, LH, VFC, VMW, XOM
by Arthur Hill,
Chief Technical Strategist, TrendInvestorPro.com
AAN Consolidates after Channel Break.
BMC Breaks Resistance and Shows Relative Strength in 2013.
Plus CVX, LH, VFC, VMW, XOM
This commentary and charts-of-interest are designed to stimulate thinking. This analysis is
not a recommendation to buy, sell, hold or sell short any security (stock ETF or otherwise).
We all...
READ MORE
MEMBERS ONLY
QQQ Edges Above Wedge Trend Line - TLT Hits Resistance
by Arthur Hill,
Chief Technical Strategist, TrendInvestorPro.com
Stocks firmed on Wednesday with the major index ETFs putting in small gains for the day. The Nasdaq 100 Equal-Weight ETF (QQEW) led the way with a .78% advance and a fresh 52-week high. This is a clear sign that the Nasdaq 100 as a whole is strong. The Nasdaq...
READ MORE
MEMBERS ONLY
DBC Commodity Index Fund Tests Triangle Support as RSI Range Narrows
by Arthur Hill,
Chief Technical Strategist, TrendInvestorPro.com
The Commodity Index Fund ($DBC) declined from mid September to early November and then formed a triangle consolidation. After a fall last week, the ETF is testing triangle support and a break below 27.3 would be bearish. Notice that RSI is also consolidating with support at 40 and resistance...
READ MORE
MEMBERS ONLY
QQQ Corrects with Falling Wedge - USO Breaks Flag Line
by Arthur Hill,
Chief Technical Strategist, TrendInvestorPro.com
Stocks extended their corrective period on Tuesday as the major index ETFs finished with small losses. Note that stocks surged on 31-Dec and 2-Jan as the major index ETFs forged big gaps. Stocks were overbought at this stage and have pretty much consolidated the last few days. The ability to...
READ MORE
MEMBERS ONLY
Yields May be Low, but the Curve Remains Steep
by Arthur Hill,
Chief Technical Strategist, TrendInvestorPro.com
The 10-year Treasury Yield ($TNX) surged over the last two weeks, but remains at relatively low levels historically. Also note that the yield curve is still quite steep with the 2-Year Treasury Yield ($UST2Y) hovering around .27% and the 10-year Treasury Yield near 1.88%. A steep yield curve is...
READ MORE
MEMBERS ONLY
Charts of Interest: AEO, CTXS, GES, UDR, T, VZ
by Arthur Hill,
Chief Technical Strategist, TrendInvestorPro.com
AEO Turns Sharply Lower.
CTXS Holds Gap and Challenges Resistance.
Plus GES, UDR, T, VZ
This commentary and charts-of-interest are designed to stimulate thinking. This analysis is
not a recommendation to buy, sell, hold or sell short any security (stock ETF or otherwise).
We all need to think for ourselves...
READ MORE
MEMBERS ONLY
SPY Forms Spinning Tops at Resistance
by Arthur Hill,
Chief Technical Strategist, TrendInvestorPro.com
Trading was rather quiet as the world returned to work on Monday. The S&P 500 ETF (SPY) formed its third spinning top candlestick in as many days. Spinning tops feature small bodies (open-close range) and relatively equal upper-lower shadows (high-low range). They indicate indecision that can sometimes foreshadow...
READ MORE
MEMBERS ONLY
Sector Summary Reveals Strength in Steel
by Arthur Hill,
Chief Technical Strategist, TrendInvestorPro.com
Chartists can find the leaders and the laqgards by sifting through the Sector Summary. This image shows the industry groups within the materials sector. Eight of the nine are down. The DJ US Steel Index ($DJUSST) is the lone gainer as it bucks the market. Chartists can click on the...
READ MORE
MEMBERS ONLY
QQQ Starts to Underperform Again - USO Forms Bull Flag
by Arthur Hill,
Chief Technical Strategist, TrendInvestorPro.com
Stocks took a big bite of risk to start the year. Last week's gains were split between years with the surge starting on December 31st and continuing on January 2nd. Stocks consolidated the last two days of the week and held on to their gains. The return to...
READ MORE
MEMBERS ONLY
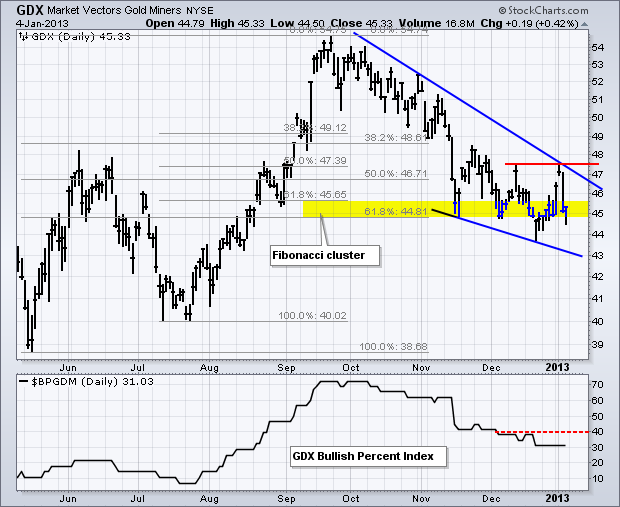
Gold Miners ETF Tests Support near Fibonacci Cluster
by Arthur Hill,
Chief Technical Strategist, TrendInvestorPro.com
It was a volatile week for gold and gold miners, but the Gold Miners ETF (GDX) remains at an interesting juncture that warrants attention. After surging above 47 to start the New Year, the Fed minutes on Wednesday put some doubts on the future of quantitative easing. Keep in mind...
READ MORE
MEMBERS ONLY
Microsoft Fails at Resistance as OBV Sinks
by Arthur Hill,
Chief Technical Strategist, TrendInvestorPro.com
Microsoft (MSFT) is having a tough year already as the stock failed to clear resistance and moved sharply lower the last two days. Resistance at 27.75 stems from broken support and the November-December highs. The indicator window shows OBV moving steadily lower, which indicates continued selling pressure.
Click this...
READ MORE
MEMBERS ONLY
Indicator Summary Remains Bullish with Three Upgrades
by Arthur Hill,
Chief Technical Strategist, TrendInvestorPro.com
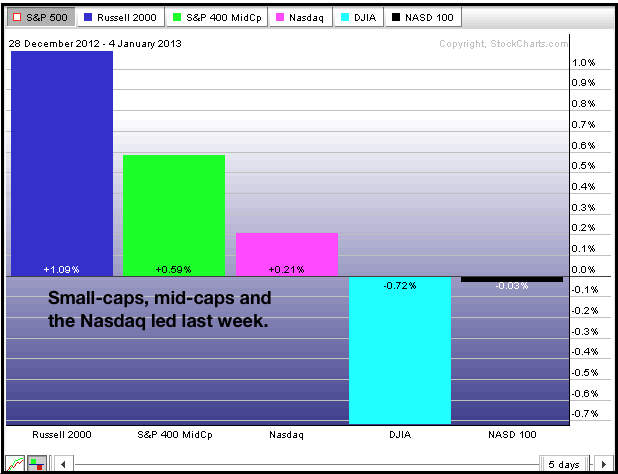
Strength over the past week triggered three upgrades for the indicator summary. The Nasdaq AD Line turned bullish with a break above its December high. The $VIX and $VXN plunged towards support to turn bullish. Fresh 52-week highs in the S&P MidCap 400 SPDR (MDY) and Russell 2000...
READ MORE
MEMBERS ONLY
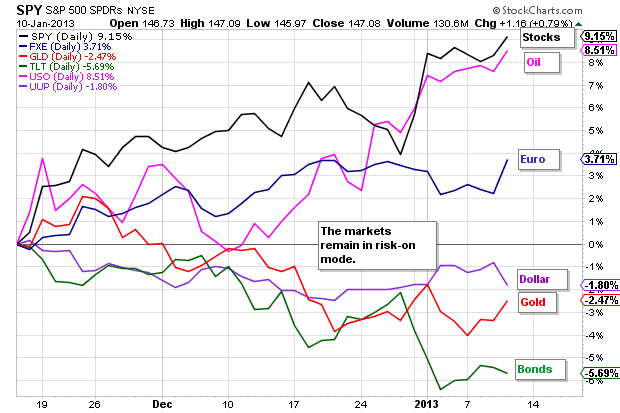
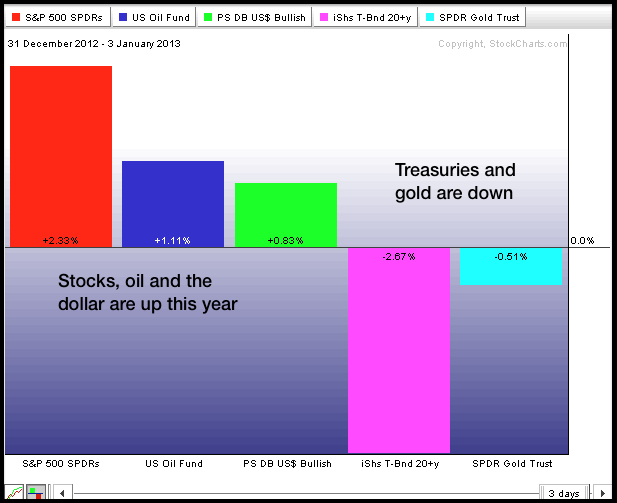
TLT and GLD Plunge on Fed Minutes - UUP Breaks Out
by Arthur Hill,
Chief Technical Strategist, TrendInvestorPro.com
The Fed minutes threw the intermarket arena a curve ball on Thursday. Basically, the Fed admitted that the affects of quantitative easing were diminishing over time and it was running out of bullets. This news sent Treasuries sharply lower, the Dollar sharply higher and gold sharply lower. Stocks and oil...
READ MORE
MEMBERS ONLY
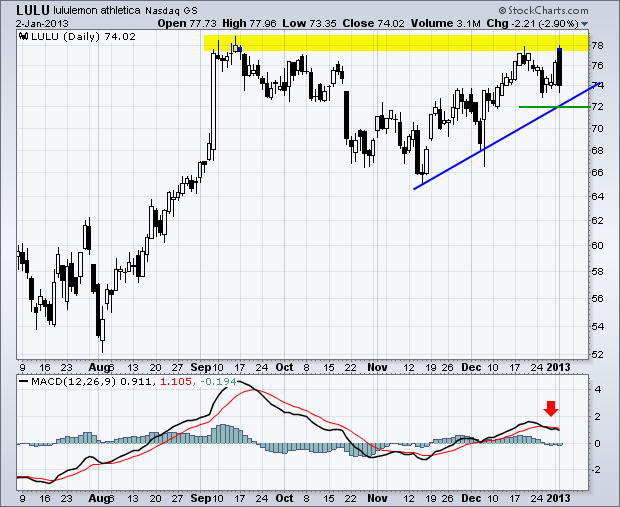
Lululemon Forms Bearish Engulfing at Resistance
by Arthur Hill,
Chief Technical Strategist, TrendInvestorPro.com
Not all stocks participated in Wednesday's big advance. Lululemon (LULU) started strong,
but quickly succumbed to selling pressure and closed sharply lower. With a strong open
and weak close, a bearish engulfing pattern formed at resistance. Also notice that MACD
moved below its signal line last week.
Click...
READ MORE
MEMBERS ONLY
Charts of Interest: AMKR, BOOM, BSX, IPI, NBR
by Arthur Hill,
Chief Technical Strategist, TrendInvestorPro.com
BOOM Breaks Consolidation Resistance with Good Volume.
BSX Forms Inverse HS Pattern.
Plus AMKR, IPI, NBR
This commentary and charts-of-interest are designed to stimulate thinking. This analysis is
not a recommendation to buy, sell, hold or sell short any security (stock ETF or otherwise).
We all need to think for...
READ MORE
MEMBERS ONLY
XLK and XLY Lead Higher - UUP and GLD Challenge Resistance
by Arthur Hill,
Chief Technical Strategist, TrendInvestorPro.com
Stocks followed through on the New Year's Eve reversals with gaps and strong gains to start the year. The Russell 2000 ETF (IWM) and Nasdaq 100 ETF (QQQ) surged over 5% the last two days. IWM and the S&P MidCap 400 SPDR (MDY) recorded 52-week highs...
READ MORE
MEMBERS ONLY
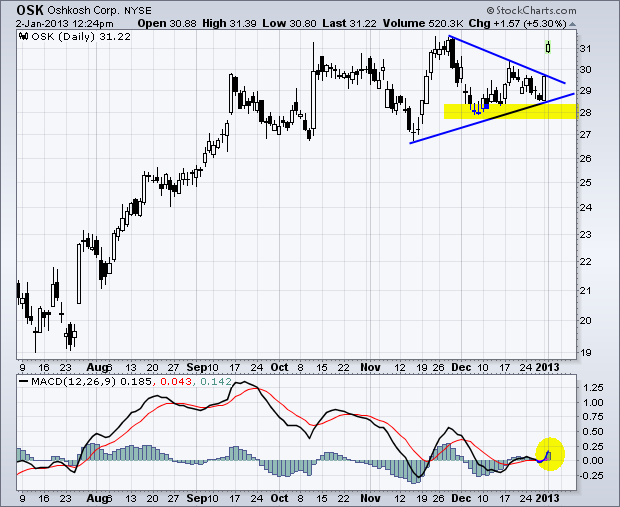
Oshkosh Breaks Triangle Trend Line with Big Gap
by Arthur Hill,
Chief Technical Strategist, TrendInvestorPro.com
Lots of stocks are coming across the gap up scan today (297 at last count). The chart below shows one list member, Oshkosh, gapping up and breaking above its mid December high. This move reinforces support in the 28 area. Also notice that MACD moved above its signal line over...
READ MORE
MEMBERS ONLY
DIA Forms Bullish Engulfing, But Exchange Volume is Light
by Arthur Hill,
Chief Technical Strategist, TrendInvestorPro.com
The markets got a taste for risk as the Senate debated the fiscal cliff on Friday. A bill did indeed pass by a wide margin and the House subsequently passed the bill as well. The bill does provide some relief from the fiscal slope, but does little to fix the...
READ MORE
MEMBERS ONLY
Top 5 Technical Developments for 2012 - Number 1 - 20+ Year T-Bond ETF (TLT) Ignores the Fed
by Arthur Hill,
Chief Technical Strategist, TrendInvestorPro.com
The Fed announced another round of quantitative easing on September 13th and Treasuries have yet to cooperate with this maneuver. Instead of a specific program, the Fed announced an open-ended quantitative easing program that would begin in January 2013. QE is supposed to be bearish for treasuries because the Fed...
READ MORE
MEMBERS ONLY
Top 5 Technical Developments for 2012 - Number 2 - Technology SPDR (XLK) Fails at Broken Support
by Arthur Hill,
Chief Technical Strategist, TrendInvestorPro.com
The Technology SPDR (XLK) led the market in the first half of the year, but lagged the market in the second half and underperformed the S&P 500. The technology sector accounts for over 19% of the S&P 500 ETF (SPY) and is by far the biggest...
READ MORE
MEMBERS ONLY
Top 5 Technical Developments for 2012 - Number 3 - US Dollar Index ($USD) Forms Large Head-and-Shoulders Reversal
by Arthur Hill,
Chief Technical Strategist, TrendInvestorPro.com
The US Dollar Index ($USD) was all over the place in 2012, but ended the year slightly lower than where it started. The index started the year around 80, surged to 84 and closed at 79.62 on Friday. From February to December, a large head-and-shoulders reversal formed with a...
READ MORE
MEMBERS ONLY
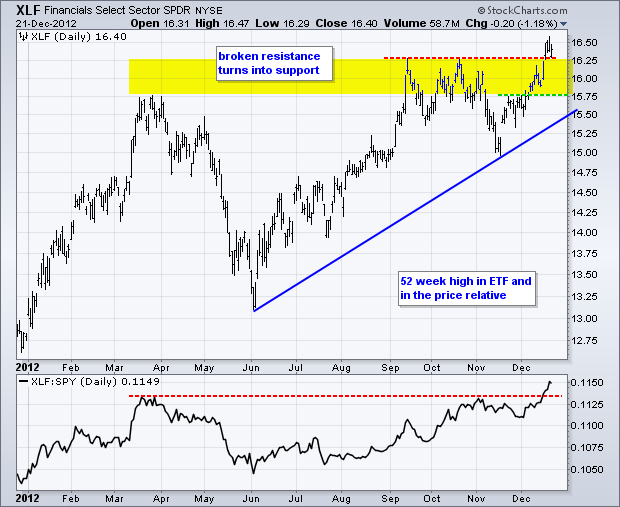
Top 5 Technical Developments for 2012 - Number 4 - Finance SPDR (XLF) Starts Strong and Finishes Strong
by Arthur Hill,
Chief Technical Strategist, TrendInvestorPro.com
Big banks came to life in 2012 as the Finance SPDR (XLF) started the year strong and ended strong. XLK opened 2012 just above 13 and is likely to finish near a 52-week high. The ETF scored a 52-week high with the move above 16.5 in mid January and...
READ MORE
MEMBERS ONLY
Top 5 Technical Developments for 2012 - Number 5 - Nikkei Hits 52-week High as Yen Reverses 5 Year Uptrend
by Arthur Hill,
Chief Technical Strategist, TrendInvestorPro.com
The Nikkei 225 ($NIKK) came to life over the last two months and surged above its March high with a massive surge. Notice that the index held above its 2009 lows and also broke channel resistance in the process. This move opens the door to the next resistance zone in...
READ MORE
MEMBERS ONLY
Indicator Summary Favors the Bulls, but the VXN Trends Higher
by Arthur Hill,
Chief Technical Strategist, TrendInvestorPro.com
The bulk of the evidence remains bullish, but I am concerned that the major index ETFs may be forming lower highs. With the decline over the last six days, SPY and DIA peaked below their September highs and lower highs could be forming. Relative weakness in the Nasdaq is also...
READ MORE
MEMBERS ONLY
IWM Forms Falling Flag as TLT Hits Broken Support
by Arthur Hill,
Chief Technical Strategist, TrendInvestorPro.com
Ladies and gentlemen, the fiscal cliff is a farce built up by the media and the politicians. It is not a cliff, but rather a slope that can be remedied in January, February or even March. Of course, the longer the slope extends, the worse for the economy and the...
READ MORE
MEMBERS ONLY
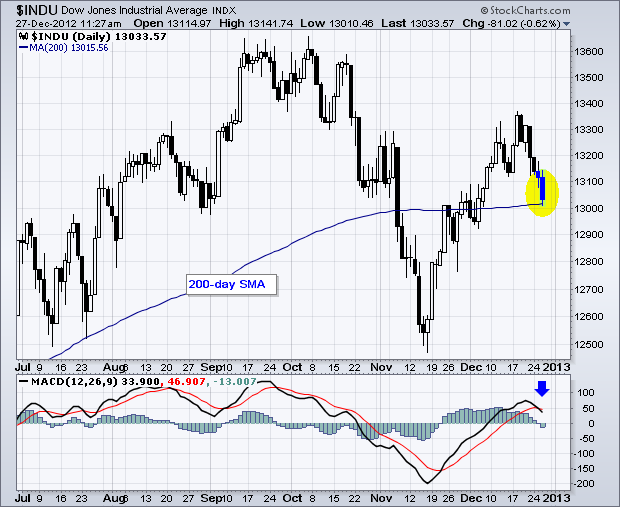
Dow Tests Key Moving Average as MACD Rolls Over
by Arthur Hill,
Chief Technical Strategist, TrendInvestorPro.com
The Dow has fallen over 300 points in the last six trading days and is now testing the 200-day moving average. The senior Average broke above this key average in early December and needs to hold the breakout. A break back below 13000 would be quite negative. MACD is already...
READ MORE
MEMBERS ONLY
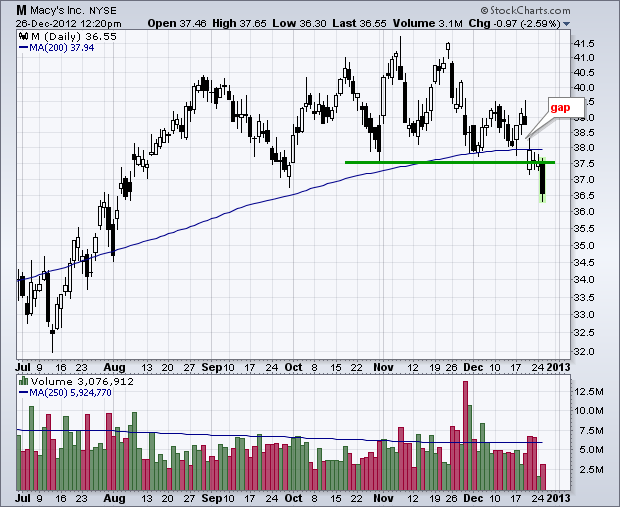
Macy's Breaks 200-day Moving Average
by Arthur Hill,
Chief Technical Strategist, TrendInvestorPro.com
Macy's (M) is having a rough season as the stock broke the 200-day moving average and support at 37.50 the last few days. Also notice that stock gapped down four days ago and fell on high volume just before Christmas. This gap zone becomes the first resistance...
READ MORE
MEMBERS ONLY
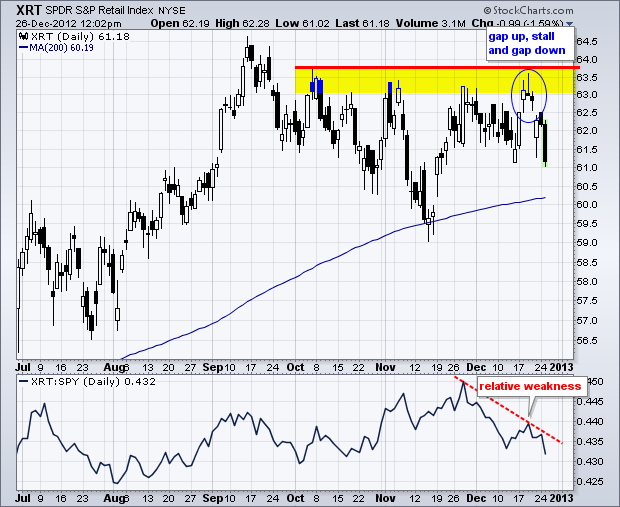
Retail SPDR Leads Lower after Island Reversal
by Arthur Hill,
Chief Technical Strategist, TrendInvestorPro.com
The Retail SPDR (XRT) reversed near resistance with a gap up, stall and gap down. This sequence is also known as an island reversal. In addition to the reversal at resistance, notice that XRT shows relative weakness as the price relative moved below its mid December low.
Click this image...
READ MORE
MEMBERS ONLY
SPY and QQQ Hold Uptrends as TLT Gets Oversold Bounce
by Arthur Hill,
Chief Technical Strategist, TrendInvestorPro.com
Programming note: I will be taking off December 27th and 31st. Art's charts and the Market Message will be updated on Wednesday and Friday this week, and Wednesday (Jan-2) next week. Happy Holidays!
Stocks edged lower on Christmas Eve with relatively mild selling pressure during a shortened session....
READ MORE
MEMBERS ONLY
Finance Sector Leads and Regional Banks Come to Life
by Arthur Hill,
Chief Technical Strategist, TrendInvestorPro.com
2012 is ending with a bang for banking stocks as sentiment towards this sector improved significantly in December. Perhaps the big banks are looking forward to open-ended quantitative easing in 2013. The chart below shows the Finance SPDR (XLF) breaking above its autumn highs to record a 52-week high. In...
READ MORE
MEMBERS ONLY
Red Engulfs the Market Carpet, but Nike Bucks the Selling
by Arthur Hill,
Chief Technical Strategist, TrendInvestorPro.com
The Sector Market Carpet is full of red today as selling pressure hit an overbought stock market. All sectors are down, but there are a few isolated green boxes. Nike (NKE) is the top performer with a 4.8% surge. Red Hat (RHT) is up within the technology sector and...
READ MORE
MEMBERS ONLY
NYSE AD Line and AD Volume Line Hit New Highs
by Arthur Hill,
Chief Technical Strategist, TrendInvestorPro.com
Things were looking up until the fiscal cliff hit a roadblock. Stock futures are pointing to a sharply lower open and it could be a bumpy ride until yearend. The indicator summary remains bullish overall with new highs in the NYSE AD Line and AD Volume Line leading the charge....
READ MORE
MEMBERS ONLY
SPY to Test Short-Term Support after Fiscal Cliff Deal Sours
by Arthur Hill,
Chief Technical Strategist, TrendInvestorPro.com
Programming note: I will be taking off December 24, 27 and 31. Art's charts and the Market Message will be updated on Wednesday and Friday next week. Merry Christmas and Happy Holidays! Forget about the fiscal cliff and markets for a while and take time for things that...
READ MORE
MEMBERS ONLY
EA Breaks Support with Three Black Crows Pattern
by Arthur Hill,
Chief Technical Strategist, TrendInvestorPro.com
Electronic Arts (EA) came under strong selling pressure the last three days with consecutive long black candlesticks. As this chart now stands (11:48 ET), a bearish three black crows pattern is taking shape. The stock is short-term oversold already, but the trend line and support break are medium-term bearish....
READ MORE
MEMBERS ONLY
Charts of Interest: AAP, AZO, BCR, CB, HAS, LUB, ROL, XOM
by Arthur Hill,
Chief Technical Strategist, TrendInvestorPro.com
AAP Consolidates after Gap Down.
HAS Falls Five Straight Days.
Plus AZO, BCR, CB, LUB, ROL, XOM
This commentary and charts-of-interest are designed to stimulate thinking. This analysis is not a recommendation to buy, sell, hold or sell short any security (stock ETF or otherwise). We all need to think...
READ MORE
MEMBERS ONLY
Stocks Stall as Treasuries Get Oversold Bounce
by Arthur Hill,
Chief Technical Strategist, TrendInvestorPro.com
Stocks edged lower during the day and then took a hit in the final hour. The S&P 500 ETF (SPY) fell .74% and the Nasdaq 100 ETF (QQQ) declined .43% on the day. The losses were modest and the market was ripe for some profit taking. Keep in...
READ MORE