MEMBERS ONLY
TLT and UUP Bounce off Support Levels
by Arthur Hill,
Chief Technical Strategist, TrendInvestorPro.com
Stocks edged lower on Tuesday as the major index ETFs worked off short-term overbought conditions. Eight of the nine sectors were lower with the Finance SPDR (XLF) and Energy SPDR (XLE) leading the decline. Both lost around .90% on the day. The Utilities SPDR (XLU) bucked selling pressure with a...
READ MORE
MEMBERS ONLY
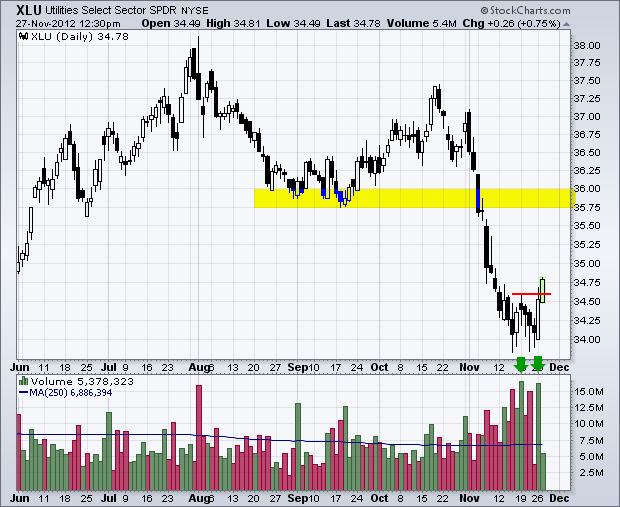
Utilities SPDR Gets Oversold Bounce
by Arthur Hill,
Chief Technical Strategist, TrendInvestorPro.com
After a sharp decline the first half of November, the Utilities SPDR (XLU) firmed for two weeks and then surged above its first resistance level. Notice that upside volume also surged twice in the last six days. Broken support turns next resistance in the 35.75-36 area.
Click this image...
READ MORE
MEMBERS ONLY
Charts: ATVI, AKAM, ARUN, CHS, GOOG, KSS, MMM
by Arthur Hill,
Chief Technical Strategist, TrendInvestorPro.com
ATVI Hits Momentum of Truth after Big Game Release.
AKAM Fails to Partake in Market Surge.
Plus ARUN, CHS, GOOG, KSS, MMM
This commentary and charts-of-interest are designed to stimulate thinking. This analysis is not a recommendation to buy, sell, hold or sell short any security (stock ETF or otherwise)...
READ MORE
MEMBERS ONLY
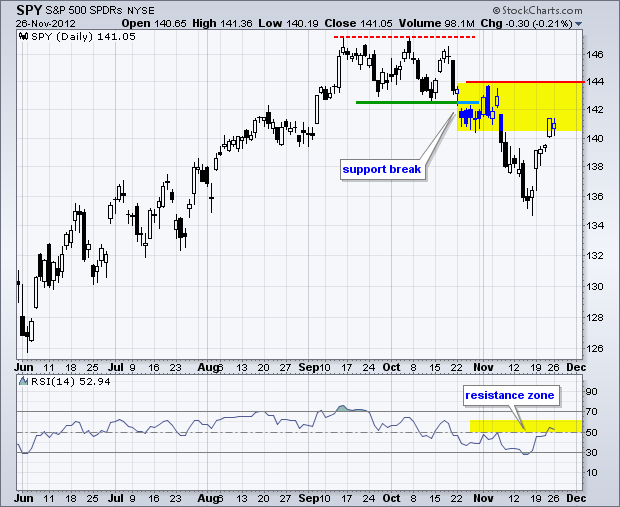
SPY Surges to Resistance as T-Bond ETF Bounces off Support
by Arthur Hill,
Chief Technical Strategist, TrendInvestorPro.com
The markets started November in risk-off mode as stocks and the Euro moved sharply lower. Both became quite oversold mid month and the major index ETFs formed hammers on Friday, November 16th. These minor selling climaxes marked a short-term turning point as the markets devoured risk the following week. Stocks,...
READ MORE
MEMBERS ONLY
Nikkei Breaks Resistance as Yen Plunges
by Arthur Hill,
Chief Technical Strategist, TrendInvestorPro.com
The Nikkei 225 ($NIKK) is getting a boost from weakness in the yen. Notice that the index broke resistance as the Yen Index ($XJY) broke support. The Nikkei benefits because a weaker Yen makes Japanese exports more competitive and this helps the overall economy.
Click this image for a live...
READ MORE
MEMBERS ONLY
Networking iShares Perks Up with Flag Breakout
by Arthur Hill,
Chief Technical Strategist, TrendInvestorPro.com
The Networking iShares (IGN) is showing some buying pressure with a flag breakout over the last four days. The ETF broke the September trendline in early November, pulled back with a flag and then broke the flag trendline. Notice that the price relative (IGN:SPY ratio) broke its trendline in...
READ MORE
MEMBERS ONLY
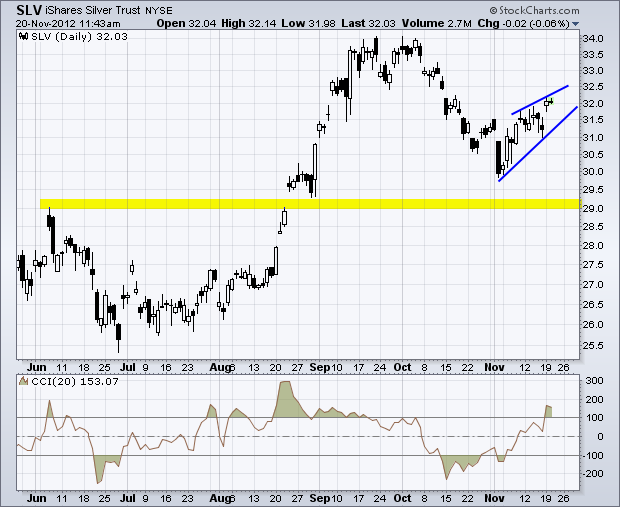
Silver ETF Forms Rising Wedge
by Arthur Hill,
Chief Technical Strategist, TrendInvestorPro.com
The Silver ETF moved sharply lower in October and then bounced with a rising wedge. The wedge is still rising, but broken support turns resistance in the 32.5 area. A wedge break would signal a continuation lower and target a move to next support in the 29 area.
Click...
READ MORE
MEMBERS ONLY
Consumer Staples SPDR Bounces off 200-day SMA
by Arthur Hill,
Chief Technical Strategist, TrendInvestorPro.com
Stocks found a bid on Monday as the Consumer Staples SPDR (XLP) continued its bounce off the rising 200-day moving average. Notice that XLP hit this moving average on Wednesday, firmed on Thursday and bounced on Friday. Today's follow through confirms support in the 34 area.
Click this...
READ MORE
MEMBERS ONLY
SPY and QQQ Firm with Hammers in Oversold Territory
by Arthur Hill,
Chief Technical Strategist, TrendInvestorPro.com
Programming note: I will be taking some time off for Thanksgiving and the next commentary will appear on November 27th. Stocks managed to firm on Friday with a number of ETFs forming hammer-like candlesticks. Hammers form with small bodies near the top of the high-low range. The open and close...
READ MORE
MEMBERS ONLY
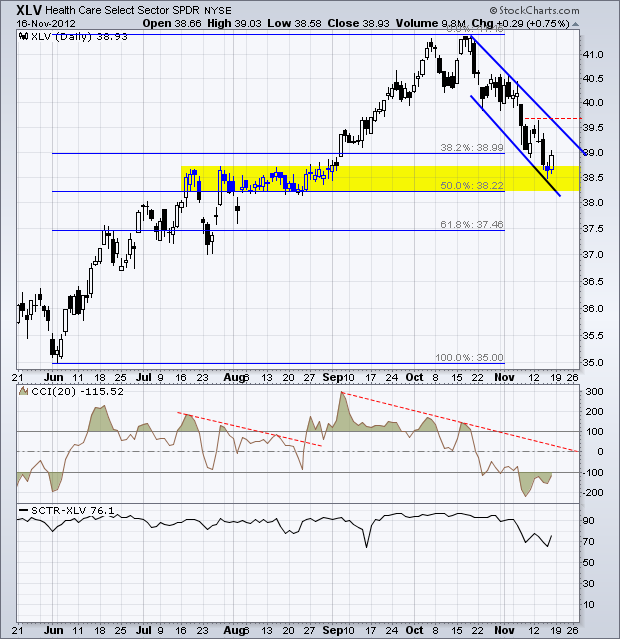
Healthcare SPDR Hits Support Zone
by Arthur Hill,
Chief Technical Strategist, TrendInvestorPro.com
All sectors are down over the last two months, but some are down less than others. Of the nine sector SPDRs, the Consumer Staples SPDR (XLP) and the Healthcare SPDR (XLV) are holding up the best. Relative strength in these two defensive sectors confirms that the market is currently in...
READ MORE
MEMBERS ONLY
SCTR Line Surges for Take-Two $TTWO
by Arthur Hill,
Chief Technical Strategist, TrendInvestorPro.com
Take-Two Interactive ($TTWO) is showing relative strength with a triangle break earlier this week and break above its October highs today. Notice that the StockCharts Technical Rank (SCTR) broke out just before the triangle break and surged above 70 this week. TTWO is part of the S&P SmallCap...
READ MORE
MEMBERS ONLY
Bulk of the Evidence Remains Decidedly Bearish
by Arthur Hill,
Chief Technical Strategist, TrendInvestorPro.com
The bulk of the evidence remains decidedly bearish. Even though stocks are oversold, the decline accelerated the last two weeks and we have yet to see any kind of selling climax or washout that would indicate a near-term bottom. We have also yet to see support in the major index...
READ MORE
MEMBERS ONLY
GLD Breaks Short-Term Support - USO Extends Consolidation
by Arthur Hill,
Chief Technical Strategist, TrendInvestorPro.com
Even though Thursday's losses were small, stocks just can't seem to shake that selling feeling. The major index ETFs edged lower the small-caps again leading the way. The sectors were mixed with three up and six down. Gains and losses were also small though. The Finance...
READ MORE
MEMBERS ONLY
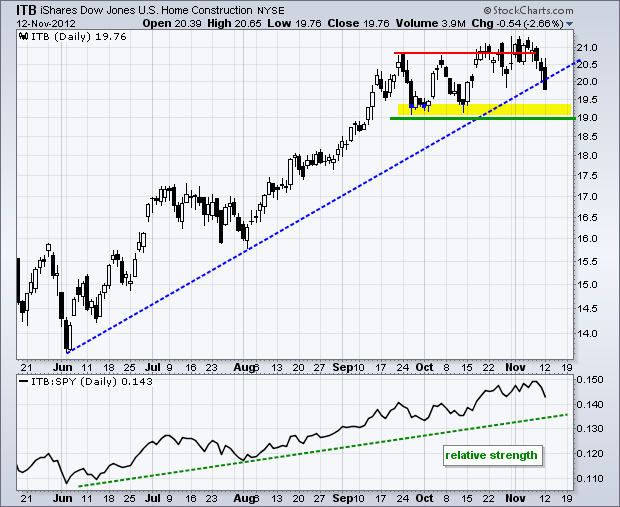
OBV Plunges as Home Construction iShares Breaks Support
by Arthur Hill,
Chief Technical Strategist, TrendInvestorPro.com
The Home Construction iShares (ITB) failed to hold its break above 21 and plunged over the last eight days. Volume expanded as the ETF broke the October lows. Notice that On Balance Volume (OBV) peaked a week ahead of the ETF and then moved to its lowest level since early...
READ MORE
MEMBERS ONLY
IWM Leads the Way Lower - USO Breaks Flag Resistance
by Arthur Hill,
Chief Technical Strategist, TrendInvestorPro.com
Selling pressure continued on Wednesday as the major index ETFs fell over 1%. The S&P MidCap 400 SPDR (MDY) and Russell 2000 ETF (IWM) led the way with losses approaching 2%. All sectors were down with the Finance SPDR (XLF) and the Industrials SPDR (XLI) leading the way....
READ MORE
MEMBERS ONLY
Charts of Interest: ALTR, ARO, CAKE, CHKP, COST
by Arthur Hill,
Chief Technical Strategist, TrendInvestorPro.com
ALTR Firms At Support.
ARO Bucks the Selling Pressure.
Plus CAKE, CHKP, COST
This commentary and charts-of-interest are designed to stimulate thinking. This analysis is not a recommendation to buy, sell, hold or sell short any security (stock ETF or otherwise). We all need to think for ourselves when it...
READ MORE
MEMBERS ONLY
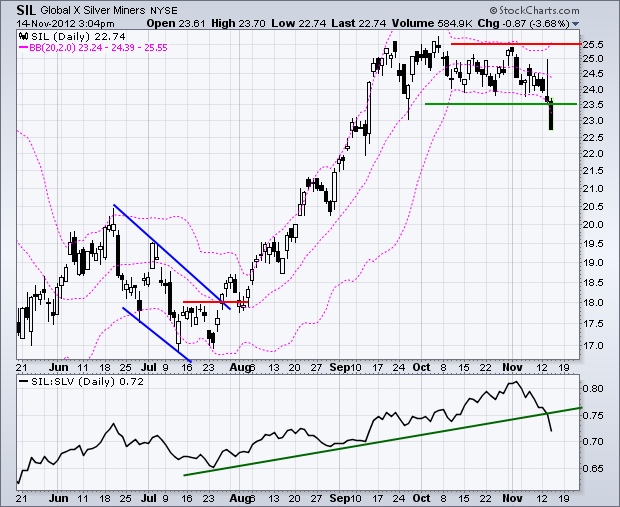
Silver Miners ETF Breaks Key Support Level
by Arthur Hill,
Chief Technical Strategist, TrendInvestorPro.com
The Silver Miners ETF (SIL) moved into a tight trading range in October and then broke support with a sharp decline the last four days. This move pushed prices below the lower Bollinger band as volatility expanded. Also notice that the ETF is now underperforming the Silver ETF (SLV).
Click...
READ MORE
MEMBERS ONLY
GLD and USO Form Small Flags
by Arthur Hill,
Chief Technical Strategist, TrendInvestorPro.com
Stocks continued to struggle as buyers found little reason to bottom pick on Tuesday. Stocks opened lower, surged in morning trade and then moved lower in the afternoon. The major index ETFs finished with small losses on the day. Seven of the nine sectors were lower with the Finance SPDR...
READ MORE
MEMBERS ONLY
Nasdaq Remains Below 200-day Moving Average
by Arthur Hill,
Chief Technical Strategist, TrendInvestorPro.com
The Nasdaq broke below the 200-day moving average with a gap down last week, and remains below this key level. This moving average and the small consolidation now turn into first resistance. Notice that RSI is almost at oversold levels (below 30).
Click this image for a live chart...
READ MORE
MEMBERS ONLY
IWM and QQQ Forms Pennants within Downtrend
by Arthur Hill,
Chief Technical Strategist, TrendInvestorPro.com
Stocks struggled on Tuesday with the major index ETFs finishing mixed. The Dow Industrials SPDR (DIA) edged higher, but the Russell 2000 ETF (IWM) and Nasdaq 100 ETF (QQQ) edged lower. Apple surged above 550 on the open, but closed below 445 as selling pressure hit. The market is wounded...
READ MORE
MEMBERS ONLY
Charts of Interest: CAT, LXK, MKC, MMM, RTN, SYK, WOR
by Arthur Hill,
Chief Technical Strategist, TrendInvestorPro.com
CAT Forms Bear Flag after Breakdown.
LXK Triangulates with Bearish Bias.
Plus MKC, MMM, RTN, SYK, WOR
This commentary and charts-of-interest are designed to stimulate thinking. This analysis is not a recommendation to buy, sell, hold or sell short any security (stock ETF or otherwise). We all need to think...
READ MORE
MEMBERS ONLY
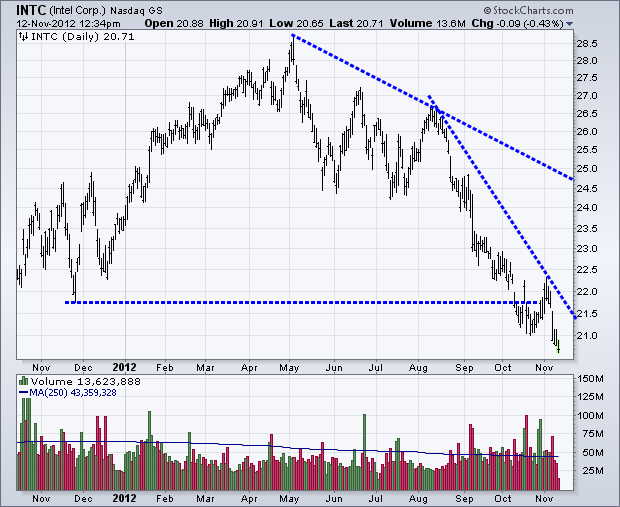
New Lows Expanding on the Predefined Scans Page
by Arthur Hill,
Chief Technical Strategist, TrendInvestorPro.com
The number of new 52-week lows surged above 90 for the NYSE and Nasdaq (combined). This compares to fewer than 50 new 52-week highs. Selling pressure is taking its toll the last few weeks. Of note, semiconductor powerhouse Intel (INTC) graced the new low list today.
Click this image for...
READ MORE
MEMBERS ONLY
SPY, IWM and QQQ Hit Channel Trend Lines
by Arthur Hill,
Chief Technical Strategist, TrendInvestorPro.com
It was a rough week for the stock market. The S&P 500 lost 2.43% and all sectors moved lower, even the defensive sectors. The Consumer Discretionary SPDR (XLY) and Technology SPDR (XLK) lost around 2.5%, while the Finance SPDR (XLF) fell over 3% and the Utilities...
READ MORE
MEMBERS ONLY
AMGN Forms Bullish Engulfing at Broken Resistance
by Arthur Hill,
Chief Technical Strategist, TrendInvestorPro.com
The intraday bullish engulfing scan was quite full around 12PM ET with over 200 stocks making the cut. Among them, Amgen (AMGN) formed a bullish engulfing near the mid October low and 38.2% retracement. The channel is still falling here with the upper trend line marking resistance at 87....
READ MORE
MEMBERS ONLY
Indicator Summary Turns Negative for First Time Since June
by Arthur Hill,
Chief Technical Strategist, TrendInvestorPro.com
With three downgrades, the indicator summary turned negative for the first time since June. The summary was zero (neutral) the last two weeks. The sharp decline over the last two days was enough to tilt the balance towards the bears. Of note, the NYSE AD Volume Line broke support, the...
READ MORE
MEMBERS ONLY
GLD Challenges Resistance as TLT Surges
by Arthur Hill,
Chief Technical Strategist, TrendInvestorPro.com
Stocks remained under pressure on Thursday with the major index ETFs falling 1% or more. As has been the case for some time, the Russell 2000 ETF (IWM) and the Nasdaq 100 ETF (QQQ) led the way lower. All nine sectors were down with the Consumer Discretionary SPDR (XLY) and...
READ MORE
MEMBERS ONLY
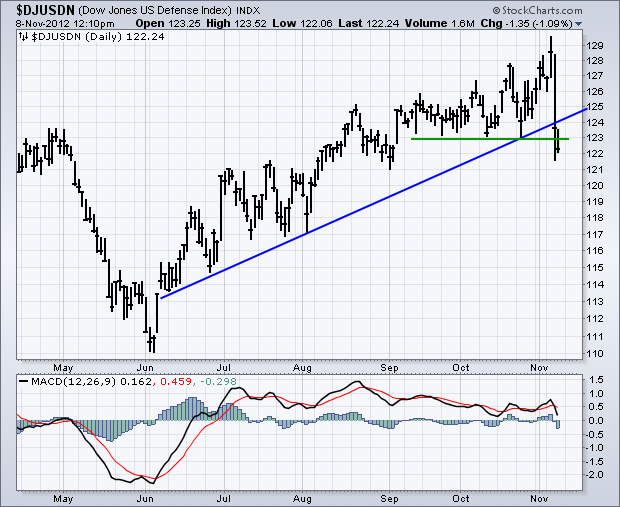
Defense Stocks Suffer as Fiscal Cliff Looms
by Arthur Hill,
Chief Technical Strategist, TrendInvestorPro.com
The Dow Jones Defense Index ($DJUSDN) plunged on Wednesday and broke support with further weakness on Thursday. This move reverses a five month uptrend. MACD also moved lower and is on the verge of turning negative for the first time since mid June. Click here to see a listing of...
READ MORE
MEMBERS ONLY
SPY Fails at Resistance as TLT Breaks Out and USO Plunges
by Arthur Hill,
Chief Technical Strategist, TrendInvestorPro.com
The markets moved from pre-election risk to post-election fear. Stocks, oil, copper and the Euro moved lower. Treasuries, the Dollar and gold moved higher. Yes, it is rare, and potentially stock market bearish, to see both gold and the Dollar moving higher. The finance sector was hit on the prospects...
READ MORE
MEMBERS ONLY
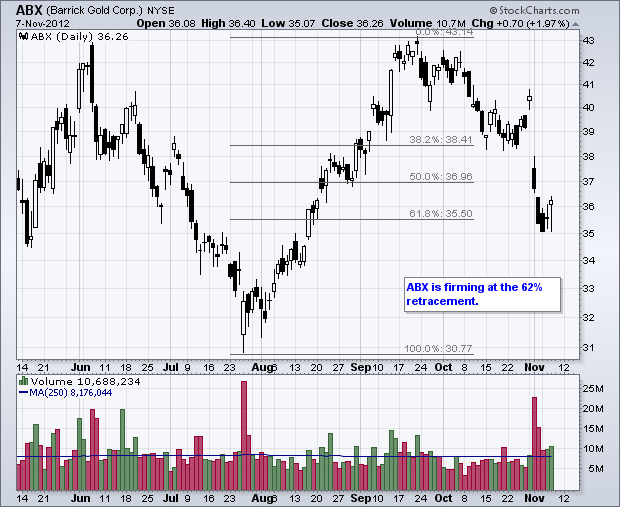
Charts of Interest: ABX, ERIC, KGC, SCHW, SWC, TGT
by Arthur Hill,
Chief Technical Strategist, TrendInvestorPro.com
ABX Firms at Key Retracement.
ERIC Bucks the Selling Pressure.
Plus KGC, SCHW, SWC, TGT
This commentary and charts-of-interest are designed to stimulate thinking. This analysis is not a recommendation to buy, sell, hold or sell short any security (stock ETF or otherwise). We all need to think for ourselves...
READ MORE
MEMBERS ONLY
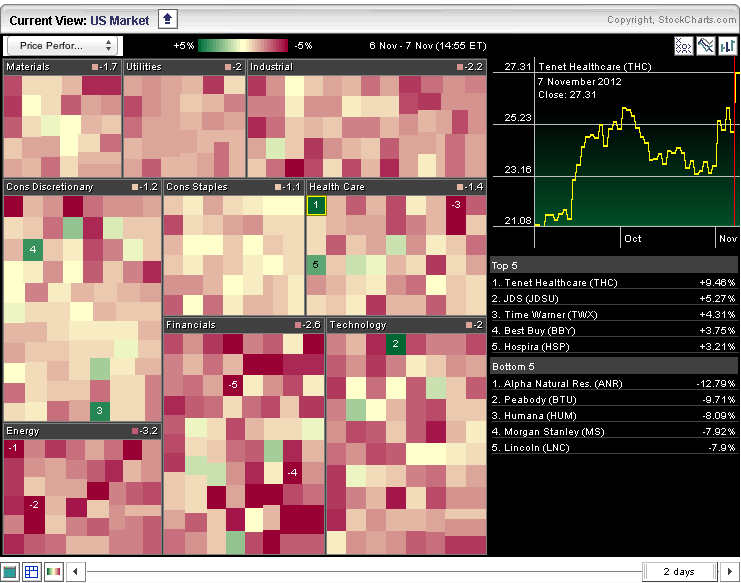
Not Much Green on the Sector Carpet
by Arthur Hill,
Chief Technical Strategist, TrendInvestorPro.com
There are not many gainers today, but a few can be found on the Sector Market Carpet. The isolated green boxes show the stocks bucking the selling pressure. Tenet HealthCare and Hospira are up in the healthcare sector, while Best Buy and Time Warner are up in the consumer discretionary...
READ MORE
MEMBERS ONLY
SPY and GLD Surge to Challenge Resistance
by Arthur Hill,
Chief Technical Strategist, TrendInvestorPro.com
The markets embraced a little pre-election risk on Tuesday with the Dow Industrials SPDR (DIA) and S&P MidCap 400 SPDR (MDY) leading the way. The gains were modest, the election is over and investors can now turn to the next big issue (the fiscal cliff?). Energy, finance, materials...
READ MORE
MEMBERS ONLY
QQQ hits Support on 50 Cent P&F Chart
by Arthur Hill,
Chief Technical Strategist, TrendInvestorPro.com
Even though the 50-cent P&F chart for QQQ sport a double bottom breakdown, the overall trend is up because QQQ remains above the Bullish Support Line (blue). Also notice that the ETF is hitting support from broken resistance at 65. The moment-of-truth is here for QQQ.
Click this...
READ MORE
MEMBERS ONLY
QQQ Remains with Falling Channel
by Arthur Hill,
Chief Technical Strategist, TrendInvestorPro.com
Stocks managed to firm on Monday with small gains in the major index ETFs. The Nasdaq 100 ETF (QQQ) and Russell 2000 ETF (IWM) led the way (up .66%). Six of the nine sectors were up with the Basic Materials SPDR (XLB) and Energy SPDR (XLE) leading the way. The...
READ MORE
MEMBERS ONLY
Charts of Interest: AMAT, ARUN, DUK, HES, HUM, MCHP
by Arthur Hill,
Chief Technical Strategist, TrendInvestorPro.com
AMAT Breaks Wedge Resistance.
ARUM Forms at 50% Retracement.
Plus DUK, HUM, MCHP
This commentary and charts-of-interest are designed to stimulate thinking. This analysis is not a recommendation to buy, sell, hold or sell short any security (stock ETF or otherwise). We all need to think for ourselves when it...
READ MORE
MEMBERS ONLY
Amazon Stalls with Four Inside Days
by Arthur Hill,
Chief Technical Strategist, TrendInvestorPro.com
Amazon.com surged with a long white candlestick last week and then stalled the next four days. Notice that these four candlesticks are all within the range of the long white candlestick. These inside days reflect a consolidation. Watch for a range break to trigger the next directional signal.
Click...
READ MORE
MEMBERS ONLY
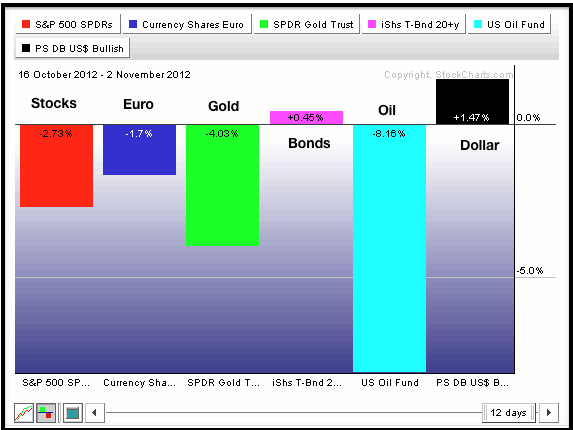
Dollar Breakout Weighs on Stocks and Gold
by Arthur Hill,
Chief Technical Strategist, TrendInvestorPro.com
Markets move to risk-off mode in mid October. Since October 16th, the S&P 500 ETF is down 2.73%, the Euro Currency Trust (FXE) is down 1.7%, the US Oil Fund (USO) is down a whopping 8.16% and the Gold SPDR (GLD) is down 4.03%...
READ MORE
MEMBERS ONLY
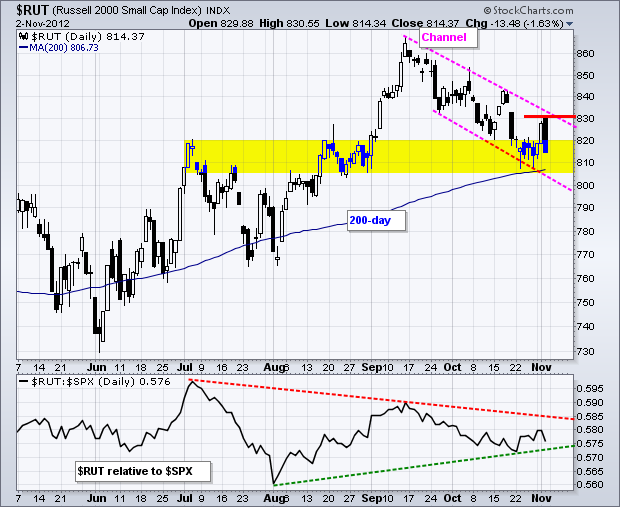
Russell 2000 Gets Cold Feet at Channel Resistance
by Arthur Hill,
Chief Technical Strategist, TrendInvestorPro.com
Stocks surged on Thursday and even followed through on Friday morning, but strength did not last long as selling pressure kicked in after the initial pop. Perhaps some pre-election jitters produced this classic pop and drop. Whatever the case, the Russell 2000 hit stiff resistance near its channel trend line...
READ MORE
MEMBERS ONLY
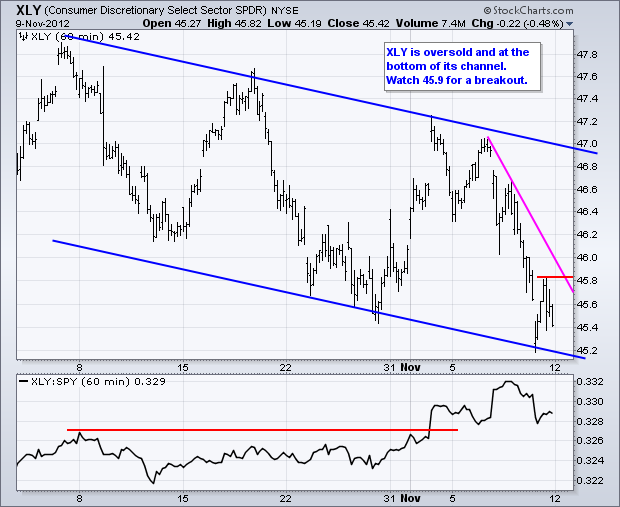
Consumer Discretionary Stocks Show Biggest SCTR Gains
by Arthur Hill,
Chief Technical Strategist, TrendInvestorPro.com
The Consumer Discretionary SPDR (XLY) is getting a boost on Friday from several big moves within the sector. As the StockCharts Technical Rank (SCTR) table shows, the top four SCTR gains come from the consumer discretionary sector. You can read more about SCTR in our ChartSchool article.
Click this image...
READ MORE
MEMBERS ONLY
Small-cap Perforamance Perks Up, but Nasdaq Remains a Drag
by Arthur Hill,
Chief Technical Strategist, TrendInvestorPro.com
The indicator summary remains neutral. Weakness in the Nasdaq weighed on the Nasdaq AD Volume Line and the technology sector, both of which are bearish. Strength in the finance sector kept the NYSE AD Line strong and NYSE Net New Highs remain positive. I am also starting to see relative...
READ MORE
MEMBERS ONLY
MDY Leads with Breakout - TLT Falls ahead of big Report
by Arthur Hill,
Chief Technical Strategist, TrendInvestorPro.com
Better than expected data on the economy lifted stocks and punished treasuries. The ISM Manufacturing Index rose to 51.7 in October. Anything above 50 favors economic expansion. In a preview of today's non-farm payroll report, the ADP Employment report showed the biggest increase in private payrolls since...
READ MORE