MEMBERS ONLY
New Lows Expanding on the Predefined Scans Page
by Arthur Hill,
Chief Technical Strategist, TrendInvestorPro.com
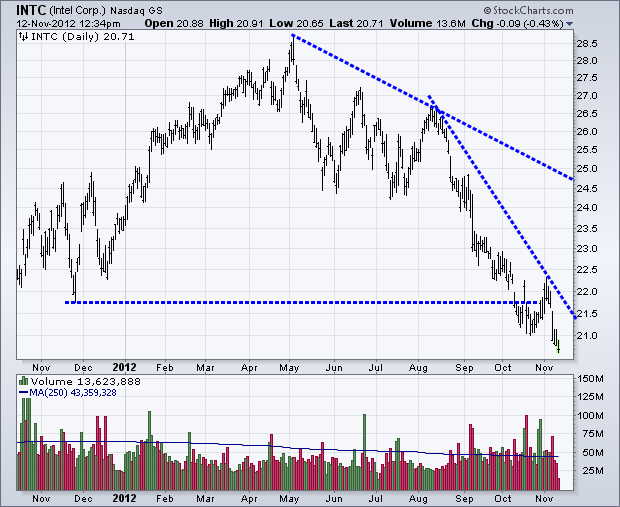
The number of new 52-week lows surged above 90 for the NYSE and Nasdaq (combined). This compares to fewer than 50 new 52-week highs. Selling pressure is taking its toll the last few weeks. Of note, semiconductor powerhouse Intel (INTC) graced the new low list today.
Click this...
READ MORE
MEMBERS ONLY
SPY, IWM and QQQ Hit Channel Trend Lines
by Arthur Hill,
Chief Technical Strategist, TrendInvestorPro.com
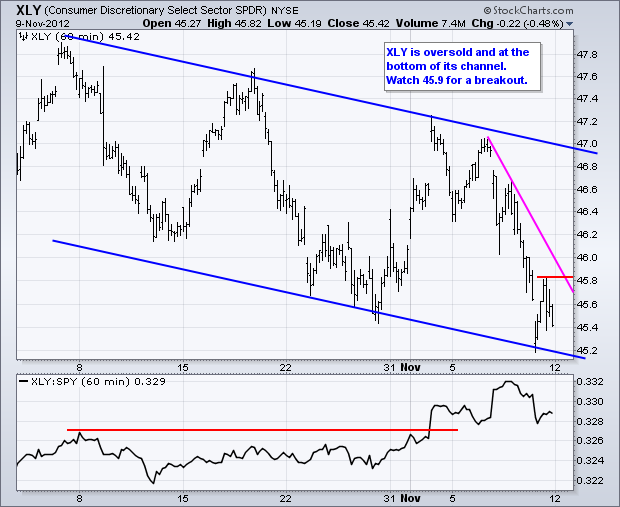
It was a rough week for the stock market. The S&P 500 lost 2.43% and all sectors moved lower, even the defensive sectors. The Consumer Discretionary SPDR (XLY) and Technology SPDR (XLK) lost around 2.5%, while the Finance SPDR (XLF) fell over 3% and the Utilities...
READ MORE
MEMBERS ONLY
AMGN Forms Bullish Engulfing at Broken Resistance
by Arthur Hill,
Chief Technical Strategist, TrendInvestorPro.com
The intraday bullish engulfing scan was quite full around 12PM ET with over 200 stocks making the cut. Among them, Amgen (AMGN) formed a bullish engulfing near the mid October low and 38.2% retracement. The channel is still falling here with the upper trend line marking resistance at 87....
READ MORE
MEMBERS ONLY
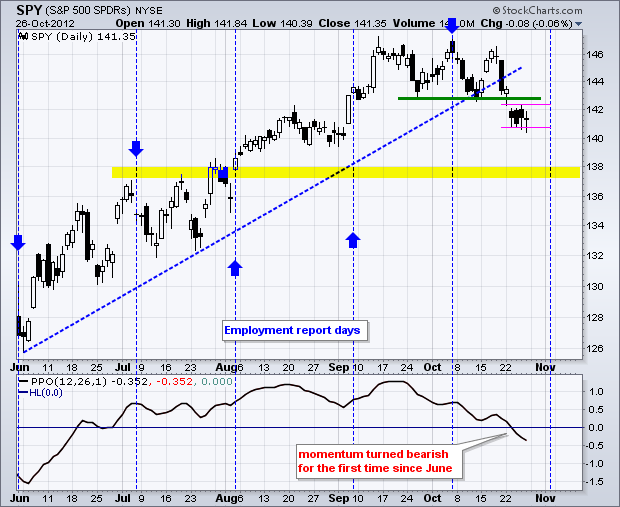
Indicator Summary Turns Negative for First Time Since June
by Arthur Hill,
Chief Technical Strategist, TrendInvestorPro.com
With three downgrades, the indicator summary turned negative for the first time since June. The summary was zero (neutral) the last two weeks. The sharp decline over the last two days was enough to tilt the balance towards the bears. Of note, the NYSE AD Volume Line broke support, the...
READ MORE
MEMBERS ONLY
GLD Challenges Resistance as TLT Surges
by Arthur Hill,
Chief Technical Strategist, TrendInvestorPro.com
Stocks remained under pressure on Thursday with the major index ETFs falling 1% or more. As has been the case for some time, the Russell 2000 ETF (IWM) and the Nasdaq 100 ETF (QQQ) led the way lower. All nine sectors were down with the Consumer Discretionary SPDR (XLY) and...
READ MORE
MEMBERS ONLY
Defense Stocks Suffer as Fiscal Cliff Looms
by Arthur Hill,
Chief Technical Strategist, TrendInvestorPro.com
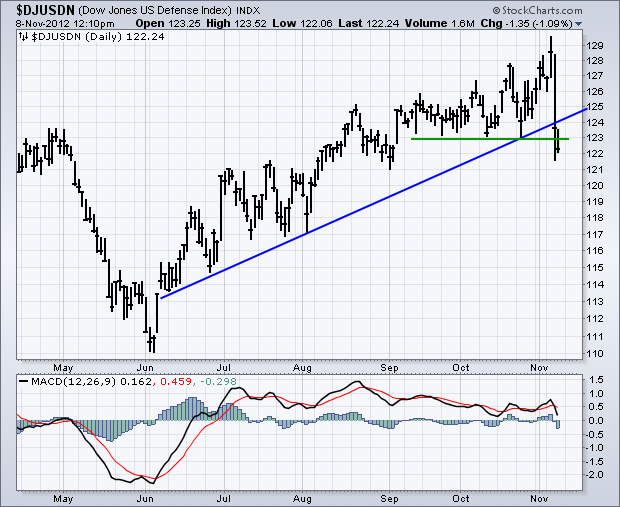
The Dow Jones Defense Index ($DJUSDN) plunged on Wednesday and broke support with further weakness on Thursday. This move reverses a five month uptrend. MACD also moved lower and is on the verge of turning negative for the first time since mid June. Click here to see a listing of...
READ MORE
MEMBERS ONLY
SPY Fails at Resistance as TLT Breaks Out and USO Plunges
by Arthur Hill,
Chief Technical Strategist, TrendInvestorPro.com
The markets moved from pre-election risk to post-election fear. Stocks, oil, copper and the Euro moved lower. Treasuries, the Dollar and gold moved higher. Yes, it is rare, and potentially stock market bearish, to see both gold and the Dollar moving higher. The finance sector was hit on...
READ MORE
MEMBERS ONLY
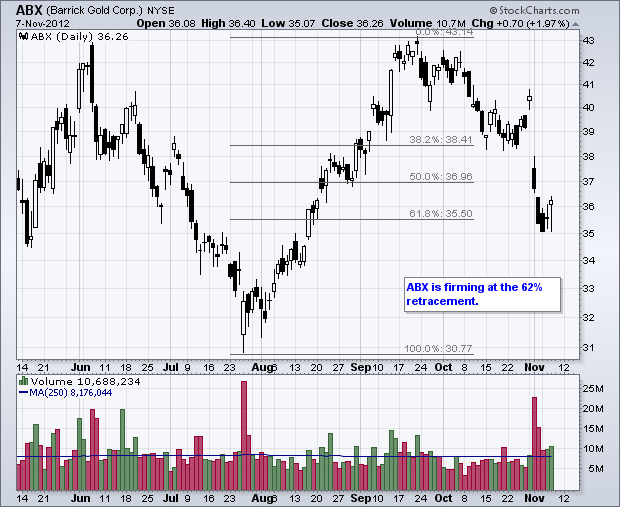
Charts of Interest: ABX, ERIC, KGC, SCHW, SWC, TGT
by Arthur Hill,
Chief Technical Strategist, TrendInvestorPro.com
ABX Firms at Key Retracement.
ERIC Bucks the Selling Pressure.
Plus KGC, SCHW, SWC, TGT
This commentary and charts-of-interest are designed to stimulate thinking. This analysis is not a recommendation to buy, sell, hold or sell short any security (stock ETF or otherwise). We all need to think...
READ MORE
MEMBERS ONLY
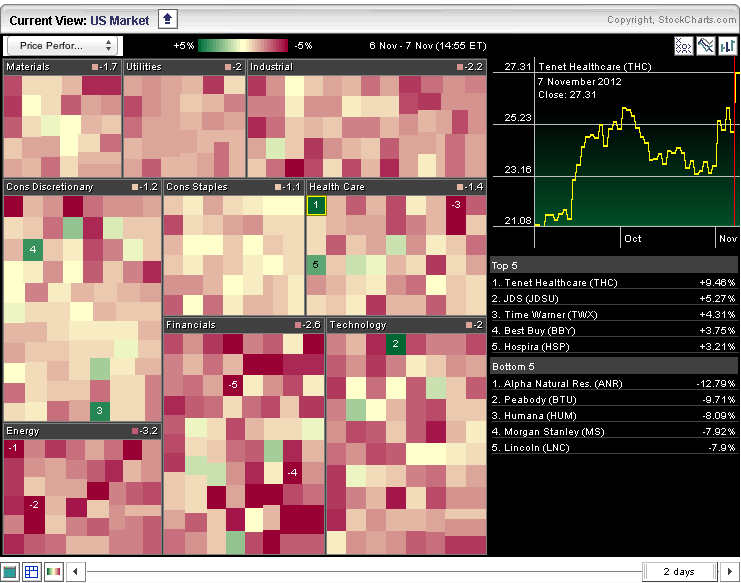
Not Much Green on the Sector Carpet
by Arthur Hill,
Chief Technical Strategist, TrendInvestorPro.com
There are not many gainers today, but a few can be found on the Sector Market Carpet. The isolated green boxes show the stocks bucking the selling pressure. Tenet HealthCare and Hospira are up in the healthcare sector, while Best Buy and Time Warner are up in the consumer discretionary...
READ MORE
MEMBERS ONLY
SPY and GLD Surge to Challenge Resistance
by Arthur Hill,
Chief Technical Strategist, TrendInvestorPro.com
The markets embraced a little pre-election risk on Tuesday with the Dow Industrials SPDR (DIA) and S&P MidCap 400 SPDR (MDY) leading the way. The gains were modest, the election is over and investors can now turn to the next big issue (the fiscal cliff?). Energy, finance,...
READ MORE
MEMBERS ONLY
QQQ hits Support on 50 Cent P&F Chart
by Arthur Hill,
Chief Technical Strategist, TrendInvestorPro.com
Even though the 50-cent P&F chart for QQQ sport a double bottom breakdown, the overall trend is up because QQQ remains above the Bullish Support Line (blue). Also notice that the ETF is hitting support from broken resistance at 65. The moment-of-truth is here for...
READ MORE
MEMBERS ONLY
QQQ Remains with Falling Channel
by Arthur Hill,
Chief Technical Strategist, TrendInvestorPro.com
Stocks managed to firm on Monday with small gains in the major index ETFs. The Nasdaq 100 ETF (QQQ) and Russell 2000 ETF (IWM) led the way (up .66%). Six of the nine sectors were up with the Basic Materials SPDR (XLB) and Energy SPDR (XLE) leading the way. The...
READ MORE
MEMBERS ONLY
Charts of Interest: AMAT, ARUN, DUK, HES, HUM, MCHP
by Arthur Hill,
Chief Technical Strategist, TrendInvestorPro.com
AMAT Breaks Wedge Resistance.
ARUM Forms at 50% Retracement.
Plus DUK, HUM, MCHP
This commentary and charts-of-interest are designed to stimulate thinking. This analysis is not a recommendation to buy, sell, hold or sell short any security (stock ETF or otherwise). We all need to think for ourselves...
READ MORE
MEMBERS ONLY
Amazon Stalls with Four Inside Days
by Arthur Hill,
Chief Technical Strategist, TrendInvestorPro.com
Amazon.com surged with a long white candlestick last week and then stalled the next four days. Notice that these four candlesticks are all within the range of the long white candlestick. These inside days reflect a consolidation. Watch for a range break to trigger the next directional signal.
Click...
READ MORE
MEMBERS ONLY
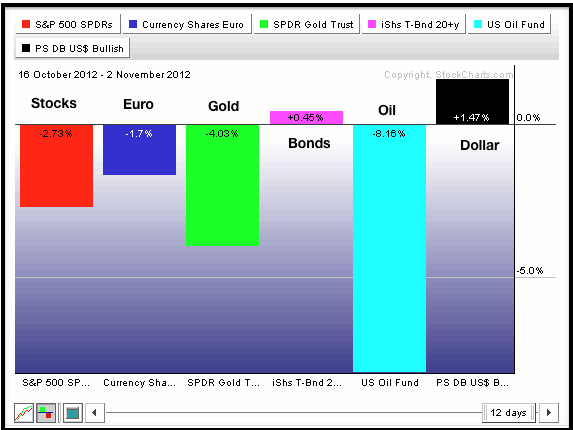
Dollar Breakout Weighs on Stocks and Gold
by Arthur Hill,
Chief Technical Strategist, TrendInvestorPro.com
Markets move to risk-off mode in mid October. Since October 16th, the S&P 500 ETF is down 2.73%, the Euro Currency Trust (FXE) is down 1.7%, the US Oil Fund (USO) is down a whopping 8.16% and the Gold SPDR (GLD) is down 4....
READ MORE
MEMBERS ONLY
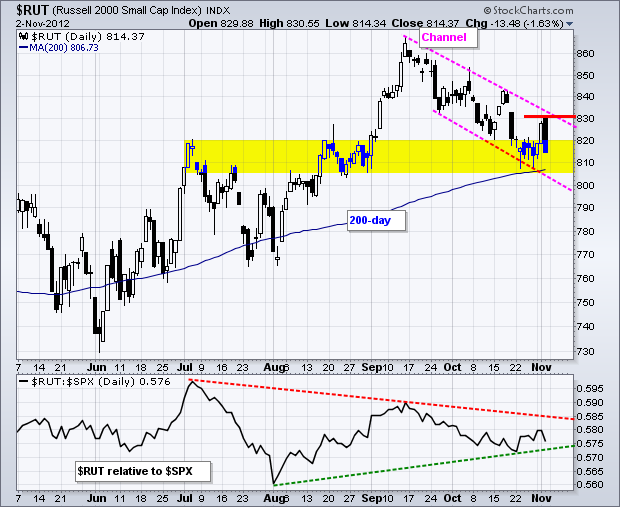
Russell 2000 Gets Cold Feet at Channel Resistance
by Arthur Hill,
Chief Technical Strategist, TrendInvestorPro.com
Stocks surged on Thursday and even followed through on Friday morning, but strength did not last long as selling pressure kicked in after the initial pop. Perhaps some pre-election jitters produced this classic pop and drop. Whatever the case, the Russell 2000 hit stiff resistance near its channel trend...
READ MORE
MEMBERS ONLY
Consumer Discretionary Stocks Show Biggest SCTR Gains
by Arthur Hill,
Chief Technical Strategist, TrendInvestorPro.com
The Consumer Discretionary SPDR (XLY) is getting a boost on Friday from several big moves within the sector. As the StockCharts Technical Rank (SCTR) table shows, the top four SCTR gains come from the consumer discretionary sector. You can read more about SCTR in our ChartSchool article.
Click this image...
READ MORE
MEMBERS ONLY
Small-cap Perforamance Perks Up, but Nasdaq Remains a Drag
by Arthur Hill,
Chief Technical Strategist, TrendInvestorPro.com
The indicator summary remains neutral. Weakness in the Nasdaq weighed on the Nasdaq AD Volume Line and the technology sector, both of which are bearish. Strength in the finance sector kept the NYSE AD Line strong and NYSE Net New Highs remain positive. I am also starting to see relative...
READ MORE
MEMBERS ONLY
MDY Leads with Breakout - TLT Falls ahead of big Report
by Arthur Hill,
Chief Technical Strategist, TrendInvestorPro.com
Better than expected data on the economy lifted stocks and punished treasuries. The ISM Manufacturing Index rose to 51.7 in October. Anything above 50 favors economic expansion. In a preview of today's non-farm payroll report, the ADP Employment report showed the biggest increase in private payrolls...
READ MORE
MEMBERS ONLY
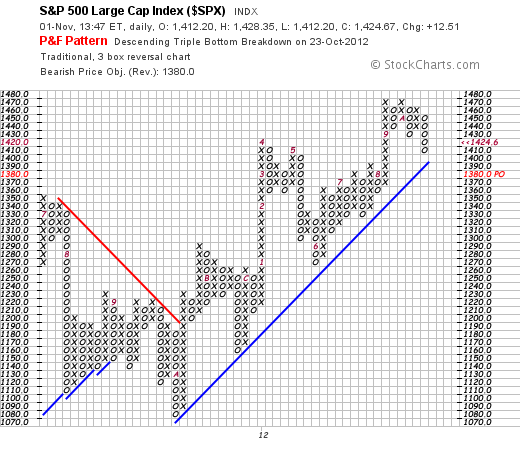
S&P 500 Holds Bullish Support Line on P&F Chart
by Arthur Hill,
Chief Technical Strategist, TrendInvestorPro.com
The S&P 500 declined sharply in October, but caught a bid on November 1st and held above the Bullish Support Line. This line has held since October 2011 and represents a one year uptrend. A move below this trend line would signal a reversal.
Click this image for...
READ MORE
MEMBERS ONLY
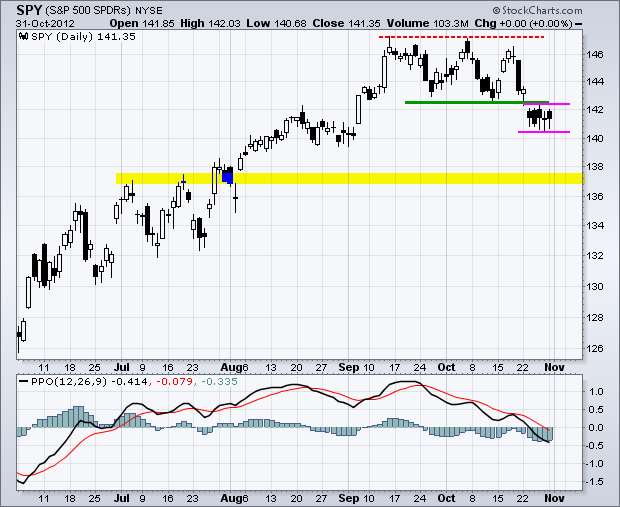
SPY Consolidates below Support - TLT Surges above Resistance
by Arthur Hill,
Chief Technical Strategist, TrendInvestorPro.com
Stocks are holding their breath ahead of an economic avalanche and presidential election. Today we can expect the ADP Employment Report, Challenger Job Report, Jobless Claims, ISM Manufacturing Index, Construction Spending, Consumer Confidence and Auto/Truck Sales. The Employment Report and Factory Orders will be on Friday. And, of course,...
READ MORE
MEMBERS ONLY
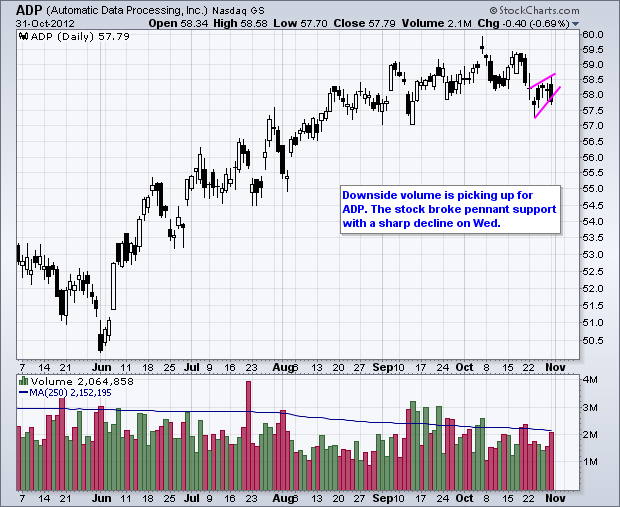
Charts of Interest: ADP, AEE, BDX, BWA, DUK, ESRX, JCP, PAYX
by Arthur Hill,
Chief Technical Strategist, TrendInvestorPro.com
ADP Breaks Pennant Support.
AEE Bounces off Support with Good Volume.
Plus BDX, BWA, DUK, ESRX, JCP, PAYX
This commentary and charts-of-interest are designed to stimulate thinking. This analysis is not a recommendation to buy, sell, hold or sell short any security (stock ETF or otherwise). We all...
READ MORE
MEMBERS ONLY
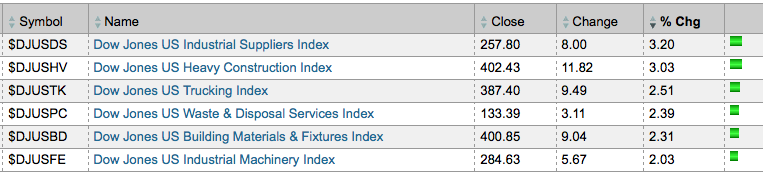
Building Materials, Industrial Suppliers and Construction Lead after Sandy
by Arthur Hill,
Chief Technical Strategist, TrendInvestorPro.com
A look at the Dow Jones industry groups shows strength coming from the DJ US Building and Fixtures Index ($DJUSBD), the DJ US Industrial Suppliers Index ($DJUSDS) and the DJ US Heavy Construction Index ($DJUSHV). These three groups, which are in the industrials sector, are likely benefitting from the rebuilding...
READ MORE
MEMBERS ONLY
Bombardier Triangulates with Expanding Volume
by Arthur Hill,
Chief Technical Strategist, TrendInvestorPro.com
Bombardier (BBD/B.TO) got a big surge in early September and then formed an extended triangle the last six weeks. Upside volume within the triangle is picking up as OBV moves higher in the indicator window. A triangle breakout would signal a continuation of the September surge.
Click this...
READ MORE
MEMBERS ONLY
TELUS Corp Makes a Breakout Bid
by Arthur Hill,
Chief Technical Strategist, TrendInvestorPro.com
TELUS Corp (T.TO) is showing signs of price strength with a channel breakout in late September and a surge over the last four days. This four day surge reinforces support in the 61-62 area. TELUS is on the verge of a breakout, but volume has been weak and...
READ MORE
MEMBERS ONLY
SPY Consolidates in Downtrend - TLT Surges to Flag Resistance
by Arthur Hill,
Chief Technical Strategist, TrendInvestorPro.com
First, note that the NYSE and Nasdaq are closed on Monday because of hurricane Sandy. I am going to review some daily charts to offer a little more perspective today. After a rough start to the week, stocks managed to firm the last three days. Firmness is one thing. Buying...
READ MORE
MEMBERS ONLY
Three Bearish Engulfings Mark Resistance for ITB
by Arthur Hill,
Chief Technical Strategist, TrendInvestorPro.com
The uptrend in the Home Construction iShares (ITB) is stalling as three bearish engulfing patterns formed in the 26 area. ITB was poised to break resistance with a surge on Thursday, but failed to hold its gains and continued lower on Friday. The Sep-Oct lows mark key support.
Click...
READ MORE
MEMBERS ONLY
Split Market Turns Indicator Summary Neutral
by Arthur Hill,
Chief Technical Strategist, TrendInvestorPro.com
The indicator summary reflects the split nature of the stock market. The finance sector is strong, but the technology sector is weak, very weak. The consumer discretionary and industrials sectors are holding the line though. Much of the weakness stems from the Nasdaq and technology sector. The Nasdaq AD Volume...
READ MORE
MEMBERS ONLY
XLY Breaks Support - IWM Starts to Outperform
by Arthur Hill,
Chief Technical Strategist, TrendInvestorPro.com
Stocks managed to eek out small gains on Thursday as the Russell 2000 ETF (IWM) advanced .41% and the Nasdaq 100 Equal-Weight ETF (QQEW) added .52%. Note, however, that the Nasdaq 100 ETF (QQQ) closed down a fraction (.01%). Stocks were under selling pressure after the close as Amazon...
READ MORE
MEMBERS ONLY
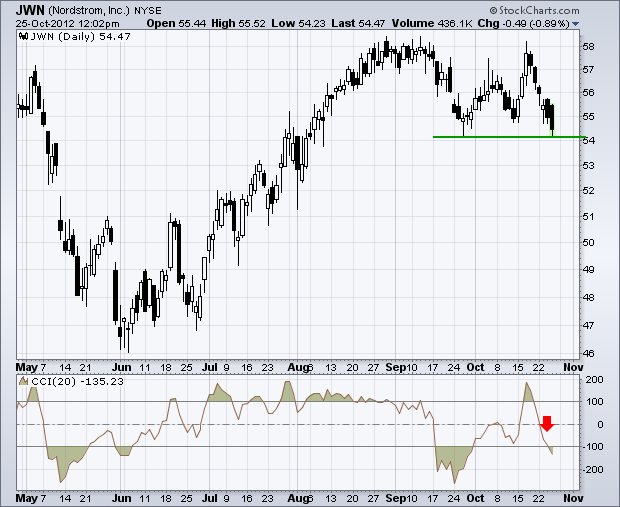
Nordstrom Tests Support as CCI Plunges
by Arthur Hill,
Chief Technical Strategist, TrendInvestorPro.com
Nordstrom (JWN) surged last week, but gave back these gains with a sharp decline the last six days. JWN is now testing support from the late September low. Momentum abruptly shifted as well. Notice that CCI plunged below -100 and this may signal that a new downtrend is emerging for...
READ MORE
MEMBERS ONLY
UUP Hits Big Resistance - TLT Breaks Channel Support
by Arthur Hill,
Chief Technical Strategist, TrendInvestorPro.com
Stocks remained under pressure on Wednesday, but the losses were relatively muted. Techs were again under pressure with declines in the Semiconductor SPDR (XSD), Networking iShares (IGN) and FirstTrust Internet ETF (FDN). These three held up relatively well on Tuesday, but gave it all back on Wednesday. There has been...
READ MORE
MEMBERS ONLY
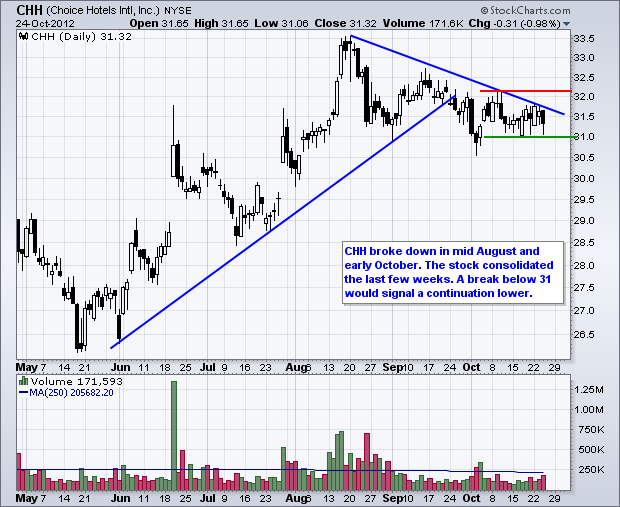
Charts of Interest: CHH, CTSH, F, IMAX, LXK
by Arthur Hill,
Chief Technical Strategist, TrendInvestorPro.com
CHH Consolidates after Breakdown.
IMAX Forms Bull Flag after Surge.
Plus CTSH, F, LXK
This commentary and charts-of-interest are designed to stimulate thinking. This analysis is not a recommendation to buy, sell, hold or sell short any security (stock ETF or otherwise). We all need to think for...
READ MORE
MEMBERS ONLY
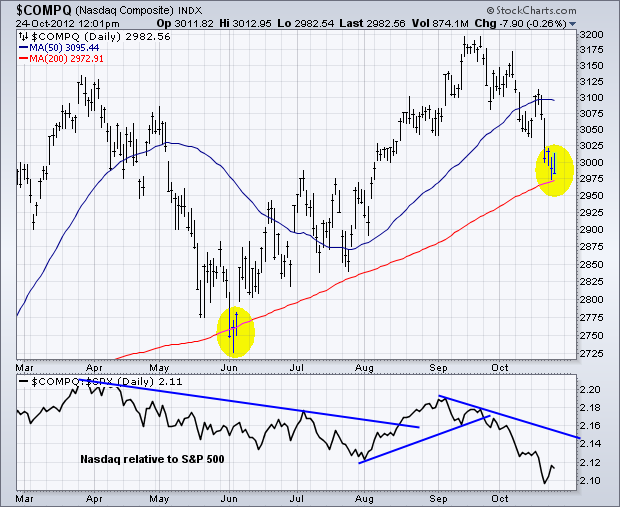
Nasdaq Tests 200-day Moving Average
by Arthur Hill,
Chief Technical Strategist, TrendInvestorPro.com
With a sharp decline the last five weeks, the Nasdaq is poised to test its rising 200-day moving average. The red line is the 200-day and this key average was last tested in early June. Note that the index is underperforming the S&P 500 as the...
READ MORE
MEMBERS ONLY
IGN Hits Support Zone - UUP Challenges Resistance
by Arthur Hill,
Chief Technical Strategist, TrendInvestorPro.com
Stocks were hit with selling pressure on Tuesday, but there were some pockets of strength in the technology sector. The Dow Industrials SPDR (DIA) led the way lower with a 1.77% decline. The Russell 2000 ETF (IWM) held up the best with a .50% decline. Go figure. Materials stocks...
READ MORE
MEMBERS ONLY
Transports Buck the Selling Pressure with Gain
by Arthur Hill,
Chief Technical Strategist, TrendInvestorPro.com
The image below comes from a Major Indices Market Carpet. The Dow Industrials is getting hit hard, but the Dow Transports is holding up rather well thanks for strength in UPS. The Nasdaq 100 ($NDX) is also holding up rather well with gains coming from Yahoo and Virgin Media.
Click...
READ MORE
MEMBERS ONLY
SPY Gets Oversold Bounce as TLT Hits Resistance
by Arthur Hill,
Chief Technical Strategist, TrendInvestorPro.com
Stocks meandered around on Monday as trading turned quite mixed. The Nasdaq 100 ETF (QQQ) edged higher, while the S&P MidCap 400 SPDR (MDY) edged lower. Apple caught a bid ahead of its earnings report on Thursday. The sectors were also mixed with the Basic Materials SPDR (XLB)...
READ MORE
MEMBERS ONLY
Charts of Interest: COH, DAL, HAS, NKE, TSN
by Arthur Hill,
Chief Technical Strategist, TrendInvestorPro.com
Careful out there. It is earnings season.
CAH Forms Bear Flag after Breakdown
DAL Forms Pennant after Breakout.
Plus HAS, NKE, TSN
This commentary and charts-of-interest are designed to stimulate thinking. This analysis is not a recommendation to buy, sell, hold or sell short any security (stock ETF...
READ MORE
MEMBERS ONLY
XLY and SPY Poised for Big Support Tests
by Arthur Hill,
Chief Technical Strategist, TrendInvestorPro.com
It was another rough week for the stock market, especially tech stocks. Even though the S&P 500 ETF (SPY) remains within a consolidation pattern since mid September, the Nasdaq 100 ETF (QQQ) is in a clear downtrend with a 6+ percent decline from its mid September high. Relative...
READ MORE
MEMBERS ONLY
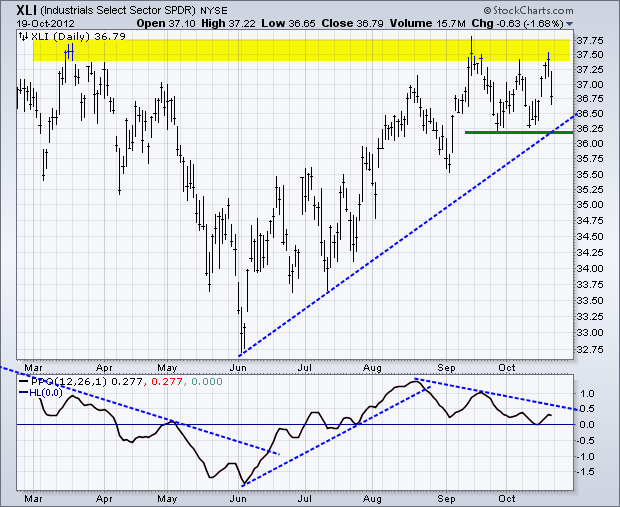
XLY and XLI Set Up Key Support Tests
by Arthur Hill,
Chief Technical Strategist, TrendInvestorPro.com
Weakness in the technology sector has been offset by strength in the finance sector since early September. This is why the S&P 500 is range bound the last five weeks and the Nasdaq is in a downtrend. With these two sectors cancelling each other out, chartists must turn...
READ MORE
MEMBERS ONLY
A Bearish MACD Crossover for OpenTable
by Arthur Hill,
Chief Technical Strategist, TrendInvestorPro.com
OpenTable (OPEN) shows signs of rolling over as a lower high takes shape and MACD moves below its signal line. Notice that OPEN hit resistance near the 61.80% retracement just above 46. MACD is barely in positive territory and this downturn puts it on the trajectory to turn negative....
READ MORE