MEMBERS ONLY
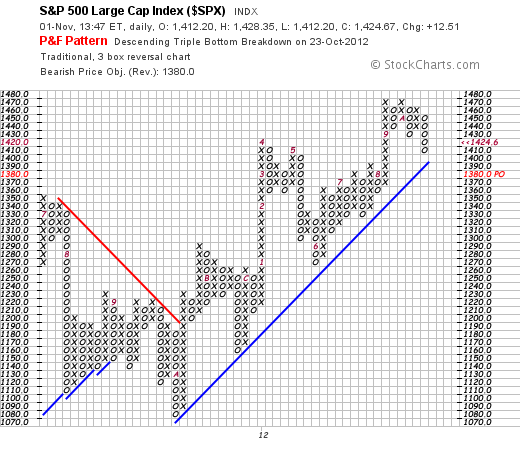
S&P 500 Holds Bullish Support Line on P&F Chart
by Arthur Hill,
Chief Technical Strategist, TrendInvestorPro.com
The S&P 500 declined sharply in October, but caught a bid on November 1st and held above the Bullish Support Line. This line has held since October 2011 and represents a one year uptrend. A move below this trend line would signal a reversal.
Click this image for...
READ MORE
MEMBERS ONLY
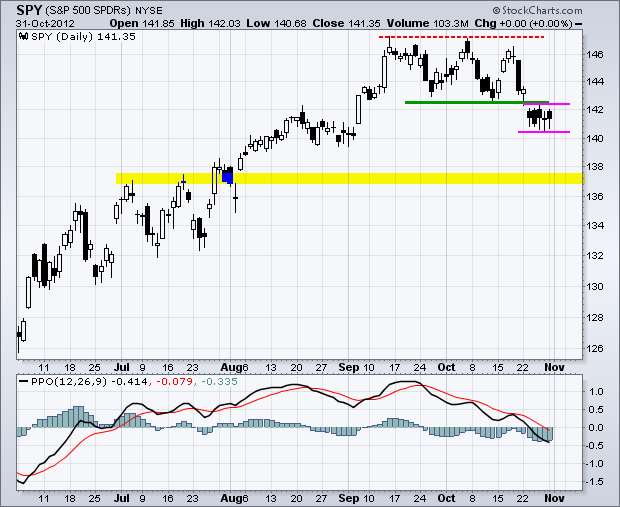
SPY Consolidates below Support - TLT Surges above Resistance
by Arthur Hill,
Chief Technical Strategist, TrendInvestorPro.com
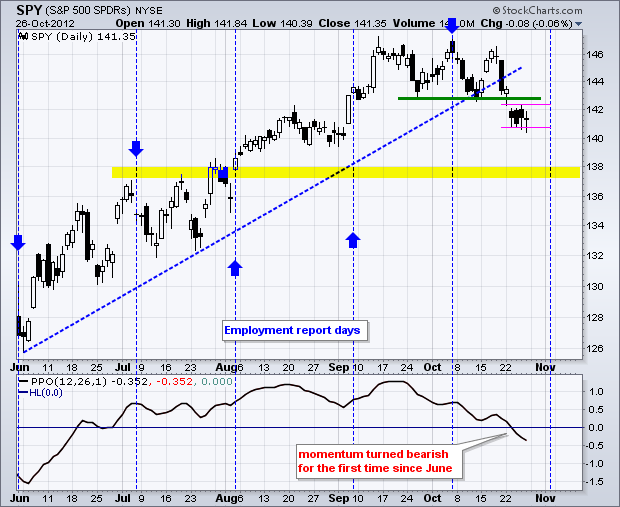
Stocks are holding their breath ahead of an economic avalanche and presidential election. Today we can expect the ADP Employment Report, Challenger Job Report, Jobless Claims, ISM Manufacturing Index, Construction Spending, Consumer Confidence and Auto/Truck Sales. The Employment Report and Factory Orders will be on Friday. And, of course,...
READ MORE
MEMBERS ONLY
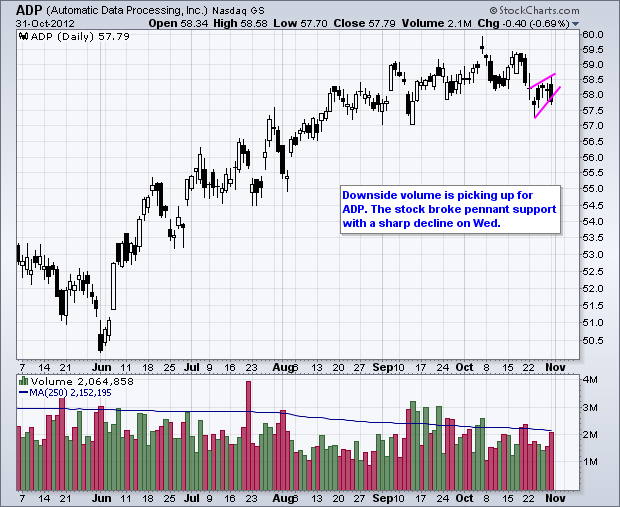
Charts of Interest: ADP, AEE, BDX, BWA, DUK, ESRX, JCP, PAYX
by Arthur Hill,
Chief Technical Strategist, TrendInvestorPro.com
ADP Breaks Pennant Support.
AEE Bounces off Support with Good Volume.
Plus BDX, BWA, DUK, ESRX, JCP, PAYX
This commentary and charts-of-interest are designed to stimulate thinking. This analysis is not a recommendation to buy, sell, hold or sell short any security (stock ETF or otherwise). We all need to...
READ MORE
MEMBERS ONLY
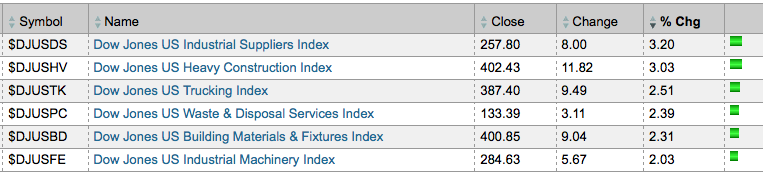
Building Materials, Industrial Suppliers and Construction Lead after Sandy
by Arthur Hill,
Chief Technical Strategist, TrendInvestorPro.com
A look at the Dow Jones industry groups shows strength coming from the DJ US Building and Fixtures Index ($DJUSBD), the DJ US Industrial Suppliers Index ($DJUSDS) and the DJ US Heavy Construction Index ($DJUSHV). These three groups, which are in the industrials sector, are likely benefitting from the rebuilding...
READ MORE
MEMBERS ONLY
Bombardier Triangulates with Expanding Volume
by Arthur Hill,
Chief Technical Strategist, TrendInvestorPro.com
Bombardier (BBD/B.TO) got a big surge in early September and then formed an extended triangle the last six weeks. Upside volume within the triangle is picking up as OBV moves higher in the indicator window. A triangle breakout would signal a continuation of the September surge.
Click this...
READ MORE
MEMBERS ONLY
TELUS Corp Makes a Breakout Bid
by Arthur Hill,
Chief Technical Strategist, TrendInvestorPro.com
TELUS Corp (T.TO) is showing signs of price strength with a channel breakout in late September and a surge over the last four days. This four day surge reinforces support in the 61-62 area. TELUS is on the verge of a breakout, but volume has been weak and has...
READ MORE
MEMBERS ONLY
SPY Consolidates in Downtrend - TLT Surges to Flag Resistance
by Arthur Hill,
Chief Technical Strategist, TrendInvestorPro.com
First, note that the NYSE and Nasdaq are closed on Monday because of hurricane Sandy. I am going to review some daily charts to offer a little more perspective today. After a rough start to the week, stocks managed to firm the last three days. Firmness is one thing. Buying...
READ MORE
MEMBERS ONLY
Three Bearish Engulfings Mark Resistance for ITB
by Arthur Hill,
Chief Technical Strategist, TrendInvestorPro.com
The uptrend in the Home Construction iShares (ITB) is stalling as three bearish engulfing patterns formed in the 26 area. ITB was poised to break resistance with a surge on Thursday, but failed to hold its gains and continued lower on Friday. The Sep-Oct lows mark key support.
Click this...
READ MORE
MEMBERS ONLY
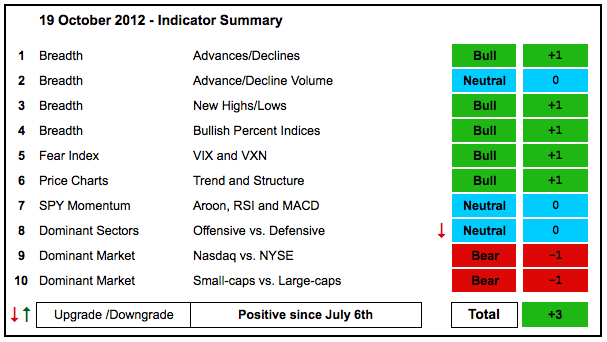
Split Market Turns Indicator Summary Neutral
by Arthur Hill,
Chief Technical Strategist, TrendInvestorPro.com
The indicator summary reflects the split nature of the stock market. The finance sector is strong, but the technology sector is weak, very weak. The consumer discretionary and industrials sectors are holding the line though. Much of the weakness stems from the Nasdaq and technology sector. The Nasdaq AD Volume...
READ MORE
MEMBERS ONLY
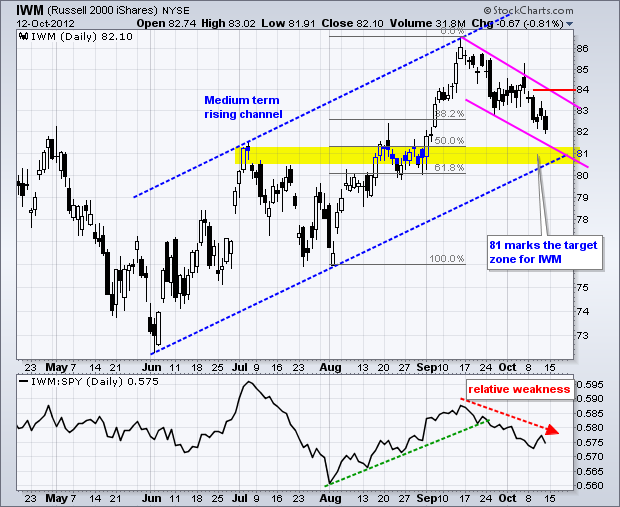
XLY Breaks Support - IWM Starts to Outperform
by Arthur Hill,
Chief Technical Strategist, TrendInvestorPro.com
Stocks managed to eek out small gains on Thursday as the Russell 2000 ETF (IWM) advanced .41% and the Nasdaq 100 Equal-Weight ETF (QQEW) added .52%. Note, however, that the Nasdaq 100 ETF (QQQ) closed down a fraction (.01%). Stocks were under selling pressure after the close as Amazon and...
READ MORE
MEMBERS ONLY
Nordstrom Tests Support as CCI Plunges
by Arthur Hill,
Chief Technical Strategist, TrendInvestorPro.com
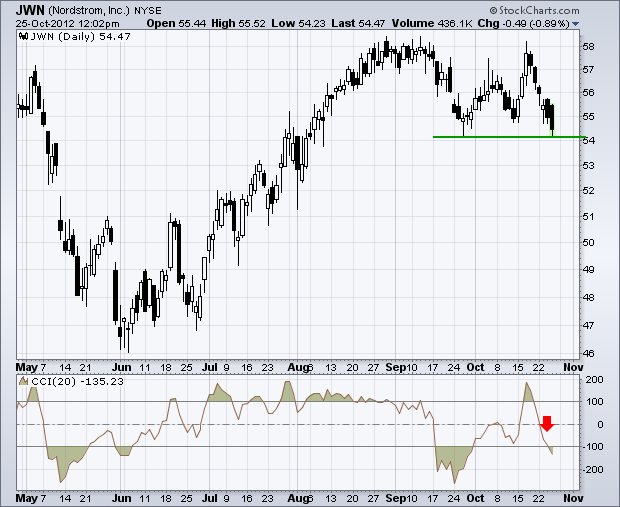
Nordstrom (JWN) surged last week, but gave back these gains with a sharp decline the last six days. JWN is now testing support from the late September low. Momentum abruptly shifted as well. Notice that CCI plunged below -100 and this may signal that a new downtrend is emerging for...
READ MORE
MEMBERS ONLY
UUP Hits Big Resistance - TLT Breaks Channel Support
by Arthur Hill,
Chief Technical Strategist, TrendInvestorPro.com
Stocks remained under pressure on Wednesday, but the losses were relatively muted. Techs were again under pressure with declines in the Semiconductor SPDR (XSD), Networking iShares (IGN) and FirstTrust Internet ETF (FDN). These three held up relatively well on Tuesday, but gave it all back on Wednesday. There has been...
READ MORE
MEMBERS ONLY
Charts of Interest: CHH, CTSH, F, IMAX, LXK
by Arthur Hill,
Chief Technical Strategist, TrendInvestorPro.com
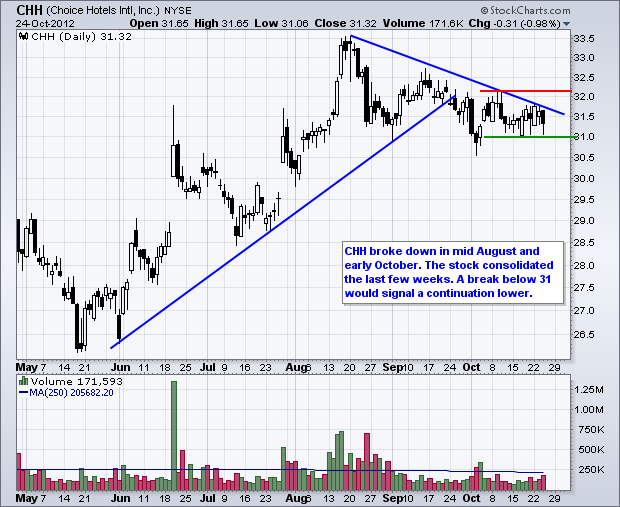
CHH Consolidates after Breakdown.
IMAX Forms Bull Flag after Surge.
Plus CTSH, F, LXK
This commentary and charts-of-interest are designed to stimulate thinking. This analysis is not a recommendation to buy, sell, hold or sell short any security (stock ETF or otherwise). We all need to think for ourselves when...
READ MORE
MEMBERS ONLY
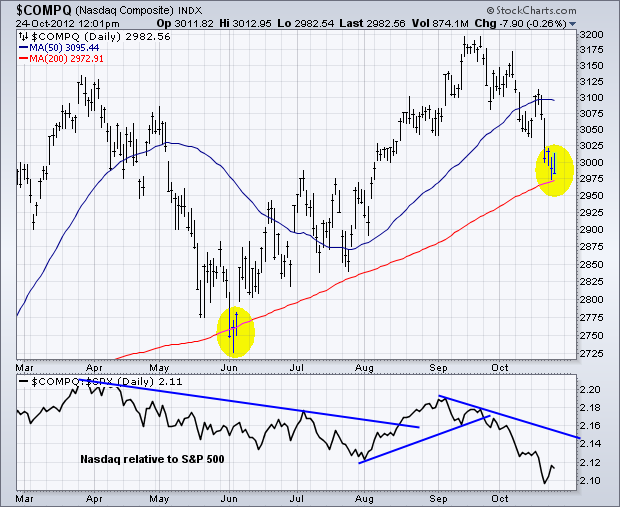
Nasdaq Tests 200-day Moving Average
by Arthur Hill,
Chief Technical Strategist, TrendInvestorPro.com
With a sharp decline the last five weeks, the Nasdaq is poised to test its rising 200-day moving average. The red line is the 200-day and this key average was last tested in early June. Note that the index is underperforming the S&P 500 as the price relative...
READ MORE
MEMBERS ONLY
IGN Hits Support Zone - UUP Challenges Resistance
by Arthur Hill,
Chief Technical Strategist, TrendInvestorPro.com
Stocks were hit with selling pressure on Tuesday, but there were some pockets of strength in the technology sector. The Dow Industrials SPDR (DIA) led the way lower with a 1.77% decline. The Russell 2000 ETF (IWM) held up the best with a .50% decline. Go figure. Materials stocks...
READ MORE
MEMBERS ONLY
Transports Buck the Selling Pressure with Gain
by Arthur Hill,
Chief Technical Strategist, TrendInvestorPro.com
The image below comes from a Major Indices Market Carpet. The Dow Industrials is getting hit hard, but the Dow Transports is holding up rather well thanks for strength in UPS. The Nasdaq 100 ($NDX) is also holding up rather well with gains coming from Yahoo and Virgin Media.
Click...
READ MORE
MEMBERS ONLY
SPY Gets Oversold Bounce as TLT Hits Resistance
by Arthur Hill,
Chief Technical Strategist, TrendInvestorPro.com
Stocks meandered around on Monday as trading turned quite mixed. The Nasdaq 100 ETF (QQQ) edged higher, while the S&P MidCap 400 SPDR (MDY) edged lower. Apple caught a bid ahead of its earnings report on Thursday. The sectors were also mixed with the Basic Materials SPDR (XLB)...
READ MORE
MEMBERS ONLY
Charts of Interest: COH, DAL, HAS, NKE, TSN
by Arthur Hill,
Chief Technical Strategist, TrendInvestorPro.com
Careful out there. It is earnings season.
CAH Forms Bear Flag after Breakdown
DAL Forms Pennant after Breakout.
Plus HAS, NKE, TSN
This commentary and charts-of-interest are designed to stimulate thinking. This analysis is not a recommendation to buy, sell, hold or sell short any security (stock ETF or otherwise)...
READ MORE
MEMBERS ONLY
XLY and SPY Poised for Big Support Tests
by Arthur Hill,
Chief Technical Strategist, TrendInvestorPro.com
It was another rough week for the stock market, especially tech stocks. Even though the S&P 500 ETF (SPY) remains within a consolidation pattern since mid September, the Nasdaq 100 ETF (QQQ) is in a clear downtrend with a 6+ percent decline from its mid September high. Relative...
READ MORE
MEMBERS ONLY
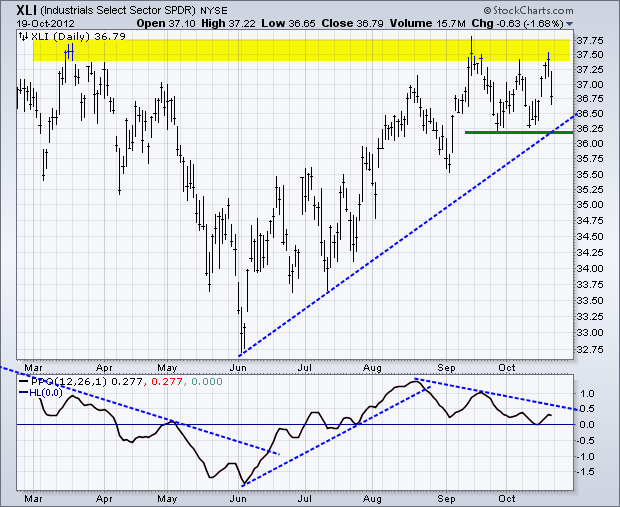
XLY and XLI Set Up Key Support Tests
by Arthur Hill,
Chief Technical Strategist, TrendInvestorPro.com
Weakness in the technology sector has been offset by strength in the finance sector since early September. This is why the S&P 500 is range bound the last five weeks and the Nasdaq is in a downtrend. With these two sectors cancelling each other out, chartists must turn...
READ MORE
MEMBERS ONLY
A Bearish MACD Crossover for OpenTable
by Arthur Hill,
Chief Technical Strategist, TrendInvestorPro.com
OpenTable (OPEN) shows signs of rolling over as a lower high takes shape and MACD moves below its signal line. Notice that OPEN hit resistance near the 61.80% retracement just above 46. MACD is barely in positive territory and this downturn puts it on the trajectory to turn negative....
READ MORE
MEMBERS ONLY
NYSE AD Line Offsets Weakness in Nasdaq AD Volume Line
by Arthur Hill,
Chief Technical Strategist, TrendInvestorPro.com
The indicator summary weakened a little big more because I downgraded SPY momentum to neutral. The market is clearly split with relative weakness in the technology weighing on the Nasdaq and relative strength in the finance sector helping the NYSE. In fact, the NYSE AD Line hit a new all...
READ MORE
MEMBERS ONLY
SPY Stalls Just Below Range Resistance
by Arthur Hill,
Chief Technical Strategist, TrendInvestorPro.com
Tech stocks got whacked again as Google and Microsoft came up short on their earnings reports. The trend in worse-than-expected earnings continues, especially for tech companies and especially for tech companies tied to the PC (Microsoft, Intel, AMD, Checkpoint, HP). The Technology SPDR (XLK) was already underperforming the broader market...
READ MORE
MEMBERS ONLY
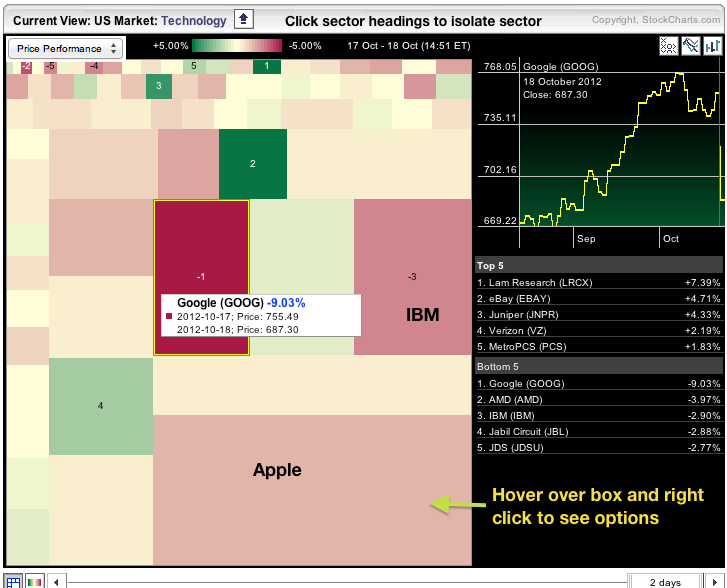
Big Red Boxes Fill the Market-Cap Sector Carpet
by Arthur Hill,
Chief Technical Strategist, TrendInvestorPro.com
Now wonder the Technology SPDR (XLK) is getting slammed. The image below shows the technology sector in market capitalization mode on the Sector Carpet. Three of the biggest boxes are red. Google (1) is down the most, Apple (2) is down almost 2% and IBM (3) is down almost 3%...
READ MORE
MEMBERS ONLY
Swinging from Risk Off to Risk On
by Arthur Hill,
Chief Technical Strategist, TrendInvestorPro.com
The markets moved from risk-off mode last week to risk-on mode this week. Perhaps the markets are like the weather. Don't like the trend? Wait a day or two and it will change. Trading has been quite volatile the last few weeks and we could see another mood...
READ MORE
MEMBERS ONLY
Charts of Interest: AA, HBAN, KO, MGM, MOS, POT, SYMC
by Arthur Hill,
Chief Technical Strategist, TrendInvestorPro.com
Careful out there. Earnings season is upon us.
AA Battle and Hold Support.
HBAN Surges within Consolidation.
Plus KO, MGM, MOS, POT, SYMC
This commentary and charts-of-interest are designed to stimulate thinking. This analysis is not a recommendation to buy, sell, hold or sell short any security (stock ETF or...
READ MORE
MEMBERS ONLY
SCTR Surges for First Solar and Dean Foods
by Arthur Hill,
Chief Technical Strategist, TrendInvestorPro.com
Chartists can use the StockCharts Technical Rank (SCTR) table on an intraday basis to find stocks making big moves. A sort of the "change" column shows First Solar and Dean Foods improving the most in early trading. Also notice that four financial stocks and three technology stocks are...
READ MORE
MEMBERS ONLY
XLB Breaks Resistance - TLT fails at Resistance
by Arthur Hill,
Chief Technical Strategist, TrendInvestorPro.com
Stocks extended their oversold bounce with the Nasdaq 100 ETF (QQQ) leading the way. QQQ was one of the hardest hit and subsequently got the biggest rebound. All sectors were up with Basic Materials SPDR (XLB) surging 2.4% on the day. Energy was also strong as the Energy SPDR...
READ MORE
MEMBERS ONLY
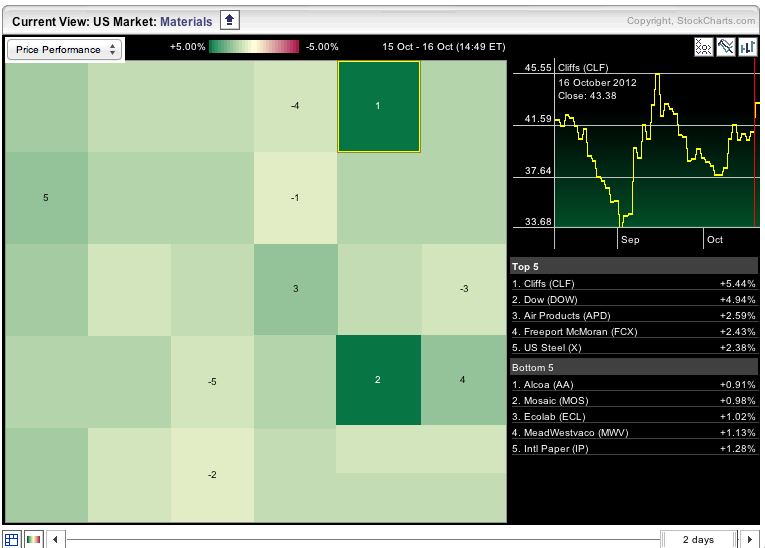
Sector Carpet Shows All Materials Stocks Gaining
by Arthur Hill,
Chief Technical Strategist, TrendInvestorPro.com
The Sector Market Carpet is a great way to find market leaders. Today, the Basic Materials SPDR (XLB) is the strongest sector with the average stock up around 1.9%. Drilling down into the sector shows all 30 components moving higher. Alcoa (AA) has the smallest gain (.91%) and Cliffs...
READ MORE
MEMBERS ONLY
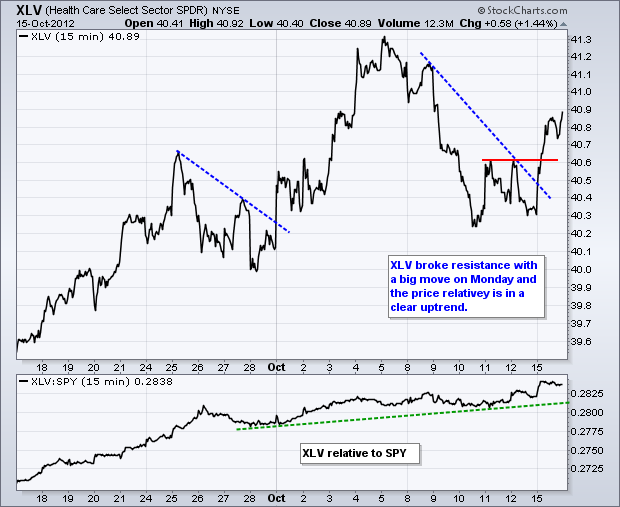
XLV and XLF Lead Oversold Bounce
by Arthur Hill,
Chief Technical Strategist, TrendInvestorPro.com
Stocks got an oversold bounce on Monday with the S&P MidCap 400 SPDR (MDY) leading the charge. Mid-caps occupy a certain sweet spot in the market because they are not too big and not too small. All nine sectors moved higher with the Healthcare SPDR (XLV) and Finance...
READ MORE
MEMBERS ONLY
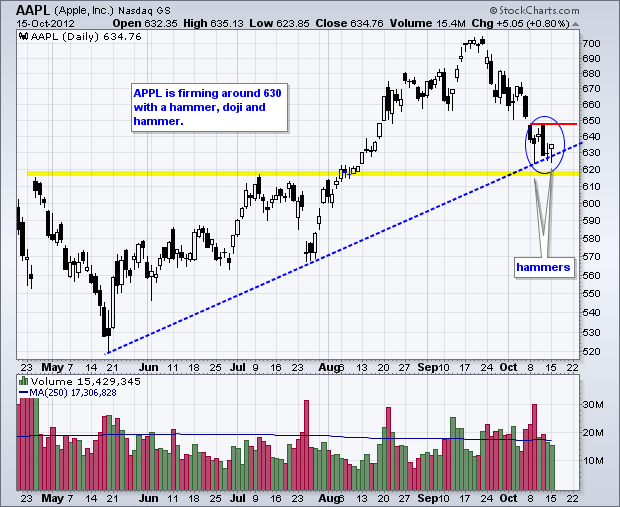
Charts of Interest: AAPL, GRMN, JBLU, PMTC, SRCL, TXN
by Arthur Hill,
Chief Technical Strategist, TrendInvestorPro.com
Careful out there. Earnings season is in full swing.
AAPL Forms Second Hammer.
TXN Gaps and Gains on High Volume.
Plus GRMN, JBLU, PMTC, SRCL.
This commentary and charts-of-interest are designed to stimulate thinking. This analysis is not a recommendation to buy, sell, hold or sell short any security (stock...
READ MORE
MEMBERS ONLY
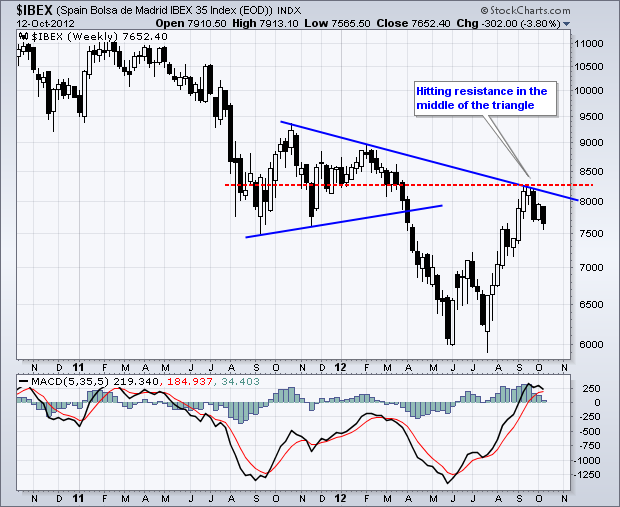
Spanish IBEX Hits Resistance in the Middle of Triangle
by Arthur Hill,
Chief Technical Strategist, TrendInvestorPro.com
The Spain Bolsa de Madrid IBEX 35 Index ($IBEX) surged from mid July to mid September and turned back the last three weeks. Despite a 30% bounce off the lows, the index is still in a bigger downtrend and resistance is nigh. The center of the prior triangle marks a...
READ MORE
MEMBERS ONLY
SPY Tests Support - USO Challenges Resistance
by Arthur Hill,
Chief Technical Strategist, TrendInvestorPro.com
Stocks moved lower last week with the S&P 500 ETF (SPY) falling over 2%, which was the steepest decline since May. The Nasdaq 100 ETF (QQQ) lost 3.33% as large techs really took it on the chin. The Consumer Discretionary SPDR (XLY) and Technology SPDR (XLK) led...
READ MORE
MEMBERS ONLY
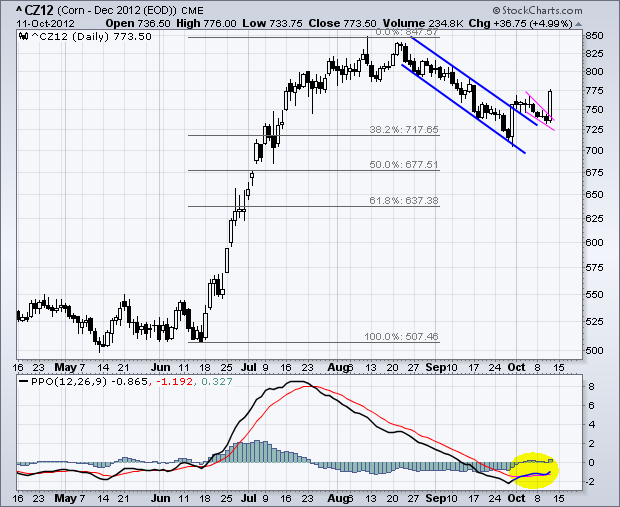
December Corn Makes a Break For It
by Arthur Hill,
Chief Technical Strategist, TrendInvestorPro.com
Corn surged during the summer drought news and then corrected as summer drew to a close. This correction appears to be ending as December Corn ($CZ12) broke channel resistance and the Percent Price Oscillator (PPO) turned up. This week's low now marks key support at 725.
Click this...
READ MORE
MEMBERS ONLY
Nasdaq and Techs Weigh on Indicator Summary
by Arthur Hill,
Chief Technical Strategist, TrendInvestorPro.com
The indicator summary remains positive overall, but there are clearly some bearish undercurrents at work. Namely, the Nasdaq and technology sector are underperforming and showing relative weakness. The $COMPQ:$NYA ratio broke down this past week and the Technology SPDR (XLK) is the weakest of the nine sectors over the...
READ MORE
MEMBERS ONLY
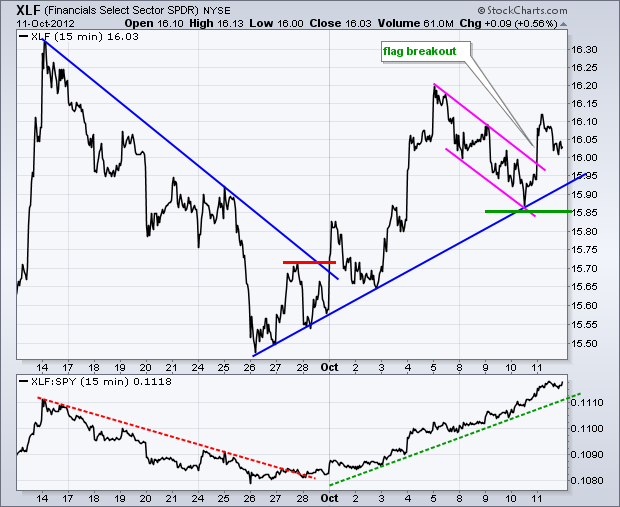
XLF Breaks Flag Resistance - SPY Fails to Hold Early Gains
by Arthur Hill,
Chief Technical Strategist, TrendInvestorPro.com
Stocks started the day strong, but selling pressure took hold and the market finished mixed. Just how mixed? The Nasdaq 100 ETF (QQQ) edged lower (-.31%), but the Nasdaq 100 Equal-Weight ETF (QQEW) edged higher (+.35%). The sectors were also mixed with six up and three down. The Technology...
READ MORE
MEMBERS ONLY
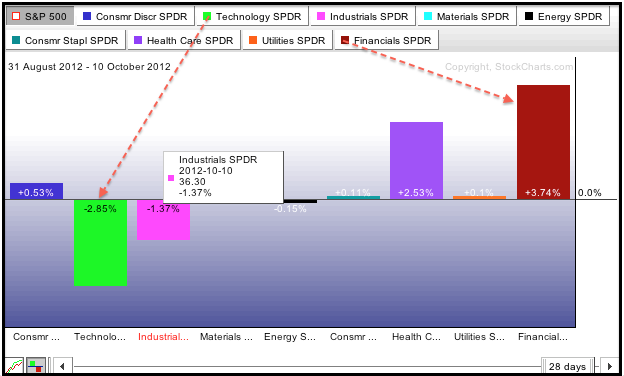
Sector PerfChart Shows Why the S&P 500 is so Mixed Up
by Arthur Hill,
Chief Technical Strategist, TrendInvestorPro.com
The Sector PerfChart shows the Finance SPDR (XLF) leading the S&P 500 since September and the Technology SPDR (XLK) lagging the S&P 500. These two sectors are by far the biggest sectors in the index. Moreover, this performance split explains the trading range in the S&...
READ MORE
MEMBERS ONLY
SPY Tests Support - USO Fails at Resistance
by Arthur Hill,
Chief Technical Strategist, TrendInvestorPro.com
Stocks took it on the chin again with more selling pressure on Wednesday. The declines were modest with the Dow Industrials SPDR (DIA) falling around 1% and the Russell 2000 ETF (IWM) falling just .16%. After a four day decline, stocks are getting short-term oversold and some of the major...
READ MORE
MEMBERS ONLY
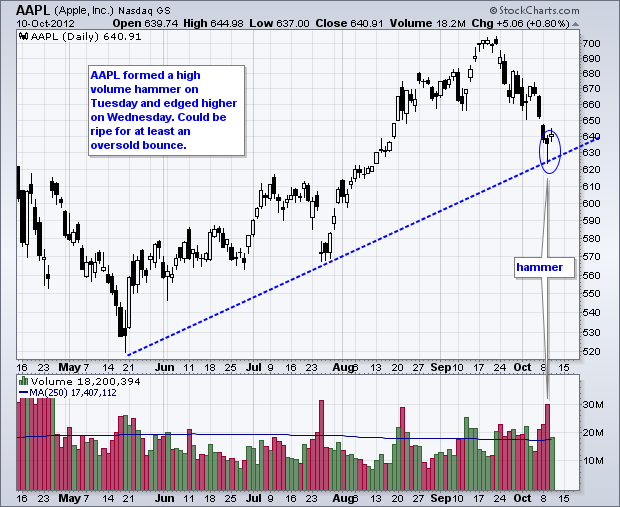
Charts of Interest: AAPL, AIV, AMT, BHP, CNL, LM, PEP
by Arthur Hill,
Chief Technical Strategist, TrendInvestorPro.com
Be careful with stocks about to report earnings.
AAPL Forms High Volume Hammer.
AIV Surges off Support with Good Volume.
Plus AMT, BHP, CNL, LM, PEP
This commentary and charts-of-interest are designed to stimulate thinking. This analysis is not a recommendation to buy, sell, hold or sell short any security...
READ MORE
MEMBERS ONLY
Finance Sector Shows Some Green on the Market Carpet
by Arthur Hill,
Chief Technical Strategist, TrendInvestorPro.com
The Sector Market Carpet is mostly red on Wednesday, but there are some pockets of strength. Overall, the finance is holding up the best and the energy sector is faring the worst. The consumer discretionary and materials sectors also show red and relative weakness on Wednesday.
Click this image for...
READ MORE