MEMBERS ONLY
NYSE AD Line Offsets Weakness in Nasdaq AD Volume Line
by Arthur Hill,
Chief Technical Strategist, TrendInvestorPro.com
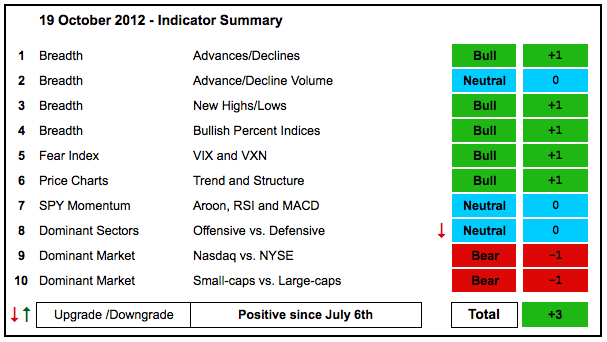
The indicator summary weakened a little big more because I downgraded SPY momentum to neutral. The market is clearly split with relative weakness in the technology weighing on the Nasdaq and relative strength in the finance sector helping the NYSE. In fact, the NYSE AD Line hit a new all...
READ MORE
MEMBERS ONLY
SPY Stalls Just Below Range Resistance
by Arthur Hill,
Chief Technical Strategist, TrendInvestorPro.com
Tech stocks got whacked again as Google and Microsoft came up short on their earnings reports. The trend in worse-than-expected earnings continues, especially for tech companies and especially for tech companies tied to the PC (Microsoft, Intel, AMD, Checkpoint, HP). The Technology SPDR (XLK) was already underperforming the...
READ MORE
MEMBERS ONLY
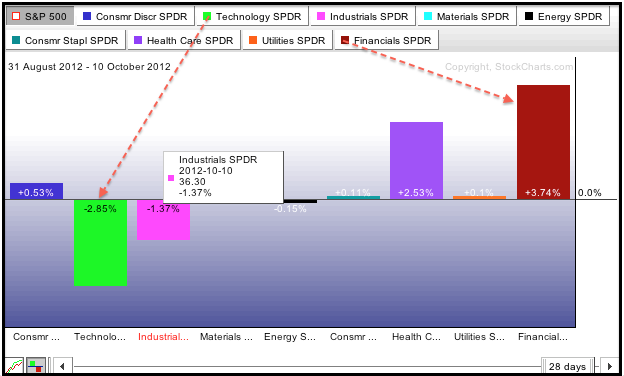
Big Red Boxes Fill the Market-Cap Sector Carpet
by Arthur Hill,
Chief Technical Strategist, TrendInvestorPro.com
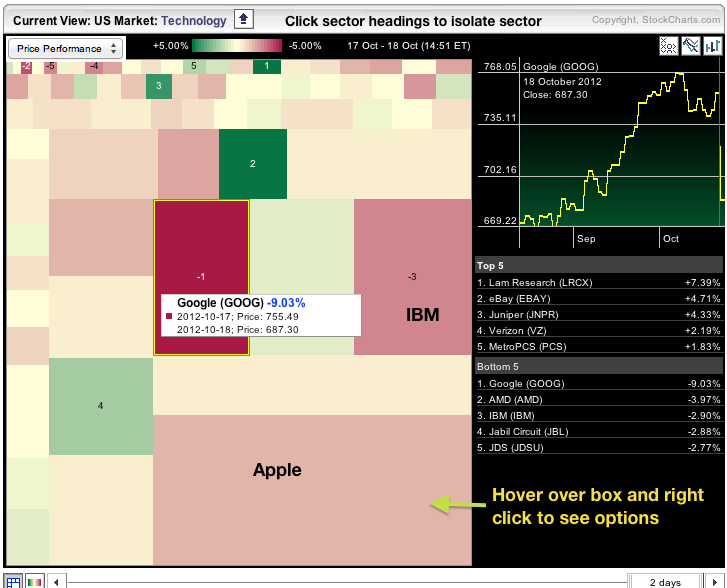
Now wonder the Technology SPDR (XLK) is getting slammed. The image below shows the technology sector in market capitalization mode on the Sector Carpet. Three of the biggest boxes are red. Google (1) is down the most, Apple (2) is down almost 2% and IBM (3) is down almost 3%...
READ MORE
MEMBERS ONLY
Swinging from Risk Off to Risk On
by Arthur Hill,
Chief Technical Strategist, TrendInvestorPro.com
The markets moved from risk-off mode last week to risk-on mode this week. Perhaps the markets are like the weather. Don't like the trend? Wait a day or two and it will change. Trading has been quite volatile the last few weeks and we could see...
READ MORE
MEMBERS ONLY
Charts of Interest: AA, HBAN, KO, MGM, MOS, POT, SYMC
by Arthur Hill,
Chief Technical Strategist, TrendInvestorPro.com
Careful out there. Earnings season is upon us.
AA Battle and Hold Support.
HBAN Surges within Consolidation.
Plus KO, MGM, MOS, POT, SYMC
This commentary and charts-of-interest are designed to stimulate thinking. This analysis is not a recommendation to buy, sell, hold or sell short any security (stock...
READ MORE
MEMBERS ONLY
SCTR Surges for First Solar and Dean Foods
by Arthur Hill,
Chief Technical Strategist, TrendInvestorPro.com
Chartists can use the StockCharts Technical Rank (SCTR) table on an intraday basis to find stocks making big moves. A sort of the "change" column shows First Solar and Dean Foods improving the most in early trading. Also notice that four financial stocks and three technology stocks are...
READ MORE
MEMBERS ONLY
XLB Breaks Resistance - TLT fails at Resistance
by Arthur Hill,
Chief Technical Strategist, TrendInvestorPro.com
Stocks extended their oversold bounce with the Nasdaq 100 ETF (QQQ) leading the way. QQQ was one of the hardest hit and subsequently got the biggest rebound. All sectors were up with Basic Materials SPDR (XLB) surging 2.4% on the day. Energy was also strong as the Energy SPDR...
READ MORE
MEMBERS ONLY
Sector Carpet Shows All Materials Stocks Gaining
by Arthur Hill,
Chief Technical Strategist, TrendInvestorPro.com
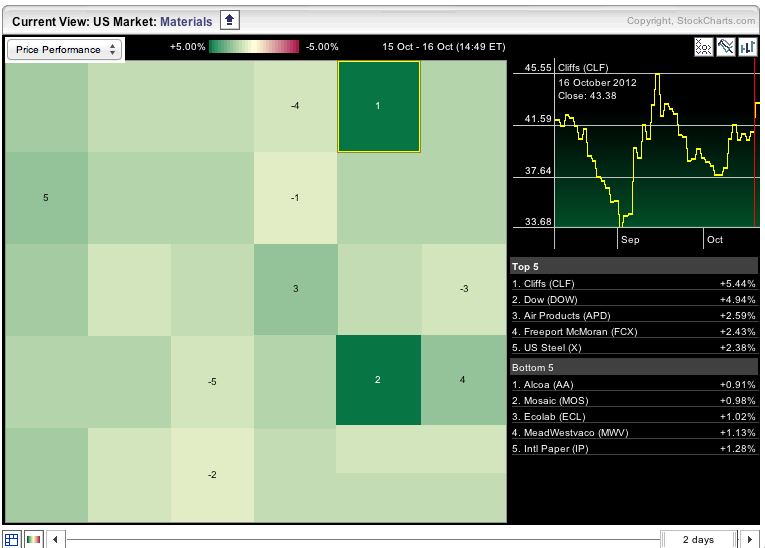
The Sector Market Carpet is a great way to find market leaders. Today, the Basic Materials SPDR (XLB) is the strongest sector with the average stock up around 1.9%. Drilling down into the sector shows all 30 components moving higher. Alcoa (AA) has the smallest gain (.91%) and Cliffs...
READ MORE
MEMBERS ONLY
XLV and XLF Lead Oversold Bounce
by Arthur Hill,
Chief Technical Strategist, TrendInvestorPro.com
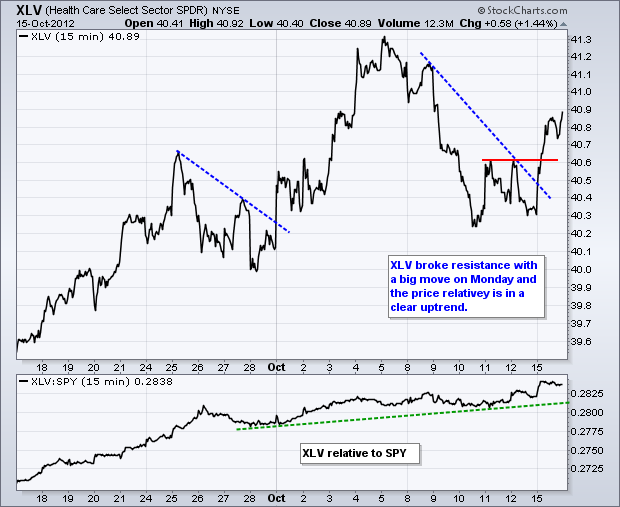
Stocks got an oversold bounce on Monday with the S&P MidCap 400 SPDR (MDY) leading the charge. Mid-caps occupy a certain sweet spot in the market because they are not too big and not too small. All nine sectors moved higher with the Healthcare SPDR (XLV) and...
READ MORE
MEMBERS ONLY
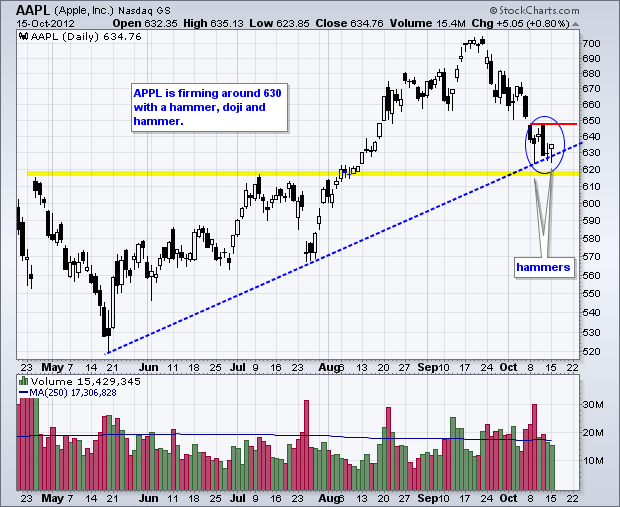
Charts of Interest: AAPL, GRMN, JBLU, PMTC, SRCL, TXN
by Arthur Hill,
Chief Technical Strategist, TrendInvestorPro.com
Careful out there. Earnings season is in full swing.
AAPL Forms Second Hammer.
TXN Gaps and Gains on High Volume.
Plus GRMN, JBLU, PMTC, SRCL.
This commentary and charts-of-interest are designed to stimulate thinking. This analysis is not a recommendation to buy, sell, hold or sell short any...
READ MORE
MEMBERS ONLY
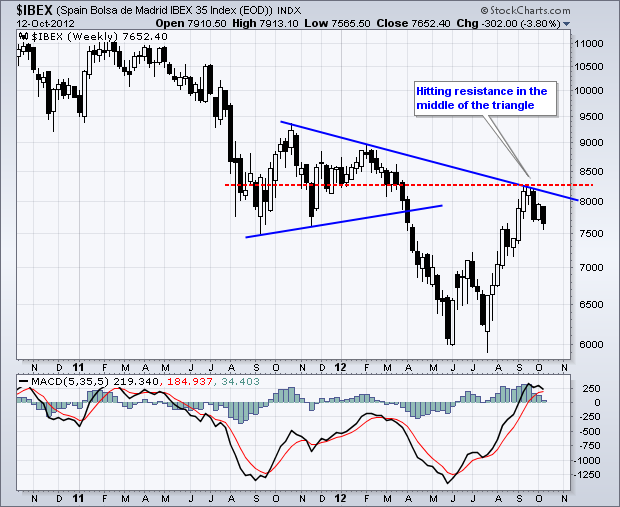
Spanish IBEX Hits Resistance in the Middle of Triangle
by Arthur Hill,
Chief Technical Strategist, TrendInvestorPro.com
The Spain Bolsa de Madrid IBEX 35 Index ($IBEX) surged from mid July to mid September and turned back the last three weeks. Despite a 30% bounce off the lows, the index is still in a bigger downtrend and resistance is nigh. The center of the prior triangle marks a...
READ MORE
MEMBERS ONLY
SPY Tests Support - USO Challenges Resistance
by Arthur Hill,
Chief Technical Strategist, TrendInvestorPro.com
Stocks moved lower last week with the S&P 500 ETF (SPY) falling over 2%, which was the steepest decline since May. The Nasdaq 100 ETF (QQQ) lost 3.33% as large techs really took it on the chin. The Consumer Discretionary SPDR (XLY) and Technology SPDR (XLK) led...
READ MORE
MEMBERS ONLY
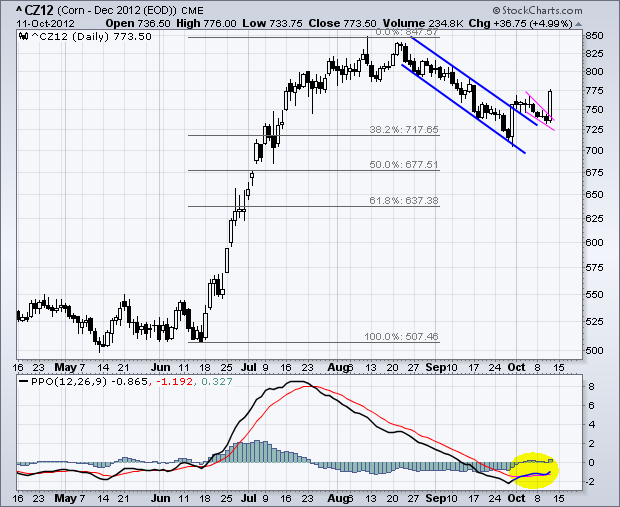
December Corn Makes a Break For It
by Arthur Hill,
Chief Technical Strategist, TrendInvestorPro.com
Corn surged during the summer drought news and then corrected as summer drew to a close. This correction appears to be ending as December Corn ($CZ12) broke channel resistance and the Percent Price Oscillator (PPO) turned up. This week's low now marks key support at 725.
Click this...
READ MORE
MEMBERS ONLY
Nasdaq and Techs Weigh on Indicator Summary
by Arthur Hill,
Chief Technical Strategist, TrendInvestorPro.com
The indicator summary remains positive overall, but there are clearly some bearish undercurrents at work. Namely, the Nasdaq and technology sector are underperforming and showing relative weakness. The $COMPQ:$NYA ratio broke down this past week and the Technology SPDR (XLK) is the weakest of the nine sectors over the...
READ MORE
MEMBERS ONLY
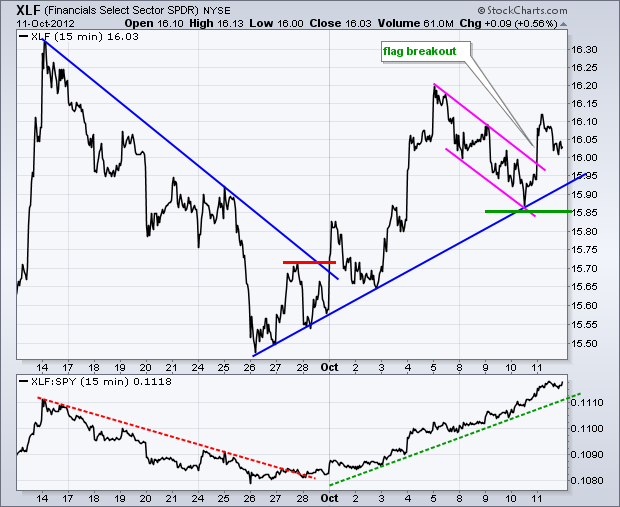
XLF Breaks Flag Resistance - SPY Fails to Hold Early Gains
by Arthur Hill,
Chief Technical Strategist, TrendInvestorPro.com
Stocks started the day strong, but selling pressure took hold and the market finished mixed. Just how mixed? The Nasdaq 100 ETF (QQQ) edged lower (-.31%), but the Nasdaq 100 Equal-Weight ETF (QQEW) edged higher (+.35%). The sectors were also mixed with six up and three down. The Technology...
READ MORE
MEMBERS ONLY
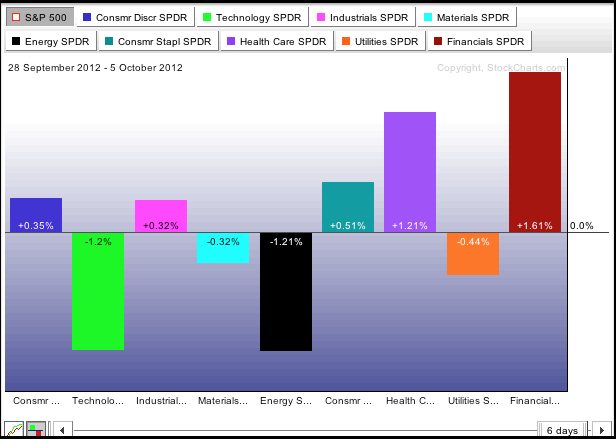
Sector PerfChart Shows Why the S&P 500 is so Mixed Up
by Arthur Hill,
Chief Technical Strategist, TrendInvestorPro.com
The Sector PerfChart shows the Finance SPDR (XLF) leading the S&P 500 since September and the Technology SPDR (XLK) lagging the S&P 500. These two sectors are by far the biggest sectors in the index. Moreover, this performance split explains the trading range in the S&...
READ MORE
MEMBERS ONLY
SPY Tests Support - USO Fails at Resistance
by Arthur Hill,
Chief Technical Strategist, TrendInvestorPro.com
Stocks took it on the chin again with more selling pressure on Wednesday. The declines were modest with the Dow Industrials SPDR (DIA) falling around 1% and the Russell 2000 ETF (IWM) falling just .16%. After a four day decline, stocks are getting short-term oversold and some of the...
READ MORE
MEMBERS ONLY
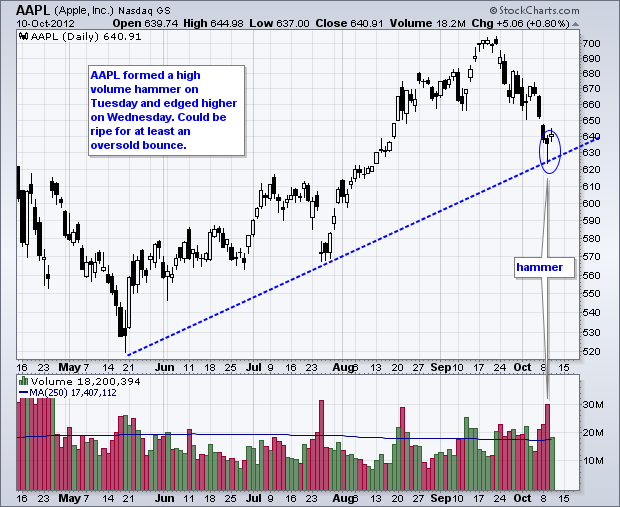
Charts of Interest: AAPL, AIV, AMT, BHP, CNL, LM, PEP
by Arthur Hill,
Chief Technical Strategist, TrendInvestorPro.com
Be careful with stocks about to report earnings.
AAPL Forms High Volume Hammer.
AIV Surges off Support with Good Volume.
Plus AMT, BHP, CNL, LM, PEP
This commentary and charts-of-interest are designed to stimulate thinking. This analysis is not a recommendation to buy, sell, hold or sell short...
READ MORE
MEMBERS ONLY
Finance Sector Shows Some Green on the Market Carpet
by Arthur Hill,
Chief Technical Strategist, TrendInvestorPro.com
The Sector Market Carpet is mostly red on Wednesday, but there are some pockets of strength. Overall, the finance is holding up the best and the energy sector is faring the worst. The consumer discretionary and materials sectors also show red and relative weakness on Wednesday.
Click this image for...
READ MORE
MEMBERS ONLY
IWM Breaks Flag Support - USO Surges towards Resistance
by Arthur Hill,
Chief Technical Strategist, TrendInvestorPro.com
Stocks got smacked hard on Tuesday with the Nasdaq 100 ETF (QQQ) again leading the way down. The Russell 2000 ETF (IWM) was also relatively weak with a 1.17% decline on the day. Eight of the nine sectors were lower with the Consumer Discretionary SPDR (XLY) falling the most....
READ MORE
MEMBERS ONLY
Russell 2000 Tests 50-day SMA
by Arthur Hill,
Chief Technical Strategist, TrendInvestorPro.com
The Russell 2000 ($RUT) is leading the market lower and closing in on its rising 50-day simple moving average. Broken resistance from the May-August highs also marks potential support in the 820-830 area. Small-caps ($RUT) are leading the market lower since mid September.
Click this image...
READ MORE
MEMBERS ONLY
SPY Holds Breakout - QQQ Tests Support and Underperforms
by Arthur Hill,
Chief Technical Strategist, TrendInvestorPro.com
Stocks edged lower with the Apple-laden Nasdaq 100 ETF (QQQ) leading the way (-.95%). The Russell 2000 ETF (IWM) was also relatively weak with a .63% decline on the day. Seven of the nine sectors were lower with the Technology SPDR (XLK) falling over 1%. The Energy SPDR (XLE)...
READ MORE
MEMBERS ONLY
Charts: ADI, AKS, ANF, CLF, NUE, RHT, SO, VALE, YUM
by Arthur Hill,
Chief Technical Strategist, TrendInvestorPro.com
ADI Gaps Below Wedge Support.
VALE Bounces off Key Retracement with Big Volume.
Plus AKS, ANF, CLF, NUE, PMTC, RHT, SO, YUM
This commentary and charts-of-interest are designed to stimulate thinking. This analysis is not a recommendation to buy, sell, hold or sell short any security (stock ETF...
READ MORE
MEMBERS ONLY
FirstTrust Internet ETF Hits Resistance from Shooting Star
by Arthur Hill,
Chief Technical Strategist, TrendInvestorPro.com
The FirstTrust Internet ETF (FDN) peaked in mid September with a shooting star candlestick. After dipping below 37.50, the ETF bounced back to this peak and formed a bearish engulfing last week. These two affirm resistance at 39. A break below 38 would confirm the bearish engulfing pattern.
Click...
READ MORE
MEMBERS ONLY
XLK Underperforms as QQQ Forms Bear Flag
by Arthur Hill,
Chief Technical Strategist, TrendInvestorPro.com
It was a fairly good week for the bulls. The S&P 500 ETF (SPY) and Dow Industrials SPDR (DIA) gained around 1.5%. The Finance SPDR (XLF) led the way with a 3% gain. The Consumer Discretionary SPDR (XLY) and the Industrials SPDR (XLI) also performed well with...
READ MORE
MEMBERS ONLY
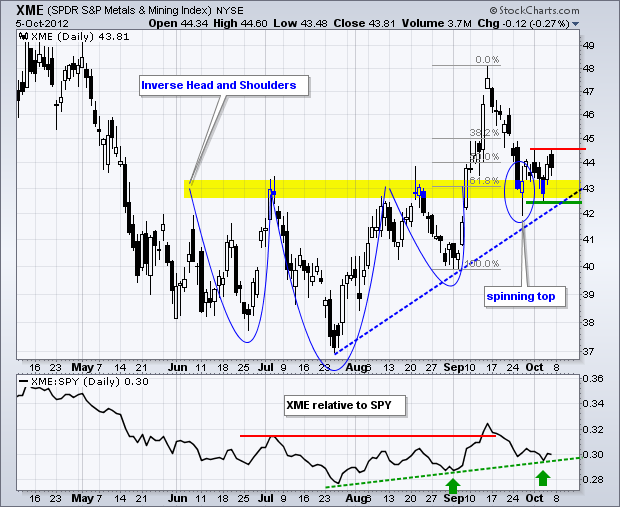
Metals and Mining SPDR Battles Breakout
by Arthur Hill,
Chief Technical Strategist, TrendInvestorPro.com
The Metals & Mining SPDR (XME) is battling to hold its resistance breakout. XME broke resistance with a big surge in early September and broken resistance turns into first support in the 43 area. This is a classic tenet of technical analysis: broken resistance turns support. A spinning top formed...
READ MORE
MEMBERS ONLY
QQQ Turns Into Underperformer
by Arthur Hill,
Chief Technical Strategist, TrendInvestorPro.com
The Nasdaq 100 ETF (QQQ) is up since late August, but the price relative is down. The price relative is the QQQ:SPY ratio, which measures relative performance. This ratio peaked in late August and moved sharply lower the last 5-6 weeks. This means QQQ is underperforming the broader...
READ MORE
MEMBERS ONLY
Breadth Remains Bullish, But Small-Caps Show Weakness
by Arthur Hill,
Chief Technical Strategist, TrendInvestorPro.com
The bulk of the evidence remains bullish, but there were two downgrades based on relative weakness in the technology sector. The offensive sectors are split with the consumer discretionary and finance sectors showing relative strength, but the technology and industrials sectors showing relative weakness. By extension, Nasdaq performance has been...
READ MORE
MEMBERS ONLY
MDY Breaks Resistance - UUP Breaks Channel Support
by Arthur Hill,
Chief Technical Strategist, TrendInvestorPro.com
The markets moved to risk-on mode on Thursday as stocks edged higher, treasuries fell, oil surged around 5%, the Dollar fell and the Euro rose. And now for the employment report. The major index ETFs moved modestly higher with the S&P MidCap 400 SPDR (MDY) leading the...
READ MORE
MEMBERS ONLY
Finance and Energy Sectors See Green on Market Carpet
by Arthur Hill,
Chief Technical Strategist, TrendInvestorPro.com
The Sector Market Carpet shows the Energy SPDR (XLE) and the Finance SPDR (XLF) with the most green. The average energy stock is up 1.6% and the average finance stock is up 1.1%. XLE is getting an oversold bounce after Wednesday's decline. XLF is poised for...
READ MORE
MEMBERS ONLY
The Moment-of-Truth for SPY - XRT Forms Harami
by Arthur Hill,
Chief Technical Strategist, TrendInvestorPro.com
I get the feeling that this market does not want to go down. As with late August, the major index ETFs underwent a mild correction the last three weeks. There was a sharp decline last week, but selling pressure dried up and stocks firmed the last three days. Chartists should...
READ MORE
MEMBERS ONLY
Charts of Interest: AKAM, HAS, ISRG, SNDK, SYMC
by Arthur Hill,
Chief Technical Strategist, TrendInvestorPro.com
AKAM Forms Bullish Flag.
SYMC Falls to Support on High Volume.
Plus HAS, ISRG, SNDK
This commentary and charts-of-interest are designed to stimulate thinking. This analysis is not a recommendation to buy, sell, hold or sell short any security (stock ETF or otherwise). We all need to think...
READ MORE
MEMBERS ONLY
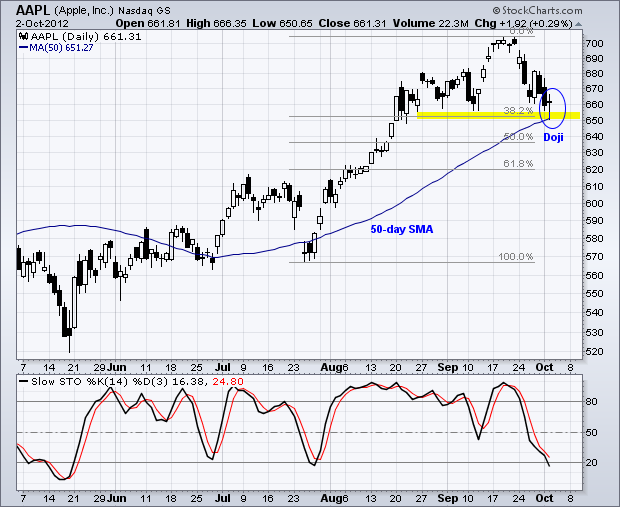
Apple Forms Doji at 50-day SMA
by Arthur Hill,
Chief Technical Strategist, TrendInvestorPro.com
After hitting a new high above 700 in mid September, Apple (AAPL) gapped down and declined to around 660. Three items mark support in this area. The early September low, the 38.2% retracement and the rising 50-day moving average. With a doji signaling indecision and the Stochastic Oscillator...
READ MORE
MEMBERS ONLY
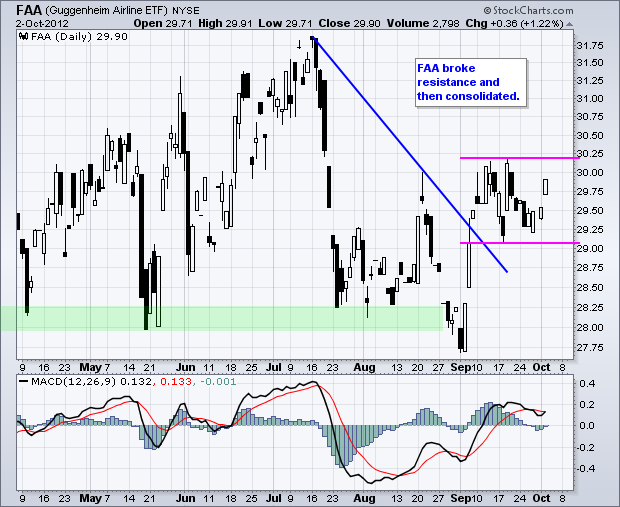
Airlines Get a Lift - SPY Remains with Bear Flag
by Arthur Hill,
Chief Technical Strategist, TrendInvestorPro.com
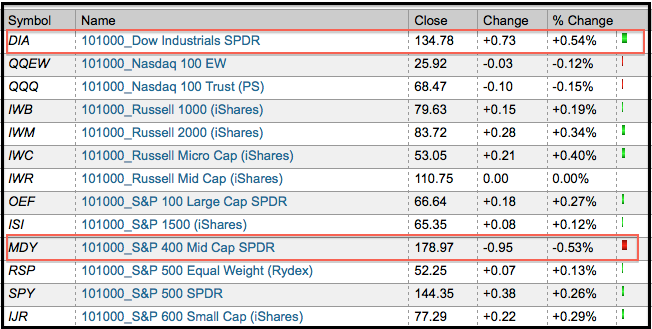
Strange, and indecisive days, continued as the Dow Industrials SPDR (DIA) edged lower and the S&P MidCap 400 SPDR (MDY) edged higher. Stocks were about as mixed as can be on Tuesday. Six of the nine sectors were up, but the biggest gain was just .52% from the...
READ MORE
MEMBERS ONLY
Semis Continue to Lag - IWM Forms Rising Wedge
by Arthur Hill,
Chief Technical Strategist, TrendInvestorPro.com
Monday was a strange day indeed. Stocks were truly mixed with the Dow Industrials SPDR (DIA) advancing around 1/2% and the S&P MidCap 400 SPDR (MDY) declining the same amount. It is definitely a strange day when two relatively broad indices move in opposite directions. There were...
READ MORE
MEMBERS ONLY
Charts: BIDU, CHKP, FAST, LXK, MAT, PCP, SWY
by Arthur Hill,
Chief Technical Strategist, TrendInvestorPro.com
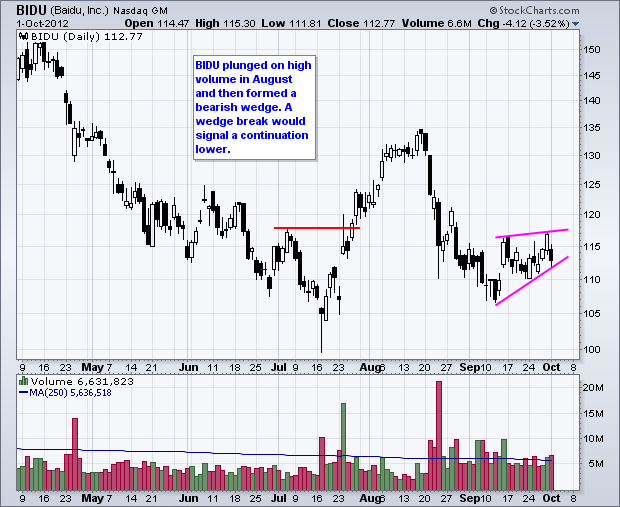
BIDU Forms Bearish Wedge.
CHKP Shows Relative Weakness as Downside Volume Increases.
Plus FAST, LXK, MAT, PCP, SWY
This commentary and charts-of-interest are designed to stimulate thinking. This analysis is not a recommendation to buy, sell, hold or sell short any security (stock ETF or otherwise). We all...
READ MORE
MEMBERS ONLY
Agribusiness ETF Surges and Breaks Flag Resistance
by Arthur Hill,
Chief Technical Strategist, TrendInvestorPro.com
The Agribusiness ETF (MOO) surged over the last three days and broke falling flag resistance. The flag breakout is bullish as long as it holds. Broken resistance and the June trend line mark support at 50.50. The corn and wheat funds are shown in the indicator window for reference....
READ MORE
MEMBERS ONLY
Strength in Dollar and Treasuries Weighs on Stocks
by Arthur Hill,
Chief Technical Strategist, TrendInvestorPro.com
Strength in the Dollar and US Treasuries remains a negative for the stock market. Even though these uptrends are still relatively short, continued strength in the Dollar and Treasuries would weigh further on stocks. The chart below shows five intermarket securities with a black dotted line on 14-Sep. This...
READ MORE
MEMBERS ONLY
Mind the Gap on Cisco
by Arthur Hill,
Chief Technical Strategist, TrendInvestorPro.com
After a corrective decline the last few weeks, Cisco (CSCO) firmed on Wednesday with a small hammer and then surged above the wedge trend line with a gap on Friday. The gap-breakout is bullish until proven otherwise with a decline back below 18.25
Click this image for a...
READ MORE
MEMBERS ONLY
Evidence Remains Positive after Pullback in Stock Market
by Arthur Hill,
Chief Technical Strategist, TrendInvestorPro.com
There is no change in the indicator summary, but the market is looking a bit tired and perhaps ripe for a correction or consolidation period. The Nasdaq AD Volume Line did not come close to its spring high and the NYSE AD Volume Line hit resistance from its spring high....
READ MORE