MEMBERS ONLY
IWM Breaks Flag Support - USO Surges towards Resistance
by Arthur Hill,
Chief Technical Strategist, TrendInvestorPro.com
Stocks got smacked hard on Tuesday with the Nasdaq 100 ETF (QQQ) again leading the way down. The Russell 2000 ETF (IWM) was also relatively weak with a 1.17% decline on the day. Eight of the nine sectors were lower with the Consumer Discretionary SPDR (XLY) falling the most....
READ MORE
MEMBERS ONLY
Russell 2000 Tests 50-day SMA
by Arthur Hill,
Chief Technical Strategist, TrendInvestorPro.com
The Russell 2000 ($RUT) is leading the market lower and closing in on its rising 50-day simple moving average. Broken resistance from the May-August highs also marks potential support in the 820-830 area. Small-caps ($RUT) are leading the market lower since mid September.
Click this image for a live chart....
READ MORE
MEMBERS ONLY
SPY Holds Breakout - QQQ Tests Support and Underperforms
by Arthur Hill,
Chief Technical Strategist, TrendInvestorPro.com
Stocks edged lower with the Apple-laden Nasdaq 100 ETF (QQQ) leading the way (-.95%). The Russell 2000 ETF (IWM) was also relatively weak with a .63% decline on the day. Seven of the nine sectors were lower with the Technology SPDR (XLK) falling over 1%. The Energy SPDR (XLE)...
READ MORE
MEMBERS ONLY
Charts: ADI, AKS, ANF, CLF, NUE, RHT, SO, VALE, YUM
by Arthur Hill,
Chief Technical Strategist, TrendInvestorPro.com
ADI Gaps Below Wedge Support.
VALE Bounces off Key Retracement with Big Volume.
Plus AKS, ANF, CLF, NUE, PMTC, RHT, SO, YUM
This commentary and charts-of-interest are designed to stimulate thinking. This analysis is not a recommendation to buy, sell, hold or sell short any security (stock ETF or otherwise)...
READ MORE
MEMBERS ONLY
FirstTrust Internet ETF Hits Resistance from Shooting Star
by Arthur Hill,
Chief Technical Strategist, TrendInvestorPro.com
The FirstTrust Internet ETF (FDN) peaked in mid September with a shooting star candlestick. After dipping below 37.50, the ETF bounced back to this peak and formed a bearish engulfing last week. These two affirm resistance at 39. A break below 38 would confirm the bearish engulfing pattern.
Click...
READ MORE
MEMBERS ONLY
XLK Underperforms as QQQ Forms Bear Flag
by Arthur Hill,
Chief Technical Strategist, TrendInvestorPro.com
It was a fairly good week for the bulls. The S&P 500 ETF (SPY) and Dow Industrials SPDR (DIA) gained around 1.5%. The Finance SPDR (XLF) led the way with a 3% gain. The Consumer Discretionary SPDR (XLY) and the Industrials SPDR (XLI) also performed well with...
READ MORE
MEMBERS ONLY
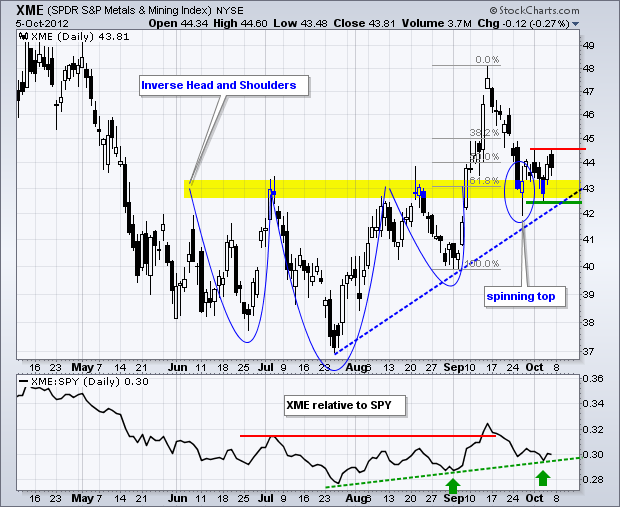
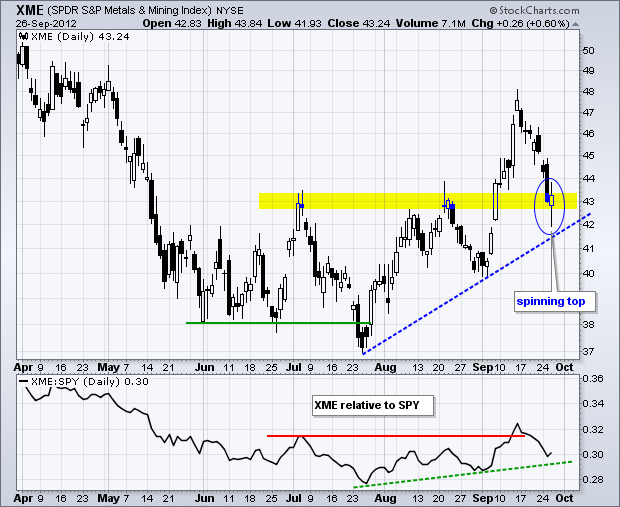
Metals and Mining SPDR Battles Breakout
by Arthur Hill,
Chief Technical Strategist, TrendInvestorPro.com
The Metals & Mining SPDR (XME) is battling to hold its resistance breakout. XME broke resistance with a big surge in early September and broken resistance turns into first support in the 43 area. This is a classic tenet of technical analysis: broken resistance turns support. A spinning top formed...
READ MORE
MEMBERS ONLY
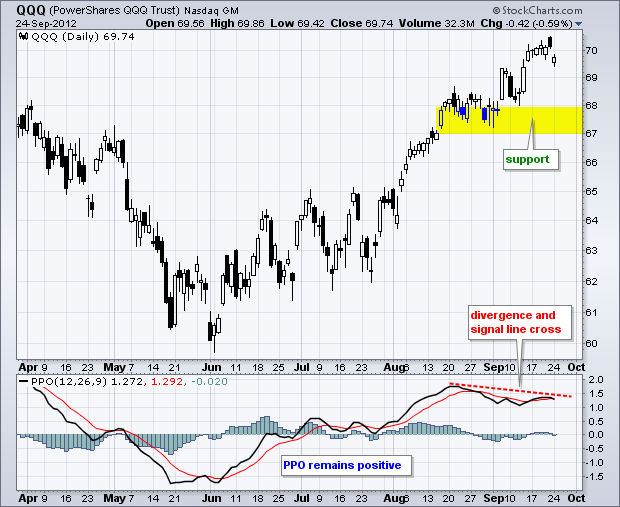
QQQ Turns Into Underperformer
by Arthur Hill,
Chief Technical Strategist, TrendInvestorPro.com
The Nasdaq 100 ETF (QQQ) is up since late August, but the price relative is down. The price relative is the QQQ:SPY ratio, which measures relative performance. This ratio peaked in late August and moved sharply lower the last 5-6 weeks. This means QQQ is underperforming the broader market....
READ MORE
MEMBERS ONLY
Breadth Remains Bullish, But Small-Caps Show Weakness
by Arthur Hill,
Chief Technical Strategist, TrendInvestorPro.com
The bulk of the evidence remains bullish, but there were two downgrades based on relative weakness in the technology sector. The offensive sectors are split with the consumer discretionary and finance sectors showing relative strength, but the technology and industrials sectors showing relative weakness. By extension, Nasdaq performance has been...
READ MORE
MEMBERS ONLY
MDY Breaks Resistance - UUP Breaks Channel Support
by Arthur Hill,
Chief Technical Strategist, TrendInvestorPro.com
The markets moved to risk-on mode on Thursday as stocks edged higher, treasuries fell, oil surged around 5%, the Dollar fell and the Euro rose. And now for the employment report. The major index ETFs moved modestly higher with the S&P MidCap 400 SPDR (MDY) leading the way...
READ MORE
MEMBERS ONLY
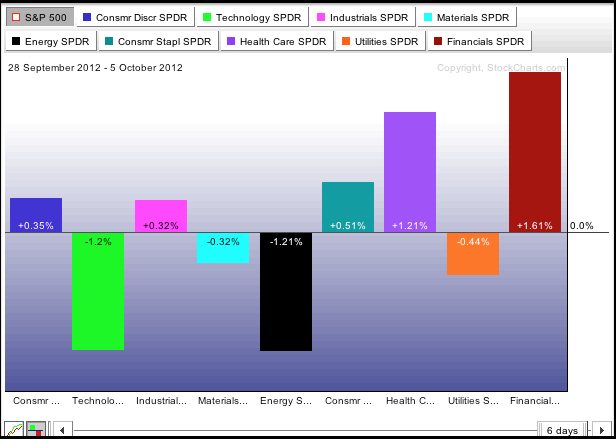
Finance and Energy Sectors See Green on Market Carpet
by Arthur Hill,
Chief Technical Strategist, TrendInvestorPro.com
The Sector Market Carpet shows the Energy SPDR (XLE) and the Finance SPDR (XLF) with the most green. The average energy stock is up 1.6% and the average finance stock is up 1.1%. XLE is getting an oversold bounce after Wednesday's decline. XLF is poised for...
READ MORE
MEMBERS ONLY
The Moment-of-Truth for SPY - XRT Forms Harami
by Arthur Hill,
Chief Technical Strategist, TrendInvestorPro.com
I get the feeling that this market does not want to go down. As with late August, the major index ETFs underwent a mild correction the last three weeks. There was a sharp decline last week, but selling pressure dried up and stocks firmed the last three days. Chartists should...
READ MORE
MEMBERS ONLY
Charts of Interest: AKAM, HAS, ISRG, SNDK, SYMC
by Arthur Hill,
Chief Technical Strategist, TrendInvestorPro.com
AKAM Forms Bullish Flag.
SYMC Falls to Support on High Volume.
Plus HAS, ISRG, SNDK
This commentary and charts-of-interest are designed to stimulate thinking. This analysis is not a recommendation to buy, sell, hold or sell short any security (stock ETF or otherwise). We all need to think for ourselves...
READ MORE
MEMBERS ONLY
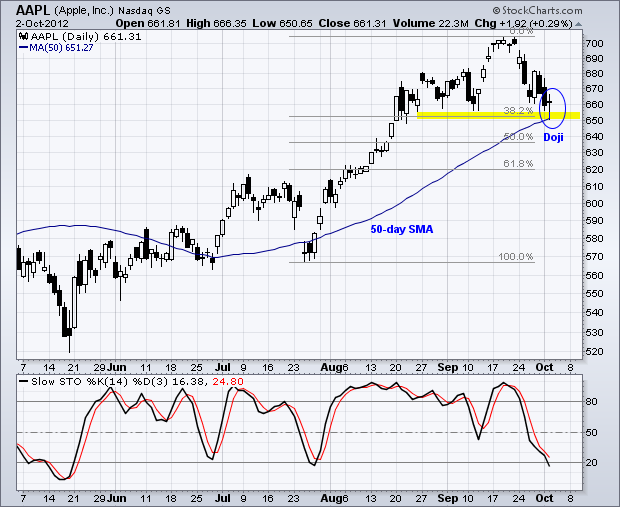
Apple Forms Doji at 50-day SMA
by Arthur Hill,
Chief Technical Strategist, TrendInvestorPro.com
After hitting a new high above 700 in mid September, Apple (AAPL) gapped down and declined to around 660. Three items mark support in this area. The early September low, the 38.2% retracement and the rising 50-day moving average. With a doji signaling indecision and the Stochastic Oscillator turning...
READ MORE
MEMBERS ONLY
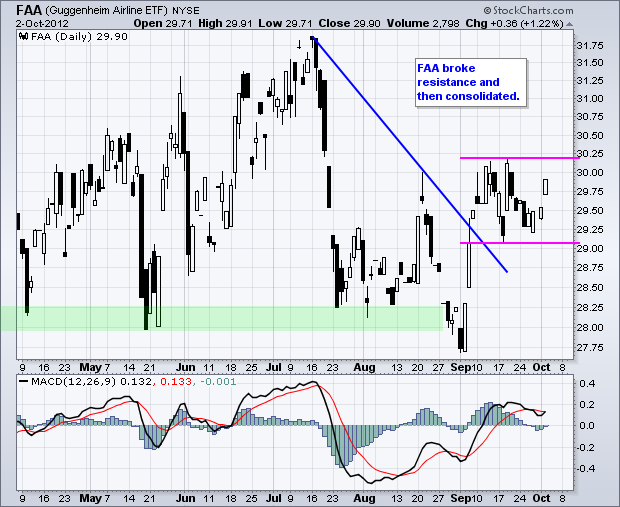
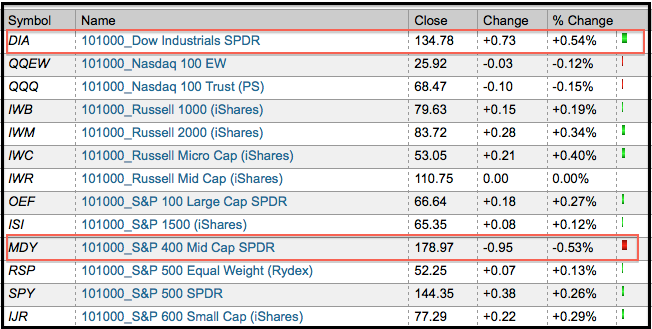
Airlines Get a Lift - SPY Remains with Bear Flag
by Arthur Hill,
Chief Technical Strategist, TrendInvestorPro.com
Strange, and indecisive days, continued as the Dow Industrials SPDR (DIA) edged lower and the S&P MidCap 400 SPDR (MDY) edged higher. Stocks were about as mixed as can be on Tuesday. Six of the nine sectors were up, but the biggest gain was just .52% from the...
READ MORE
MEMBERS ONLY
Semis Continue to Lag - IWM Forms Rising Wedge
by Arthur Hill,
Chief Technical Strategist, TrendInvestorPro.com
Monday was a strange day indeed. Stocks were truly mixed with the Dow Industrials SPDR (DIA) advancing around 1/2% and the S&P MidCap 400 SPDR (MDY) declining the same amount. It is definitely a strange day when two relatively broad indices move in opposite directions. There were...
READ MORE
MEMBERS ONLY
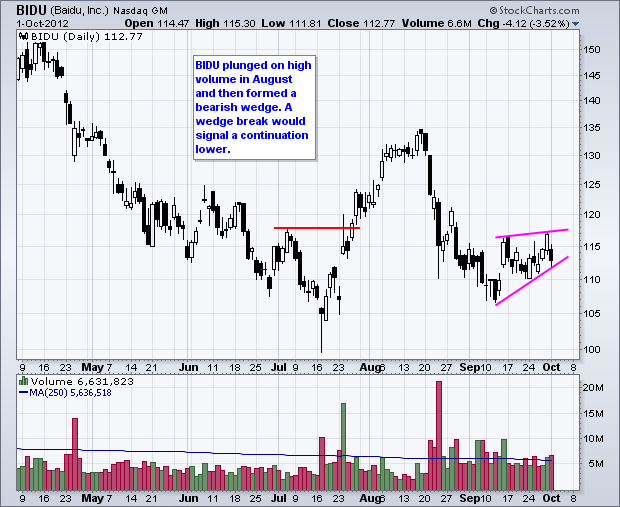
Charts: BIDU, CHKP, FAST, LXK, MAT, PCP, SWY
by Arthur Hill,
Chief Technical Strategist, TrendInvestorPro.com
BIDU Forms Bearish Wedge.
CHKP Shows Relative Weakness as Downside Volume Increases.
Plus FAST, LXK, MAT, PCP, SWY
This commentary and charts-of-interest are designed to stimulate thinking. This analysis is not a recommendation to buy, sell, hold or sell short any security (stock ETF or otherwise). We all need to...
READ MORE
MEMBERS ONLY
Agribusiness ETF Surges and Breaks Flag Resistance
by Arthur Hill,
Chief Technical Strategist, TrendInvestorPro.com
The Agribusiness ETF (MOO) surged over the last three days and broke falling flag resistance. The flag breakout is bullish as long as it holds. Broken resistance and the June trend line mark support at 50.50. The corn and wheat funds are shown in the indicator window for reference....
READ MORE
MEMBERS ONLY
Strength in Dollar and Treasuries Weighs on Stocks
by Arthur Hill,
Chief Technical Strategist, TrendInvestorPro.com
Strength in the Dollar and US Treasuries remains a negative for the stock market. Even though these uptrends are still relatively short, continued strength in the Dollar and Treasuries would weigh further on stocks. The chart below shows five intermarket securities with a black dotted line on 14-Sep. This date...
READ MORE
MEMBERS ONLY
Mind the Gap on Cisco
by Arthur Hill,
Chief Technical Strategist, TrendInvestorPro.com
After a corrective decline the last few weeks, Cisco (CSCO) firmed on Wednesday with a small hammer and then surged above the wedge trend line with a gap on Friday. The gap-breakout is bullish until proven otherwise with a decline back below 18.25
Click this image for a live...
READ MORE
MEMBERS ONLY
Evidence Remains Positive after Pullback in Stock Market
by Arthur Hill,
Chief Technical Strategist, TrendInvestorPro.com
There is no change in the indicator summary, but the market is looking a bit tired and perhaps ripe for a correction or consolidation period. The Nasdaq AD Volume Line did not come close to its spring high and the NYSE AD Volume Line hit resistance from its spring high....
READ MORE
MEMBERS ONLY
SPY Bounces off Short-Term Support - GLD Surges
by Arthur Hill,
Chief Technical Strategist, TrendInvestorPro.com
Stocks rebounded across the board with the hardest hit groups getting the biggest pops. The Nasdaq 100 ETF (QQQ) led the way with a 1.38% bounce. Eight of nine sectors were up with energy leading the way on the heels of a big oversold bounce in crude. The utilities...
READ MORE
MEMBERS ONLY
PC Related Stocks are Having a Tough Time on the PerfChart
by Arthur Hill,
Chief Technical Strategist, TrendInvestorPro.com
The PerfChart below shows three month performance for two chip makers (Intel and AMD), two PC-related companies (Dell and Hewlett Packard) and mister softy (Microsoft). Only Microsoft is up during this period, and just barely. The others are having a really difficult time, even with the S&P 500...
READ MORE
MEMBERS ONLY
SPY Tests Short-Term Support as IWM Breaks Support
by Arthur Hill,
Chief Technical Strategist, TrendInvestorPro.com
Stocks continued lower with modest losses in the major index ETFs. The Nasdaq 100 ETF (QQQ) led the way lower with a .81% decline. Eight of nine sectors moved lower with energy and technology leading the way. The defensive sectors held up the best with the utilities sector providing the...
READ MORE
MEMBERS ONLY
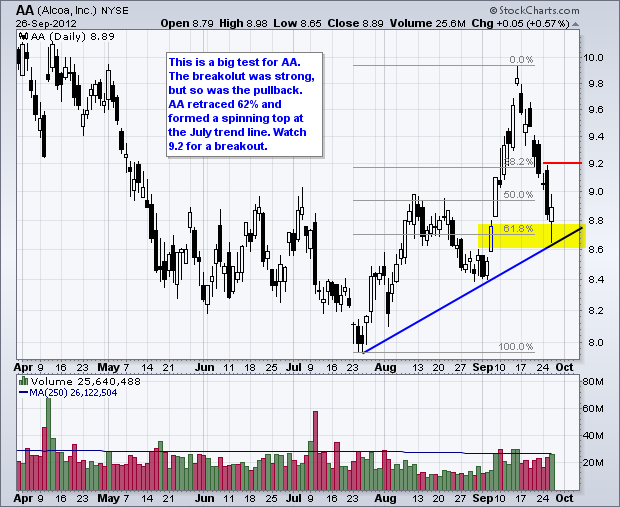
Charts of Interest: AA, AMX, DLTR, MMM, MSFT, NVDA
by Arthur Hill,
Chief Technical Strategist, TrendInvestorPro.com
AA Returns to Breakout for Big Test.
AMX Firms with Good Upside Volume.
Plus DLTR, MMM, MSFT, NVDA
This commentary and charts-of-interest are designed to stimulate thinking. This analysis is not a recommendation to buy, sell, hold or sell short any security (stock ETF or otherwise). We all need to...
READ MORE
MEMBERS ONLY
Metals & Mining SPDR Forms Spinning Top At Broken Resistance
by Arthur Hill,
Chief Technical Strategist, TrendInvestorPro.com
The battle for the breakout is on as the Metals & Mining SPDR (XME) declined to broken resistance and formed a big spinning top. These candlesticks show serious indecision. XME broke resistance in early September and is now trying to decide if this breakout is worth holding or not. Watch...
READ MORE
MEMBERS ONLY
IWM and QQQ Start to Lead Lower - TLT Extends Uptrend
by Arthur Hill,
Chief Technical Strategist, TrendInvestorPro.com
Stocks ended their meandering ways with some downside direction on Tuesday. The Nasdaq 100 ETF (QQQ) and Russell 2000 ETF (IWM) led the way lower with losses around 1.4%. All nine sectors were lower with the Technology SPDR (XLK) and Finance SPDR (XLF) leading the way. The defensive sectors...
READ MORE
MEMBERS ONLY
Gold Miners Junior forms Gap-Doji-Gap Reversal
by Arthur Hill,
Chief Technical Strategist, TrendInvestorPro.com
After a big run from late July to mid September, the Junior Gold Miners ETF (GDXJ) formed a bearish candlestick reversal over the last 4-5 days. First, there was the gap and doji. This signaled sudden indecision after a big jump. Second, selling pressure followed this indecision as the ETF...
READ MORE
MEMBERS ONLY
QQQ Gaps Down - TLT Holds Short-Term Uptrend
by Arthur Hill,
Chief Technical Strategist, TrendInvestorPro.com
Stocks continued their meandering ways on Monday. There is, however, a slight downward slant in this meandering. IWM and SPY peaked on 14-Sept and worked their way lower the last six days. QQQ, which marches to the Apple beat, is trading below the 14-Sep levels, but has been exceptionally volatile...
READ MORE
MEMBERS ONLY
Charts: ADM, APOL, CMS, CNL, TE, TEVA, TYC, WCRX, XRAY
by Arthur Hill,
Chief Technical Strategist, TrendInvestorPro.com
AMAT Breaks Support with Gap.
TE Surges on Good Volume.
Plus ADM, APOL, CMS, CNL, TEVA, TYC, WCRX, XRAY
This commentary and charts-of-interest are designed to stimulate thinking. This analysis is not a recommendation to buy, sell, hold or sell short any security (stock ETF or otherwise). We all need...
READ MORE
MEMBERS ONLY
SPY Forms Bearish Meeting Lines Candlestick Pattern
by Arthur Hill,
Chief Technical Strategist, TrendInvestorPro.com
The S&P 500 ETF (SPY) formed a rare bearish candlestick reversal pattern over the last two days. The Bearish Meeting Lines pattern forms with a white candlestick and a black candlestick that have relatively equal closes. In particular, the black candlestick reflects a strong open and a weak...
READ MORE
MEMBERS ONLY
SPY Extends Stall as USO Breaks Down
by Arthur Hill,
Chief Technical Strategist, TrendInvestorPro.com
Last week was the week that was not. Stocks surged on Thursday, September 13th, and then stalled the next six days. This indecisive period started as SPY formed a shooting start on Friday, September 14th. The ETF formed small candlesticks on Monday, Tuesday and Wednesday. Thursday's open was...
READ MORE
MEMBERS ONLY
Dow Transports Tests Major Support Level and Dow Theory
by Arthur Hill,
Chief Technical Strategist, TrendInvestorPro.com
The Dow Transports surged to resistance last week and plunged to support this week. Overall, the junior Average has been stuck in a trading range since mid June with support at 4900 and resistance around 5250. A break below 4900 would be clearly bearish for the Average and negative for...
READ MORE
MEMBERS ONLY
Indicator Summary Remains Positive as Stocks Stall
by Arthur Hill,
Chief Technical Strategist, TrendInvestorPro.com
With new highs last week and flat trading this week, there is no change in the indicator summary. Even though the bulk of the evidence remains bullish, I am concerned with overbought conditions and some extremes starting to appear in the sentiment indicators. The $VIX moved below 15% and the...
READ MORE
MEMBERS ONLY
SMH Breaks Flag Support - GLD Forms Pennant
by Arthur Hill,
Chief Technical Strategist, TrendInvestorPro.com
Thursday marked the fourth uneventful day this week as stocks finished mixed yet again. The Dow Industrials SPDR (DIA) and S&P 100 ETF (OEF) edged higher, but the Russell 2000 ETF (IWM) and S&P MidCap SPDR (MDY) closed modestly lower. In fact, we have definitely seen...
READ MORE
MEMBERS ONLY
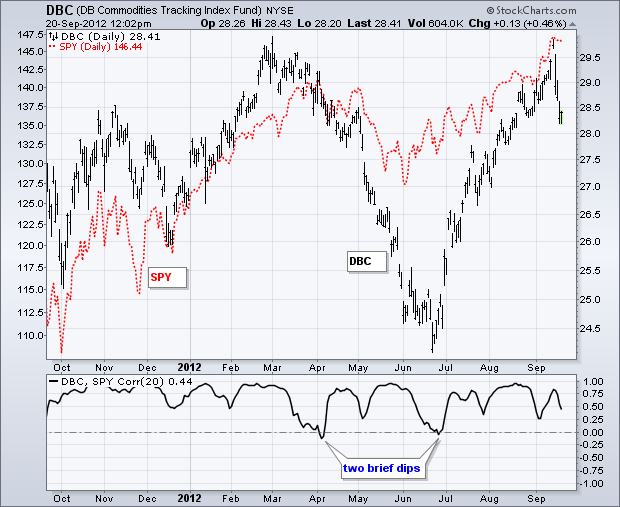
Stocks and Commodities Show Strong Positive Correlation
by Arthur Hill,
Chief Technical Strategist, TrendInvestorPro.com
The S&P 500 ETF (SPY) and the Commodity Index Fund ($DBC) have been positively correlated for almost all of the last 12 months. As the indicator window shows, the Correlation Coefficient (SPY,DBC) dipped into negative territory only twice and spent most of the time above .50. The...
READ MORE
MEMBERS ONLY
SPY Stumbles after Flag Break - USO Breaks Support
by Arthur Hill,
Chief Technical Strategist, TrendInvestorPro.com
Stocks finished the day mixed on Wednesday as indecision extended for the third day running. The Russell 2000 ETF (IWM) edged lower, while the S&P 500 ETF (SPY) closed fractionally higher. The sectors were mixed with six up and three down. The Consumer Discretionary SPDR (XLY) led the...
READ MORE
MEMBERS ONLY
Charts of Interest: BOOM, CIEN, DAN, INTU, NKE
by Arthur Hill,
Chief Technical Strategist, TrendInvestorPro.com
The Noose Narrows for BOOM.
Downside Volume Expands for NKE.
Plus CIEN, DAN, INTU
This commentary and charts-of-interest are designed to stimulate thinking. This analysis is not a recommendation to buy, sell, hold or sell short any security (stock ETF or otherwise). We all need to think for ourselves when...
READ MORE
MEMBERS ONLY
Oversold XLU Triggers Triple Bottom Breakdown on P&F Chart
by Arthur Hill,
Chief Technical Strategist, TrendInvestorPro.com
The Utilities SPDR (XLU) is by far the weakest of the nine sector SPDRs right now. The P&F chart below uses daily price data and each box is valued at .30%. The ETF broke the Bullish Support Line in August, consolidated and then broke below the prior two...
READ MORE
MEMBERS ONLY
SPY Forms Falling Flag - GLD Consolidates at High Level
by Arthur Hill,
Chief Technical Strategist, TrendInvestorPro.com
The stock index ETFs continued to drift on Tuesday. After the surge from Thursday afternoon to Friday morning, stocks have been drifting for almost three days. Such a drift is not uncommon after a big move. These consolidations give the market time to digest its gains and provide the bulls...
READ MORE