MEMBERS ONLY
Charts: CERN, CTXS, FFIV, IMN, JDSU, LIFE, UEC, UPS
by Arthur Hill,
Chief Technical Strategist, TrendInvestorPro.com
CTXS Forms Flag at Key Retracement.
UPS Hits Resistance in Retracement Zone.
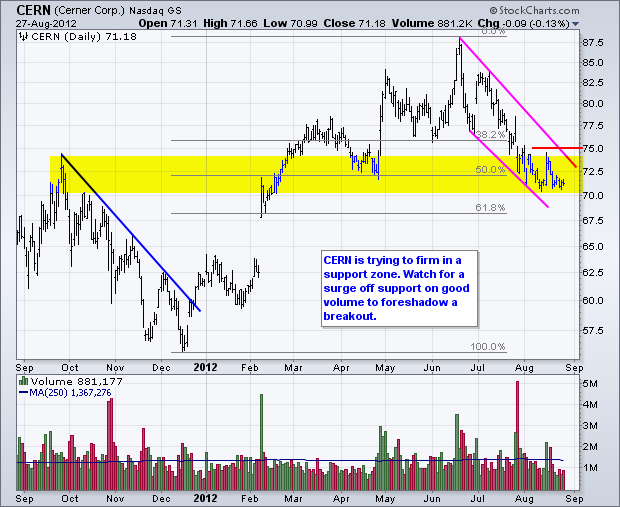
Plus CERN, FFIV, IMN, JDSU, LIFE, UEC
This commentary and charts-of-interest are designed to stimulate thinking. This analysis is not a recommendation to buy, sell, hold or sell short any security (stock ETF or otherwise). We all need...
READ MORE
MEMBERS ONLY
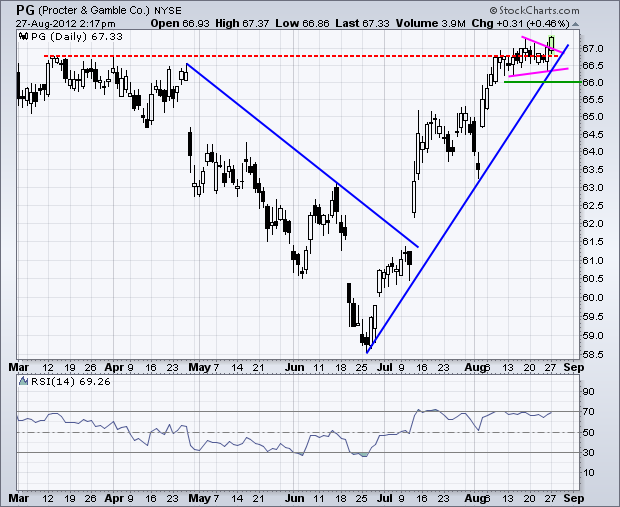
Procter & Gamble Hits New High to Lead Consumer Staples
by Arthur Hill,
Chief Technical Strategist, TrendInvestorPro.com
Procter & Gamble (PG), the biggest component in the Consumer Staples SPDR (XLP), surged above pennant resistance and recorded a 52-week high on Monday. The stock is medium-term overbought after a huge advance the last 10 weeks, but remains in a clear uptrend with first support at 66.
Click this...
READ MORE
MEMBERS ONLY
Shanghai Composite Hit New Low as SPX hits New High
by Arthur Hill,
Chief Technical Strategist, TrendInvestorPro.com
Comments from Fed chairman Bernanke boosted stocks on Friday as the major index ETFs closed with modest gains. Despite Friday's bounce, the major index ETFs closed lower for the week. This is not surprising because stocks were overbought to start the week and a few indices hit new...
READ MORE
MEMBERS ONLY
StockCharts Technical Rank Hits 2012 Low for Intel
by Arthur Hill,
Chief Technical Strategist, TrendInvestorPro.com
Index was hit hard over the last three days and is poised to test its May-June-July lows. The price relative and SCTR were hit even harder as both broke below their July lows. These two confirm relative weakness in this key semiconductor stock. With an SCTR score of 19.3,...
READ MORE
MEMBERS ONLY
Nasdaq AD Volume Line Forms Lower High
by Arthur Hill,
Chief Technical Strategist, TrendInvestorPro.com
Stockspulled back this week, but the bigger trends remain up and the bulk of the evidence still favors the bulls. Three days of weakness does not a trend change make, especially when stocks were overbought to start the week. The NYSE AD Line remains in an uptrend, Net New Highs...
READ MORE
MEMBERS ONLY
Stocks Extend Correction as Dollar Becomes Very Oversold
by Arthur Hill,
Chief Technical Strategist, TrendInvestorPro.com
Stocks extended their correction with modest losses in the major index ETFs on Thursday. The Rydex S&P 500 Equal Weight ETF (RSP) led the way lower with a .91% loss. All sectors were down with the Basic Materials SPDR (XLB) and the Energy SPDR (XLE) pacing the losses....
READ MORE
MEMBERS ONLY
CRB Index Breaks above 200-day Day SMA
by Arthur Hill,
Chief Technical Strategist, TrendInvestorPro.com
The CRB Index ($CRB) is breaking above its 200-day moving average after two failed attempts. Since first breaking below the 200-day in August 2011, this level marked resistance in early September and late February. With this week's move above 305, the index broke the 200-day and exceeded the...
READ MORE
MEMBERS ONLY
XLB Holds Breakout - TLT Breaks Resistance on Fed Surge
by Arthur Hill,
Chief Technical Strategist, TrendInvestorPro.com
Stocks went on a wild ride Wednesday and finished the day mixed. Selling pressure dominated the morning, but hints of QE3 brought out the buyers in the afternoon. The Nasdaq 100 ETF (QQQ) led the advancers with a .41% gain, while the Russell 2000 ETF (IWM) led the decliners with...
READ MORE
MEMBERS ONLY
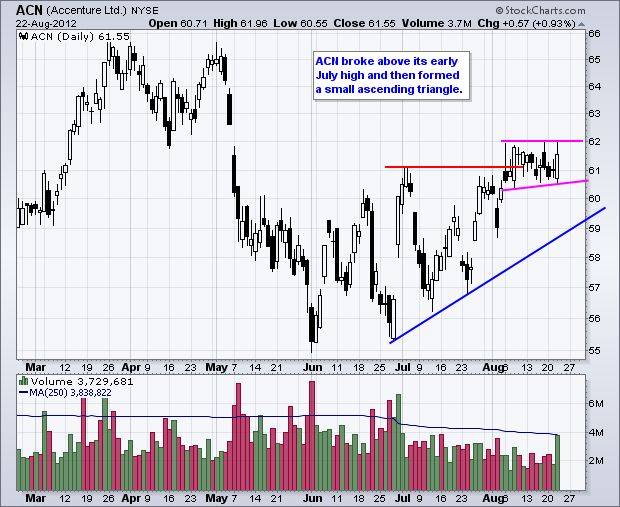
Charts of Interest: ACN, ACI, CHK, INTU, MRO, WFT
by Arthur Hill,
Chief Technical Strategist, TrendInvestorPro.com
ACN Forms Small Ascending Triangle Near Resistance.
MRO Surges on Big Volume.
Plus ACI, CHK, MRO and WFT
This commentary and charts-of-interest are designed to stimulate thinking. This analysis is not a recommendation to buy, sell, hold or sell short any security (stock ETF or otherwise). We all need to...
READ MORE
MEMBERS ONLY
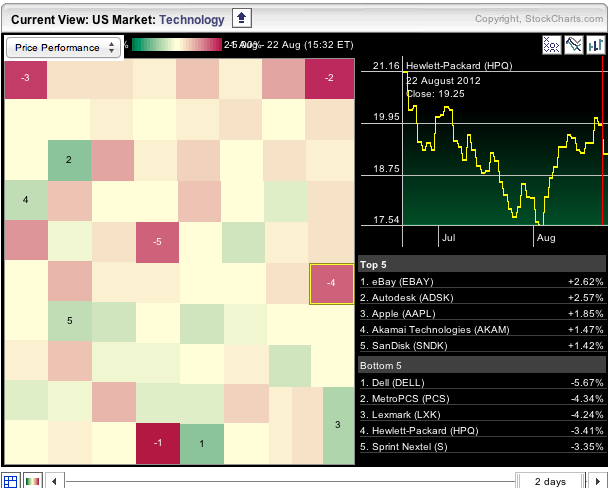
Dell and HP Weigh on Techs in Sector Carpet
by Arthur Hill,
Chief Technical Strategist, TrendInvestorPro.com
The S&P Sector Carpet is tilting towards the red (decliners) as Dell, Hewlett Packard and Lexmark weigh. Some of this weakness is being offset by strength in Ebay, Apple and Sandisk. Chartists can click on the squares to see the individual chart in the right corner.
Click here...
READ MORE
MEMBERS ONLY
DIA Forms Bearish Engulfing - GLD Breaks Resistance
by Arthur Hill,
Chief Technical Strategist, TrendInvestorPro.com
With the old pop and drop on Tuesday, a number of bearish engulfing patterns formed on the price charts. DIA, QQQ and SPY all formed bearish engulfing patterns. With stocks overbought to begin the week, these bearish engulfing patterns could foreshadow a short-term consolidation or pullback. Keep in mind that...
READ MORE
MEMBERS ONLY
QQQ Forms Bearish Engulfing at Resistance
by Arthur Hill,
Chief Technical Strategist, TrendInvestorPro.com
With a strong open and sharp decline during the day, the Nasdaq 100 ETF (QQQ) has a bearish engulfing pattern working on Tuesday. In fact, the intraday scan for bearish engulfing patterns is quite full (165) an hour before the close. The bearish engulfing for QQQ confirms resistance and could...
READ MORE
MEMBERS ONLY
SPY Holds Gains as XLF Edges Higher
by Arthur Hill,
Chief Technical Strategist, TrendInvestorPro.com
Stocks came under selling pressure from profit taking and renewed concerns in the Eurozone. Given the advance of the last few weeks, a little consolidation or even a correction would be normal. The major index ETFs finished slightly lower. Seven of the nine sectors were slightly lower. The Healthcare SPDR...
READ MORE
MEMBERS ONLY
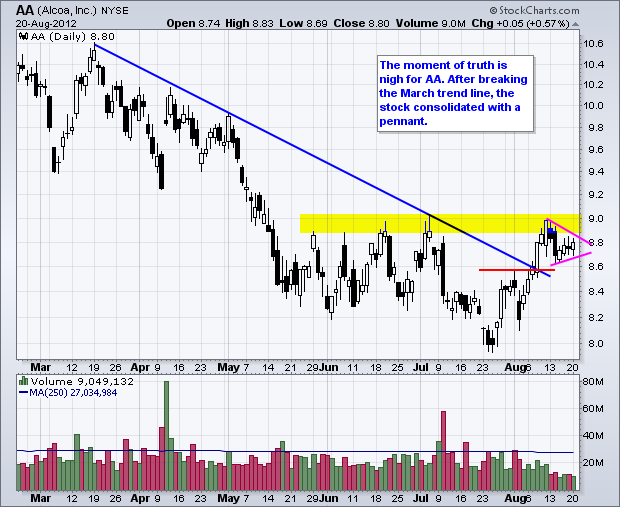
Charts: AA, ALK, AVP, CPN, JPM, LRCX, TEVA
by Arthur Hill,
Chief Technical Strategist, TrendInvestorPro.com
AA Forms Pennant Near Resistance.
CPN Surges off Key Retracement with Volume.
Plus ALK, AVP, JPM, LRCX, TEVA
This commentary and charts-of-interest are designed to stimulate thinking. This analysis is not a recommendation to buy, sell, hold or sell short any security (stock ETF or otherwise). We all need to...
READ MORE
MEMBERS ONLY
Airline ETF Surges off Support
by Arthur Hill,
Chief Technical Strategist, TrendInvestorPro.com
The on-again off-again Airline ETF (FAA) surged off support with a big move on Monday. After plunging in mid July, the ETF found support and then moved above its late July high. Also notice that Aroon Up surged above Aroon Down. You can read more on Aroon in our ChartSchool....
READ MORE
MEMBERS ONLY
QQQ and IWM Lead the Market Higher
by Arthur Hill,
Chief Technical Strategist, TrendInvestorPro.com
Stocks meandered on Friday and got a lift in the final hour to finish the week on a positive note. The Russell 2000 ETF (IWM) led the way with a .70% gain. The Dow Industrials SPDR (DIA) lagged with a .11% loss. Five of the nine sectors were higher. Of...
READ MORE
MEMBERS ONLY
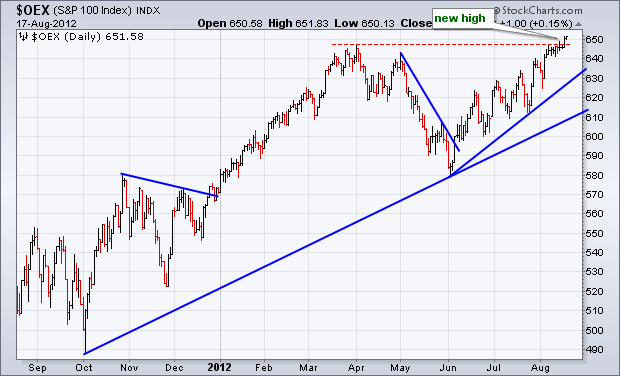
Large-caps Lead as S&P 100 Records 52-week High
by Arthur Hill,
Chief Technical Strategist, TrendInvestorPro.com
Large-caps continue to lead the market as the S&P 100 ($OEX) recorded a 52-week high this week. Thus far, the S&P 100 is the only major index to reach this milestone. The Nasdaq, Russell 2000, S&P 500 and Dow Industrials remain shy of their...
READ MORE
MEMBERS ONLY
TSX Composite Breaks 200-day SMA
by Arthur Hill,
Chief Technical Strategist, TrendInvestorPro.com
The TSX Composite ($TSX) is a little late to the party, but the index found some gas this week and surged above its 200-day moving average for the first time since early May. The index also broke the March trend line and exceeded its early July high.
Click this image...
READ MORE
MEMBERS ONLY
NYSE AD Line and SPY Hit New Highs
by Arthur Hill,
Chief Technical Strategist, TrendInvestorPro.com
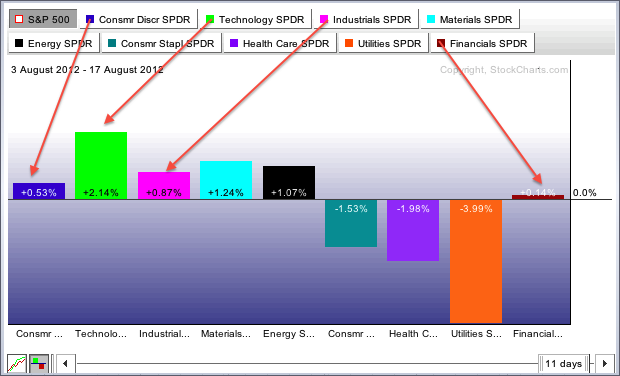
With fresh highs in the major index ETFs this week, the indicator groups held their positive ratings and there was even an upgrade. Sector performance was upgraded because three of the four offensive sectors are showing relative strength (consumer discretionary, industrials and technology). Finance remains a drag, but these three...
READ MORE
MEMBERS ONLY
IWM Breaks Flag Resistance - UUP Forms Triangle
by Arthur Hill,
Chief Technical Strategist, TrendInvestorPro.com
Stocks caught a bid on Thursday and closed modestly higher. The Nasdaq 100 ETF (QQQ) and Russell 2000 ETF (IWM) led the way by gaining over 1%. All sectors were up with technology and materials scoring the biggest gains. A big gain in the Home Construction iShares (+3.83%) helped...
READ MORE
MEMBERS ONLY
Tim Horton's Hits the P&F Triple Bottom Breakdown Scan
by Arthur Hill,
Chief Technical Strategist, TrendInvestorPro.com
Even though Tim Horton's remains in an uptrend since 2009 and above the Bullish Support Line, it recently broke triple bottom support and triggered a bearish signal on the Point & Figure chart. This breakdown points to further weakness with a price objective (PO) around 45. You can...
READ MORE
MEMBERS ONLY
SPY and USO Edge Above Flag Resistance
by Arthur Hill,
Chief Technical Strategist, TrendInvestorPro.com
Stocks continued their meandering ways on Wednesday, but the major index ETFs managed to close with gains. The Russell 2000 ETF (IWM) led the way with a .88% gain and the S&P 100 ETF (OEF) lagged with a .02% gain. Even though relative strength in small-caps is welcome,...
READ MORE
MEMBERS ONLY
Charts of Interest: AMX, ATVI, FAST, HCA, SNDK
by Arthur Hill,
Chief Technical Strategist, TrendInvestorPro.com
ATVI Recovers after Support Break.
FAST Forms Bull Flag after Breakout.
Plus AMX, HCA, SNDK
This commentary and charts-of-interest are designed to stimulate thinking. This analysis is not a recommendation to buy, sell, hold or sell short any security (stock ETF or otherwise). We all need to think for ourselves...
READ MORE
MEMBERS ONLY
Lumber Futures Surge along with Home Construction ETF
by Arthur Hill,
Chief Technical Strategist, TrendInvestorPro.com
Even though the match is not perfect, there is clearly a positive relationship between Lumber Futures ($LUMBER) and the Home Construction iShares (ITB). Notice that both have been trending higher since November 2011 and both recently recorded new highs.
Click this image for a live chart...
READ MORE
MEMBERS ONLY
Stocks Continue Drift as GLD Fails at Resistance
by Arthur Hill,
Chief Technical Strategist, TrendInvestorPro.com
Stocks continued their drift with a small surge on the open and then a drift lower throughout the day. Basically, the major index ETFs drifted back to their prior closed and finished the day virtually unchanged. Trading has been listless for 5-6 days now. Stocks moved sharply higher on August...
READ MORE
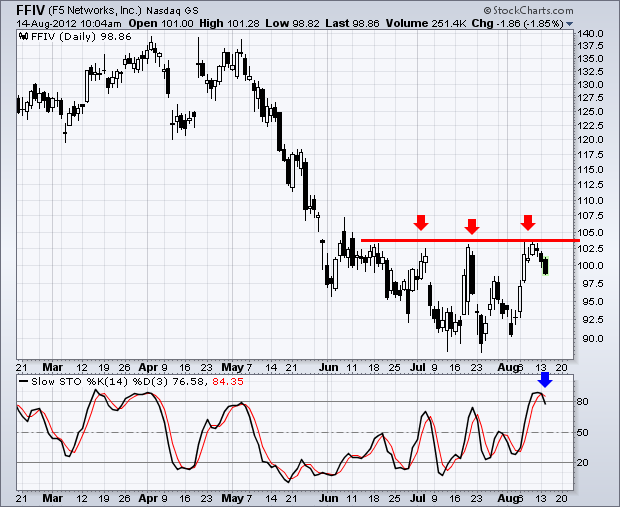
MEMBERS ONLY
F5 Networks Battles Resistance as Stochastic Oscillator Turns Down
by Arthur Hill,
Chief Technical Strategist, TrendInvestorPro.com
F5 Networks (FFIV) surged to resistance in early August and then pulled back the last two days. Notice how the stock hit resistance in the 104 area twice in July and now once in August. The Stochastic Oscillator became overbought with a move above 80 and turned down with a...
READ MORE
MEMBERS ONLY
QQQ Breaks Consolidation - GLD Backs off Resistance
by Arthur Hill,
Chief Technical Strategist, TrendInvestorPro.com
The major index ETFs moved lower in early trading on Monday, but quickly firmed and advanced in afternoon trading. Even though the change from Friday's close to Monday's close was minimal, the ability to recover and close strong is a positive sign. Buying pressure is coming...
READ MORE
MEMBERS ONLY
Charts of Interest: IP, MCK, SYK, SCMR and TIBX
by Arthur Hill,
Chief Technical Strategist, TrendInvestorPro.com
IP Follows Through on Island Reversal.
Bollinger Bands Narrow for SCMR.
Plus MCK, SYK and TIBX
This commentary and charts-of-interest are designed to stimulate thinking. This analysis is not a recommendation to buy, sell, hold or sell short any security (stock ETF or otherwise). We all need to think for...
READ MORE
MEMBERS ONLY
Direct TV Breaks Neckline Resistance
by Arthur Hill,
Chief Technical Strategist, TrendInvestorPro.com
Direst TV (DVT) formed an inverse head-and-shoulders pattern from April to August and broke resistance with a strong surge the last three days. While the stock is short-term overbought, this breakout is bullish and broken resistance turns into the first support zone to watch on a pullback (~50).
Click this...
READ MORE
MEMBERS ONLY
Stocks are Short-Term Overbought - IWM and XRT Continue to Underperform
by Arthur Hill,
Chief Technical Strategist, TrendInvestorPro.com
Stocks continued higher last week and closed near their highs for the week. The Nasdaq 100 ETF broke resistance from its July highs and this breakout is holding. The Russell 2000 ETF broke falling channel resistance and this breakout is holding. The Dow Industrials is one of the strongest as...
READ MORE
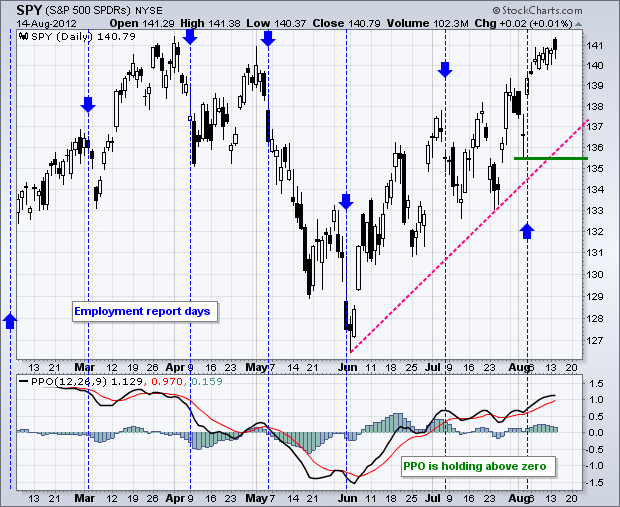
MEMBERS ONLY
Weekly Percent Price Oscillator Falls, but Remains Positive for SPY
by Arthur Hill,
Chief Technical Strategist, TrendInvestorPro.com
The Percent Price Oscillator (PPO) is a momentum oscillator that fluctuates above/below the zero line. While traders use divergences and direction for signals, investors can simply abide by the positive and negative crosses. The bulls have a trend edge when PPO is positive, while the bears have an edge...
READ MORE
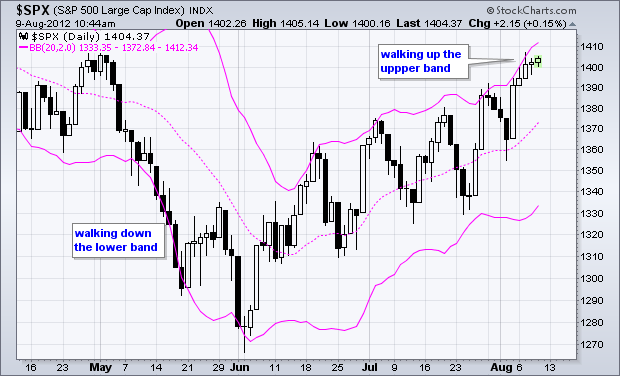
MEMBERS ONLY
S&P 500 Tags and Walks up the Band
by Arthur Hill,
Chief Technical Strategist, TrendInvestorPro.com
The S&P 500 surged to the upper Bollinger Band on Friday and walked further up the band this week. Notice how the index "tagged" the upper band in June, July and now August. Pullbacks also held above the lower band. This is the sign of a...
READ MORE
MEMBERS ONLY
Indicator Summary Improves with Three Upgrades
by Arthur Hill,
Chief Technical Strategist, TrendInvestorPro.com
With last Friday's surge and continued strength this week, the indicator summary improved as three groups were upgraded. I upgraded the AD Lined because the NYSE AD Line hit a new high. The AD Volume Lines were upgraded because they broke their mid July highs. The offensive/defensive...
READ MORE
MEMBERS ONLY
No Change in the Short-Term Trends - Charts Updated
by Arthur Hill,
Chief Technical Strategist, TrendInvestorPro.com
No commentary, just charts worth a 1000 words....
READ MORE
MEMBERS ONLY
ITB Breaks Flag Resistance - SLX Surges off Support
by Arthur Hill,
Chief Technical Strategist, TrendInvestorPro.com
Stocks turned indecisive on Wednesday as the major index ETFs closed mixed. The Dow Industrials SPDR (DIA) edged .13% lower, while the S&P 500 ETF (SPY) edged .12% higher. The sectors were also mixed with the Consumer Discretionary SPDR (XLY) losing .49% and the Consumer Staples SPDR (XLP)...
READ MORE
MEMBERS ONLY
Charts: ARUN, CPRT, DLTR, LEN, PLCE, SSP
by Arthur Hill,
Chief Technical Strategist, TrendInvestorPro.com
ARUN Surges to Resistance.
DLTR Breaks Falling Wedge Resistance.
PLCE Consolidates after Big Move.
Plus CPRT, LEN, SSP
This commentary and charts-of-interest are designed to stimulate thinking. This analysis is not a recommendation to buy, sell, hold or sell short any security (stock ETF or otherwise). We all need to...
READ MORE
MEMBERS ONLY
Commodity Index Fund Breaks Pennant Resistance
by Arthur Hill,
Chief Technical Strategist, TrendInvestorPro.com
With the risk-on trade taking shape the last two weeks, the Commodity Index Fund ($DBC) broke above pennant resistance to continue its July advance. The upper trend line extends down to mark first support at 27.50. A move back below this level would question the breakout and call for...
READ MORE
MEMBERS ONLY
Consumer Discretionary Stocks Feature in Top Ten for StockCharts Technical Rank (SCTR)
by Arthur Hill,
Chief Technical Strategist, TrendInvestorPro.com
The StockCharts Technical Rank (SCTR) calculates a numerical ranking for all stocks in the S&P 500. Four of the top ten stocks come from the consumer discretionary sector, which is the most economically sensitive sector. Two of the top ten come from the technology sector. StocksCharts also provides...
READ MORE
MEMBERS ONLY
IWM and MDY Breakout as Small and Mid Caps Perk Up
by Arthur Hill,
Chief Technical Strategist, TrendInvestorPro.com
Stocks extended their gains for the third day running. Since gapping up on Friday morning, the major index ETFs continued their advance with a slower zigzag. Even though this means less upside momentum, there is clearly more upside momentum than downside momentum. Small-caps took the lead on Tuesday with the...
READ MORE
MEMBERS ONLY
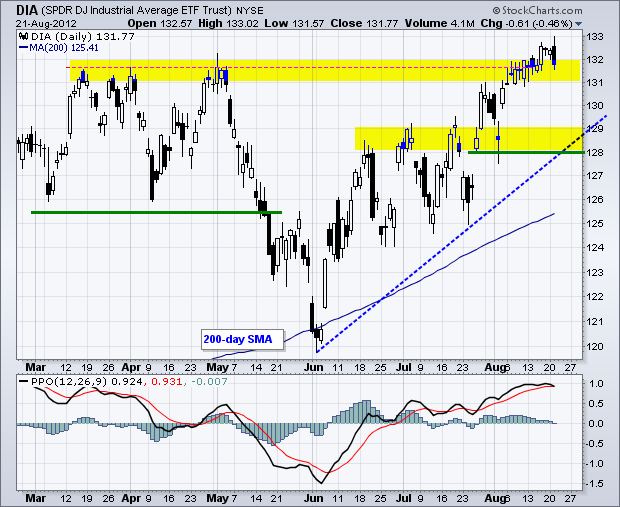
DIA Forms Gravestone Doji - IWM Challenges Late July High
by Arthur Hill,
Chief Technical Strategist, TrendInvestorPro.com
Stocks continued higher on Monday, but late selling pressure hit in the final fifteen minutes. As a result of this late selling pressure, the Dow Industrials SPDR (DIA) formed a gravestone doji with a long upper shadow. Even though this shows a failed rally intraday, it is not enough to...
READ MORE