MEMBERS ONLY
SPY and USO Edge Above Flag Resistance
by Arthur Hill,
Chief Technical Strategist, TrendInvestorPro.com
Stocks continued their meandering ways on Wednesday, but the major index ETFs managed to close with gains. The Russell 2000 ETF (IWM) led the way with a .88% gain and the S&P 100 ETF (OEF) lagged with a .02% gain. Even though relative strength in small-caps is...
READ MORE
MEMBERS ONLY
Charts of Interest: AMX, ATVI, FAST, HCA, SNDK
by Arthur Hill,
Chief Technical Strategist, TrendInvestorPro.com
ATVI Recovers after Support Break.
FAST Forms Bull Flag after Breakout.
Plus AMX, HCA, SNDK
This commentary and charts-of-interest are designed to stimulate thinking. This analysis is not a recommendation to buy, sell, hold or sell short any security (stock ETF or otherwise). We all need to think...
READ MORE
MEMBERS ONLY
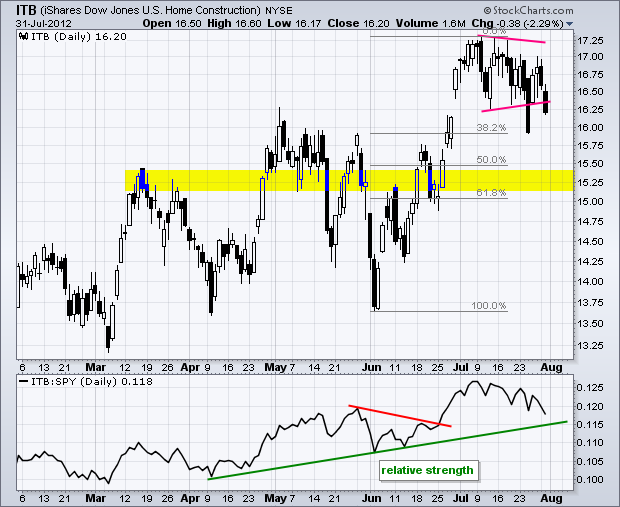
Lumber Futures Surge along with Home Construction ETF
by Arthur Hill,
Chief Technical Strategist, TrendInvestorPro.com
Even though the match is not perfect, there is clearly a positive relationship between Lumber Futures ($LUMBER) and the Home Construction iShares (ITB). Notice that both have been trending higher since November 2011 and both recently recorded new highs.
Click this image for a live chart...
READ MORE
MEMBERS ONLY
Stocks Continue Drift as GLD Fails at Resistance
by Arthur Hill,
Chief Technical Strategist, TrendInvestorPro.com
Stocks continued their drift with a small surge on the open and then a drift lower throughout the day. Basically, the major index ETFs drifted back to their prior closed and finished the day virtually unchanged. Trading has been listless for 5-6 days now. Stocks moved sharply higher on...
READ MORE
MEMBERS ONLY
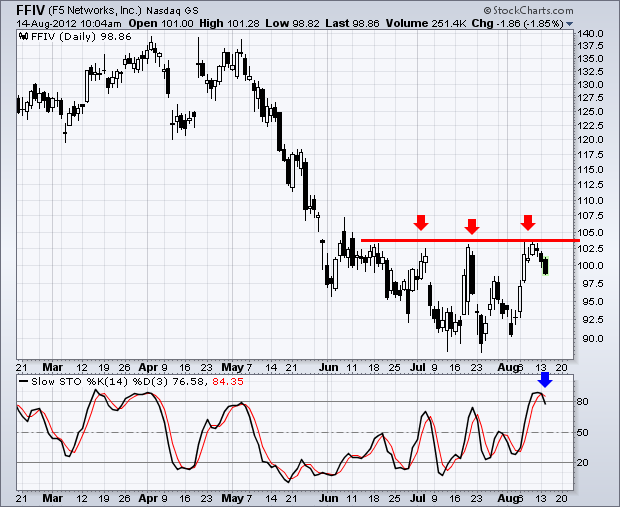
F5 Networks Battles Resistance as Stochastic Oscillator Turns Down
by Arthur Hill,
Chief Technical Strategist, TrendInvestorPro.com
F5 Networks (FFIV) surged to resistance in early August and then pulled back the last two days. Notice how the stock hit resistance in the 104 area twice in July and now once in August. The Stochastic Oscillator became overbought with a move above 80 and turned down with a...
READ MORE
MEMBERS ONLY
QQQ Breaks Consolidation - GLD Backs off Resistance
by Arthur Hill,
Chief Technical Strategist, TrendInvestorPro.com
The major index ETFs moved lower in early trading on Monday, but quickly firmed and advanced in afternoon trading. Even though the change from Friday's close to Monday's close was minimal, the ability to recover and close strong is a positive sign. Buying pressure is coming...
READ MORE
MEMBERS ONLY
Charts of Interest: IP, MCK, SYK, SCMR and TIBX
by Arthur Hill,
Chief Technical Strategist, TrendInvestorPro.com
IP Follows Through on Island Reversal.
Bollinger Bands Narrow for SCMR.
Plus MCK, SYK and TIBX
This commentary and charts-of-interest are designed to stimulate thinking. This analysis is not a recommendation to buy, sell, hold or sell short any security (stock ETF or otherwise). We all need to...
READ MORE
MEMBERS ONLY
Direct TV Breaks Neckline Resistance
by Arthur Hill,
Chief Technical Strategist, TrendInvestorPro.com
Direst TV (DVT) formed an inverse head-and-shoulders pattern from April to August and broke resistance with a strong surge the last three days. While the stock is short-term overbought, this breakout is bullish and broken resistance turns into the first support zone to watch on a pullback...
READ MORE
MEMBERS ONLY
Stocks are Short-Term Overbought - IWM and XRT Continue to Underperform
by Arthur Hill,
Chief Technical Strategist, TrendInvestorPro.com
Stocks continued higher last week and closed near their highs for the week. The Nasdaq 100 ETF broke resistance from its July highs and this breakout is holding. The Russell 2000 ETF broke falling channel resistance and this breakout is holding. The Dow Industrials is one of the strongest as...
READ MORE
MEMBERS ONLY
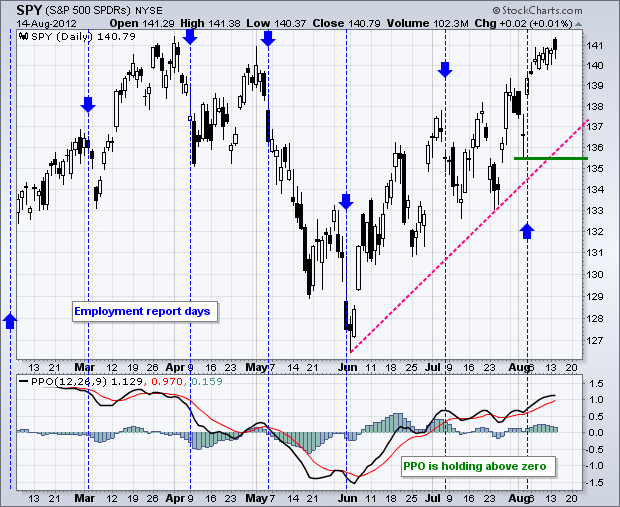
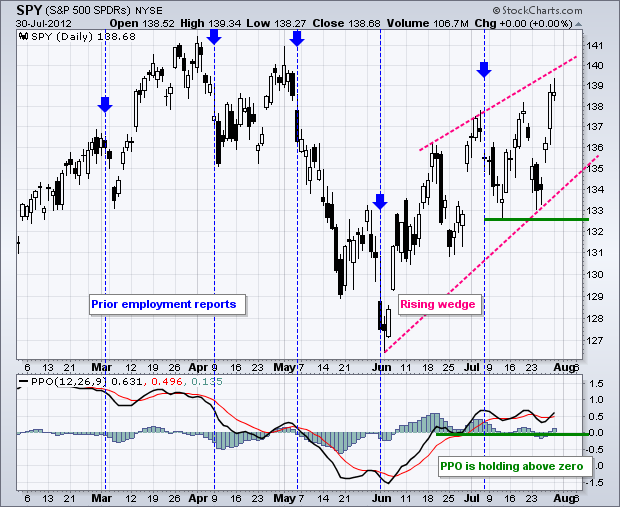
Weekly Percent Price Oscillator Falls, but Remains Positive for SPY
by Arthur Hill,
Chief Technical Strategist, TrendInvestorPro.com
The Percent Price Oscillator (PPO) is a momentum oscillator that fluctuates above/below the zero line. While traders use divergences and direction for signals, investors can simply abide by the positive and negative crosses. The bulls have a trend edge when PPO is positive, while the bears have an edge...
READ MORE
MEMBERS ONLY
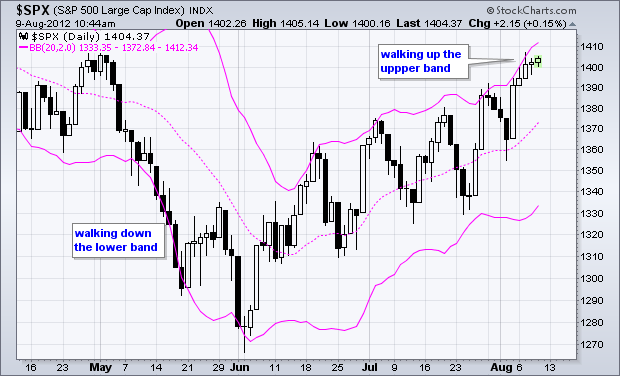
S&P 500 Tags and Walks up the Band
by Arthur Hill,
Chief Technical Strategist, TrendInvestorPro.com
The S&P 500 surged to the upper Bollinger Band on Friday and walked further up the band this week. Notice how the index "tagged" the upper band in June, July and now August. Pullbacks also held above the lower band. This is the sign of a...
READ MORE
MEMBERS ONLY
Indicator Summary Improves with Three Upgrades
by Arthur Hill,
Chief Technical Strategist, TrendInvestorPro.com
With last Friday's surge and continued strength this week, the indicator summary improved as three groups were upgraded. I upgraded the AD Lined because the NYSE AD Line hit a new high. The AD Volume Lines were upgraded because they broke their mid July highs. The offensive/defensive...
READ MORE
MEMBERS ONLY
No Change in the Short-Term Trends - Charts Updated
by Arthur Hill,
Chief Technical Strategist, TrendInvestorPro.com
No commentary, just charts worth a 1000 words....
READ MORE
MEMBERS ONLY
ITB Breaks Flag Resistance - SLX Surges off Support
by Arthur Hill,
Chief Technical Strategist, TrendInvestorPro.com
Stocks turned indecisive on Wednesday as the major index ETFs closed mixed. The Dow Industrials SPDR (DIA) edged .13% lower, while the S&P 500 ETF (SPY) edged .12% higher. The sectors were also mixed with the Consumer Discretionary SPDR (XLY) losing .49% and the Consumer Staples SPDR (XLP)...
READ MORE
MEMBERS ONLY
Charts: ARUN, CPRT, DLTR, LEN, PLCE, SSP
by Arthur Hill,
Chief Technical Strategist, TrendInvestorPro.com
ARUN Surges to Resistance.
DLTR Breaks Falling Wedge Resistance.
PLCE Consolidates after Big Move.
Plus CPRT, LEN, SSP
This commentary and charts-of-interest are designed to stimulate thinking. This analysis is not a recommendation to buy, sell, hold or sell short any security (stock ETF or otherwise). We all...
READ MORE
MEMBERS ONLY
Commodity Index Fund Breaks Pennant Resistance
by Arthur Hill,
Chief Technical Strategist, TrendInvestorPro.com
With the risk-on trade taking shape the last two weeks, the Commodity Index Fund ($DBC) broke above pennant resistance to continue its July advance. The upper trend line extends down to mark first support at 27.50. A move back below this level would question the breakout and call...
READ MORE
MEMBERS ONLY
Consumer Discretionary Stocks Feature in Top Ten for StockCharts Technical Rank (SCTR)
by Arthur Hill,
Chief Technical Strategist, TrendInvestorPro.com
The StockCharts Technical Rank (SCTR) calculates a numerical ranking for all stocks in the S&P 500. Four of the top ten stocks come from the consumer discretionary sector, which is the most economically sensitive sector. Two of the top ten come from the technology sector. StocksCharts also provides...
READ MORE
MEMBERS ONLY
IWM and MDY Breakout as Small and Mid Caps Perk Up
by Arthur Hill,
Chief Technical Strategist, TrendInvestorPro.com
Stocks extended their gains for the third day running. Since gapping up on Friday morning, the major index ETFs continued their advance with a slower zigzag. Even though this means less upside momentum, there is clearly more upside momentum than downside momentum. Small-caps took the lead on Tuesday with...
READ MORE
MEMBERS ONLY
DIA Forms Gravestone Doji - IWM Challenges Late July High
by Arthur Hill,
Chief Technical Strategist, TrendInvestorPro.com
Stocks continued higher on Monday, but late selling pressure hit in the final fifteen minutes. As a result of this late selling pressure, the Dow Industrials SPDR (DIA) formed a gravestone doji with a long upper shadow. Even though this shows a failed rally intraday, it is not enough to...
READ MORE
MEMBERS ONLY
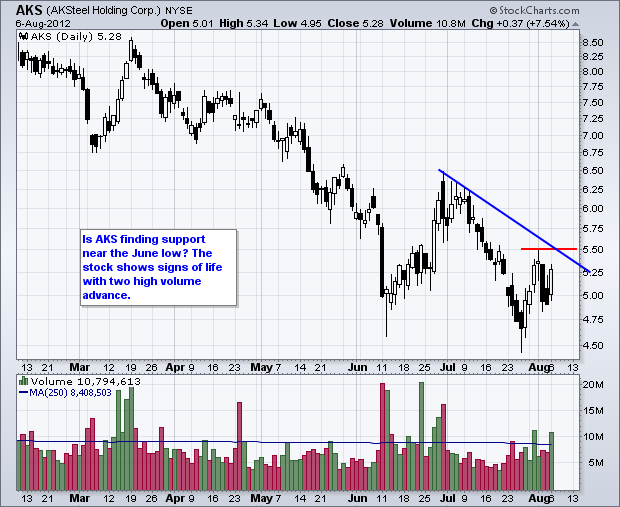
Charts of Interest: AKS, AMCC, CHKP, KBH, TEVA, VRTX
by Arthur Hill,
Chief Technical Strategist, TrendInvestorPro.com
$AKS Bounces with Good Volume. $KBH Forms Falling Wedge. $TEVA Traces out Bullish Engulfing Pattern.
This commentary and charts-of-interest are designed to stimulate thinking. This analysis is not a recommendation to buy, sell, hold or sell short any security (stock ETF or otherwise). We all need to think...
READ MORE
MEMBERS ONLY
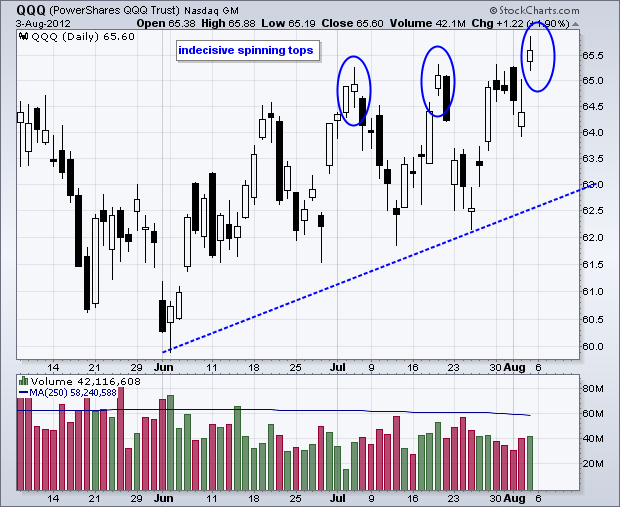
QQQ Forms Spinning Top Candlestick with Breakout
by Arthur Hill,
Chief Technical Strategist, TrendInvestorPro.com
The Nasdaq 100 ETF (QQQ) broke above resistance from the July highs and remains in an uptrend, but a spinning top formed on Friday. These candlesticks show indecision and the prior two foreshadowed pullbacks within the uptrend.
Click this image for a live chart....
READ MORE
MEMBERS ONLY
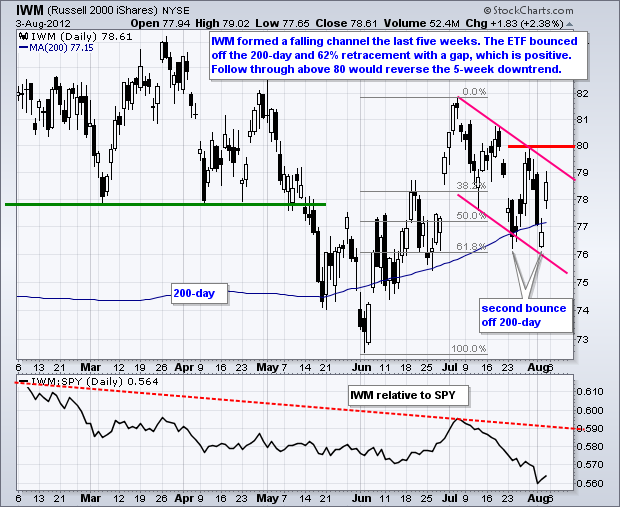
QQQ Breaks Resistance, but IWM Remains in Falling Channel
by Arthur Hill,
Chief Technical Strategist, TrendInvestorPro.com
There it is again. Stocks were pushed down early in the week, but positive news on employment and the ISM Services Index produced a very sharp rally on Friday. Small-caps led the surge as the Russell 2000 ETF (IWM) gained over 2%. All sectors were higher with the finance,...
READ MORE
MEMBERS ONLY
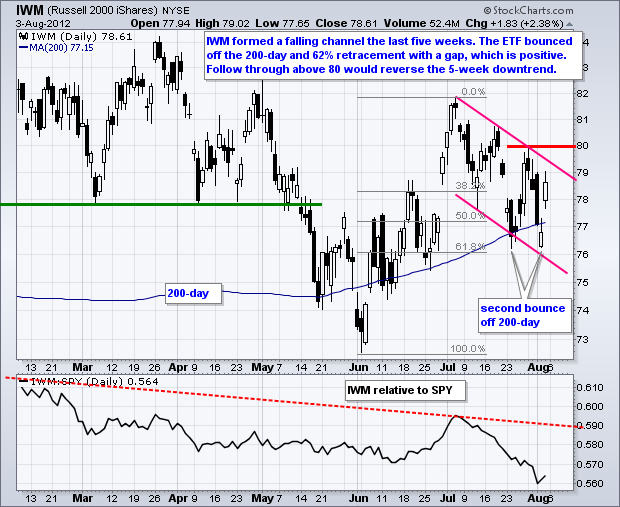
IWM Bounces off 200-day and Tests Channel Resistance
by Arthur Hill,
Chief Technical Strategist, TrendInvestorPro.com
Stocks turned a negative week into a positive week with a sharp advance on Friday. The S&P 500 ETF, Dow Industrials SPDR and Nasdaq 100 ETF recouped their early week losses and exceeded their July highs. The Russell 2000 ETF (IWM) and S&P MidCap 400 SPDR...
READ MORE
MEMBERS ONLY
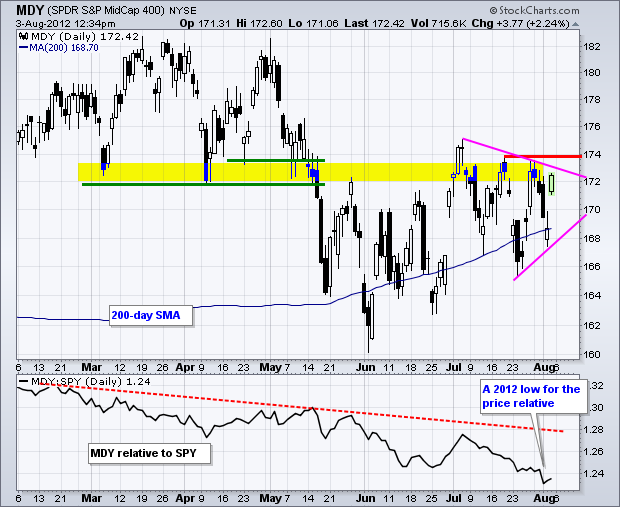
S&P MidCap 400 SPDR Battles Triangle Resistance
by Arthur Hill,
Chief Technical Strategist, TrendInvestorPro.com
The S&P MidCap 400 SPDR (MDY) continues to underperforming the S&P 500 ETF (SPY), but the ETF is showing signs of life with a surge off back above the 200-day and a challenge to triangle resistance. A breakout would be bullish and target a move...
READ MORE
MEMBERS ONLY
BPIs, NYSE AD Line and Net New Highs Keep Summary Bullish
by Arthur Hill,
Chief Technical Strategist, TrendInvestorPro.com
There is no change in the indicator summary. On the positive side, the NYSE AD Line is trading near a 52-week high, NYSE Net New Highs are positive and eight of the nine sector Bullish Percent Indices are above 50%. On the negative side, the AD Volume Lines remain...
READ MORE
MEMBERS ONLY
TLT Channels Higher - GLD Hits Moment of Truth
by Arthur Hill,
Chief Technical Strategist, TrendInvestorPro.com
Stocks moved sharply lower on Thursday's open when it became clear that European Central Bank (ECB) president Mario Draghi was not quite ready to act. Nevertheless, stocks firmed at midday and then edged off their lows in the afternoon. Perhaps the market is expecting an upside surprise to...
READ MORE
MEMBERS ONLY
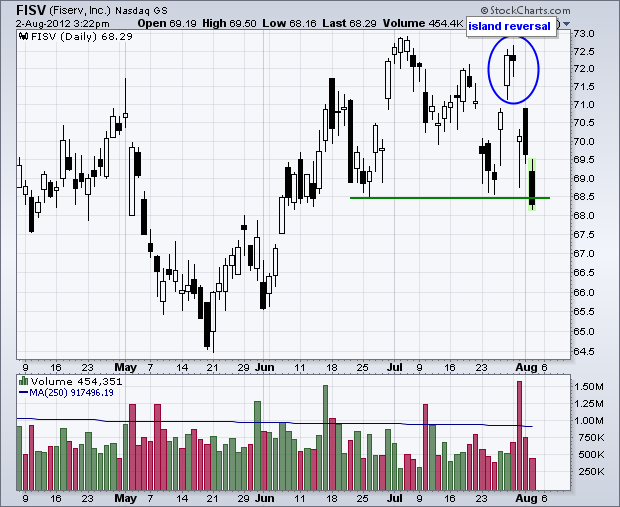
Fiserve Breaks Support after Island Reversal
by Arthur Hill,
Chief Technical Strategist, TrendInvestorPro.com
Fiserve (FISV) gapped up last week, but then gapped down this week to forge an island reversal. The stock followed through with a support break at 68 and this short-term trend reversal is turning into a medium-term trend reversal.
Click this image for a live chart...
READ MORE
MEMBERS ONLY
AD Volume Lines Falter as IWM Leads Lower
by Arthur Hill,
Chief Technical Strategist, TrendInvestorPro.com
The S&P 500 ETF (-.36%) and Dow Industrials SPDR (-.19%) edged lower on Wednesday, but the Russell 2000 ETF (-1.65%) and S&P MidCap 400 SPDR (1.05%) moved decisively lower. Again, relative weakness in small-caps and mid-caps remains a major concern in the...
READ MORE
MEMBERS ONLY
Charts of Interest: ARO, ASEI, BBBY, FISV, HRB, LIFE
by Arthur Hill,
Chief Technical Strategist, TrendInvestorPro.com
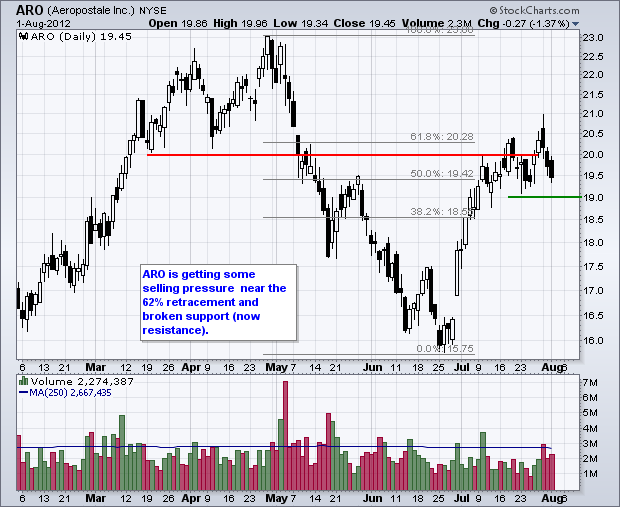
ARO Stalls at 61.80% Retracement.
FISV Forms Island Reversal.
HRB Breaks Flag Support with High Volume.
Plus ASEI, BBBY, LIFE
This commentary and charts-of-interest are designed to stimulate thinking. This analysis is not a recommendation to buy, sell, hold or sell short any security (stock ETF or...
READ MORE
MEMBERS ONLY
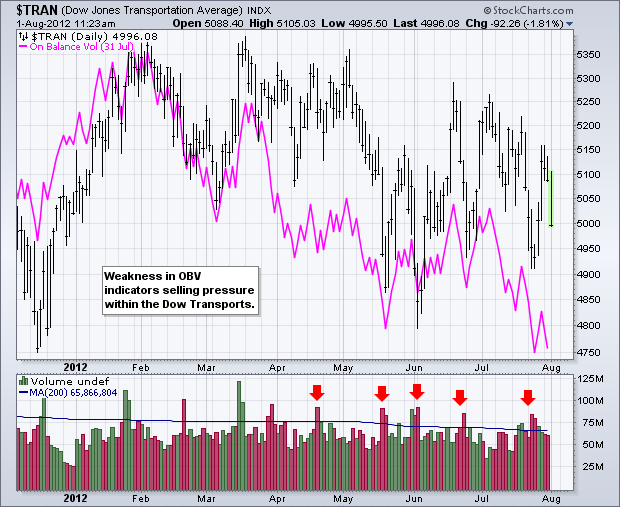
OBV Falls to New Lows for Dow Transports
by Arthur Hill,
Chief Technical Strategist, TrendInvestorPro.com
On Balance Volume (OBV) is a simple indicator that measures buying and selling pressure. Volume is added on up days and subtracted on down days. Even though the Dow Transports is holding above its June low, OBV sank to new lows and shows selling pressure.
Click this image for a...
READ MORE
MEMBERS ONLY
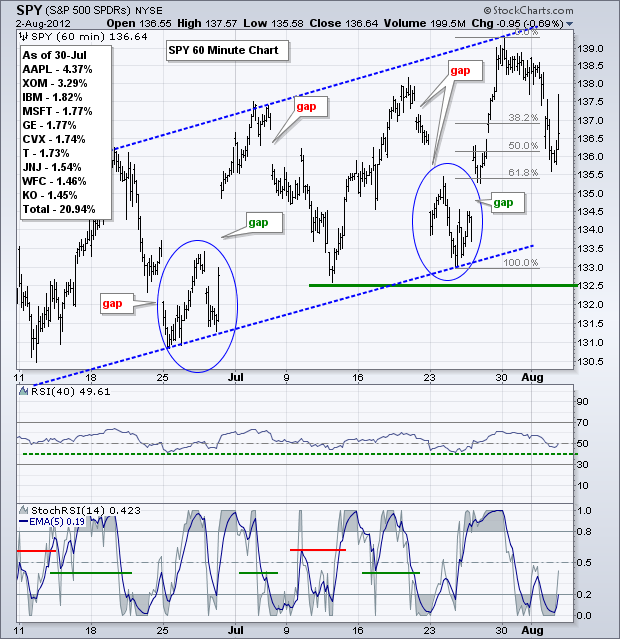
SPY Forms Falling Flag as USO Starts to Underperform
by Arthur Hill,
Chief Technical Strategist, TrendInvestorPro.com
Stocks continued to edge lower on Tuesday with small-caps and mid-caps leading the way. The Russell 2000 ETF lost .70% and the S&P MidCap 400 SPDR declined just over 1%. Eight of the nine sectors were down with the Technology SPDR bucking the trend. However, XLK...
READ MORE
MEMBERS ONLY
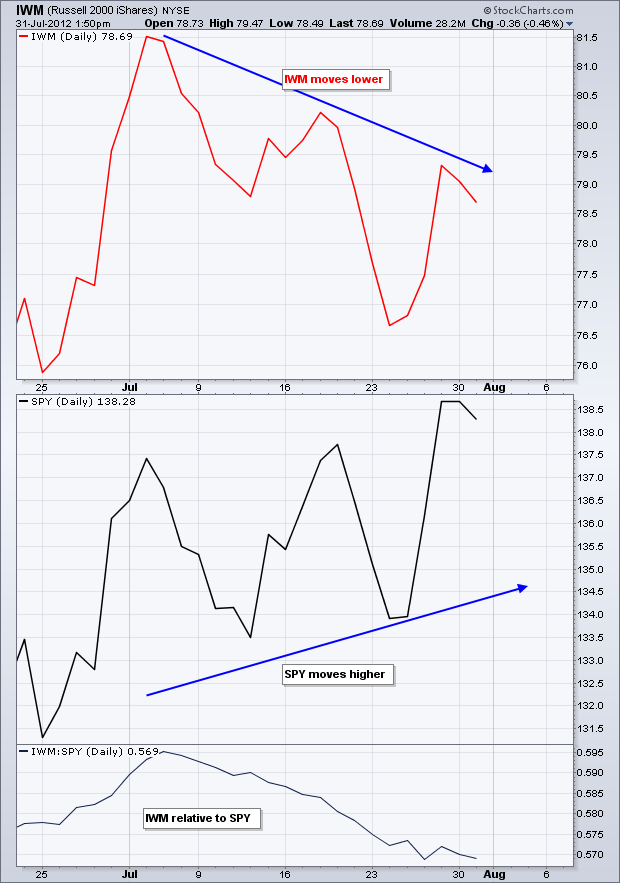
IWM and SPY Go Separate Ways
by Arthur Hill,
Chief Technical Strategist, TrendInvestorPro.com
The Russell 2000 ETF (IWM) and the S&P 500 ETF (SPY) parted ways over the last few weeks. IWM peaked in early July and zigzagged lower. SPY, in contrast, zigzagged higher with a move above the mid July high. This divergence means small-caps are showing relative weakness....
READ MORE
MEMBERS ONLY
SPY Stalls with Indecisive Candlestick
by Arthur Hill,
Chief Technical Strategist, TrendInvestorPro.com
Stocks edged lower on Monday in listless trading. The Russell 2000 ETF (IWM) led the way down with a .64% loss, while the Nasdaq 100 ETF (QQQ) held most of its ground with a fractional .11% loss. Sector action was mixed with technology, energy, consumer staples and utilities slightly higher....
READ MORE
MEMBERS ONLY
Charts: ANF, CVS, DDR, DHI, KGC, MCHP, UTX, XL
by Arthur Hill,
Chief Technical Strategist, TrendInvestorPro.com
DHI Stalls above Resistance Break.
KGC Breaks Wedge Resistance.
MCHP Breaks Triangle Resistance.
Plus ANF, CVS, DDR, UTX, XL
This commentary and charts-of-interest are designed to stimulate thinking. This analysis is not a recommendation to buy, sell, hold or sell short any security (stock ETF or otherwise). We...
READ MORE
MEMBERS ONLY
Technology Stocks Lead Market Lower on Sector Carpet
by Arthur Hill,
Chief Technical Strategist, TrendInvestorPro.com
Stocks were weak on Monday with the Technology Sector (XLK) leading the market down. The average loss for a technology stock was .70 percent. Citrix (CTXS) was the big loser with a decline of 6.09%. The Consumer Discretionary SPDR (XLY) was also showing weakness.
Click this image for a...
READ MORE
MEMBERS ONLY
NYSE Breadth Remains Strong, but Nasdaq Breadth is Weak
by Arthur Hill,
Chief Technical Strategist, TrendInvestorPro.com
There was one downgrade, but the indicator summary remains net positive. Net New Highs were downgraded to neutral because Nasdaq Net New Highs are showing weakness as the cumulative line moved below its 10-day EMA. NYSE breadth remains strong overall as the AD Line trades near a 52-week...
READ MORE
MEMBERS ONLY
SPY Surges to Channel Trend Line - GLD Breaks Triangle
by Arthur Hill,
Chief Technical Strategist, TrendInvestorPro.com
Mario Draghi said the magic words and stocks answered with a powerful surge higher. The rally started on Thursday and extended on Friday. The Russell 2000 ETF (IWM) and Nasdaq 100 ETF (QQQ) led the charge with 2+ percent gains. All sectors were higher the Technology SPDR (XLK), Industrials SPDR...
READ MORE
MEMBERS ONLY
Taking a Day off - Back on Monday
by Arthur Hill,
Chief Technical Strategist, TrendInvestorPro.com
I am taking Friday off. Art's Charts will return on Monday with the Indicator Summary and normal commentary. Have a great weekend!...
READ MORE
MEMBERS ONLY
S&P 500 Bounces off Bullish Support Line on P&F Chart
by Arthur Hill,
Chief Technical Strategist, TrendInvestorPro.com
With a big surge above 1350 today, the S&P 500 reversed its falling O-Column and started a rising X-Column on the P&F chart. This reversal creates support from the prior two O-Columns and the rising Bullish Support Line (blue). A move below 1320...
READ MORE
MEMBERS ONLY
ITB Breaks Short-Term Support - GLD Surges
by Arthur Hill,
Chief Technical Strategist, TrendInvestorPro.com
Stocks were mixed on Wednesday. The Nasdaq 100 ETF (QQQ) and S&P 100 ETF (OEF) moving lower, but the Russell 2000 ETF (IWM) and S&P MidCap 400 SPDR (MDY) edging higher. The sectors were also moved with the Consumer Discretionary SPDR (XLY) and Technology SPDR (XLK)...
READ MORE