MEMBERS ONLY
Charts: AMZN, BBBY, CTXS, DRI, IDCC, JWN, NUE, SKUL
by Arthur Hill,
Chief Technical Strategist, TrendInvestorPro.com
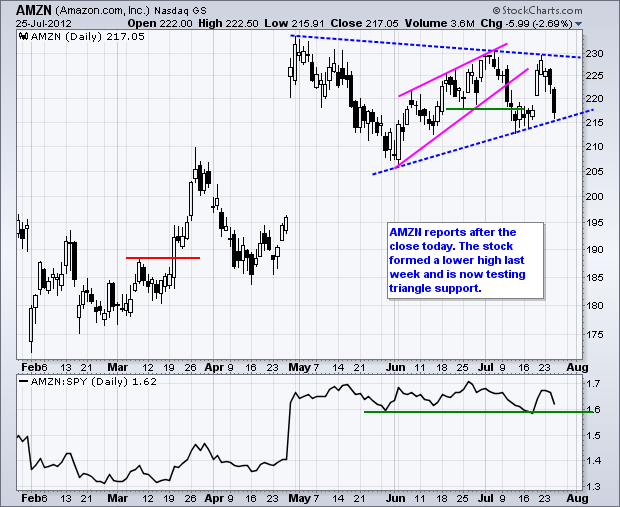
AMZN Tests Triangle ahead of Earnings.
CTXS Gaps Down.
JWN Hits Key Retracement.
Plus BBBY, DRI, IDCC, NUE, SKUL
This commentary and charts-of-interest are designed to stimulate thinking. This analysis is not a recommendation to buy, sell, hold or sell short any security (stock ETF or otherwise). We...
READ MORE
MEMBERS ONLY
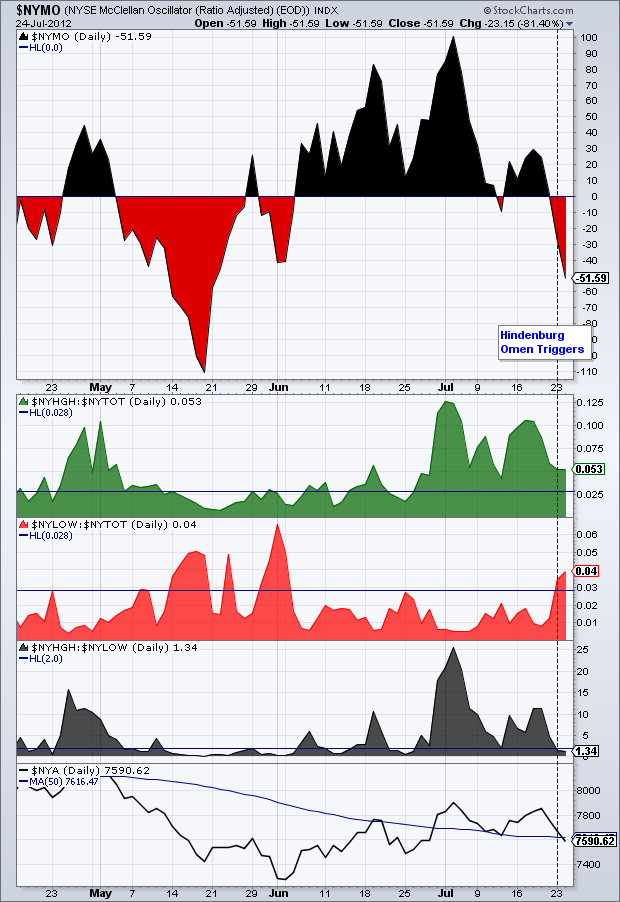
Hindenburg Omen Almost Triggers as New Lows Surge
by Arthur Hill,
Chief Technical Strategist, TrendInvestorPro.com
This blog entry has been updated to reflect new information. The Hindenburg omen almost triggered on July 23rd. First, notice that new highs and news lows as a percentage of total issues surged above 2.8%. Second, notice that new highs were less twice the number of new lows. The...
READ MORE
MEMBERS ONLY
IWM Tests 200-day - GLD Firms within Falling Wedge
by Arthur Hill,
Chief Technical Strategist, TrendInvestorPro.com
Stocks were under selling pressure again on Tuesday with the Russell 2000 ETF (IWM) and S&P MidCap 400 SPDR (MDY) leading the way lower. Small and mid-caps are less diversified than large-caps and they have less overseas exposure. In other words, they are more domestically oriented....
READ MORE
MEMBERS ONLY
New Lows Expand on the Technical Indicator Scan
by Arthur Hill,
Chief Technical Strategist, TrendInvestorPro.com
The image below comes from the predefined scans page. New highs were outpacking new lows earlier this month, but the tide is shifting as new lows expand on the NYSE and Nasdaq.
Click this image for a live version....
READ MORE
MEMBERS ONLY
SPY Gaps Down Again - XLY Continues to Underperform
by Arthur Hill,
Chief Technical Strategist, TrendInvestorPro.com
The major index ETFs were hit with strong selling pressure on the open, but managed to bounce after gapping down. Nevertheless, the major index ETFs finished with losses and the gaps held. Small-caps led the way lower as the Russell 2000 ETF (IWM) lost 1.60%. All nine sectors...
READ MORE
MEMBERS ONLY
Charts of Interest: CCE, ECA, FCX, FDX, JPM, NVDA, WU
by Arthur Hill,
Chief Technical Strategist, TrendInvestorPro.com
CCE Advances on Good Volume.
FDX Reverses at Key Retracement.
JPM Forms Falling Flag.
Plus ECA, FCX, NVDA, WU
This commentary and charts-of-interest are designed to stimulate thinking. This analysis is not a recommendation to buy, sell, hold or sell short any security (stock ETF or otherwise). We...
READ MORE
MEMBERS ONLY
Rising Yen Weighs on Japanese Stocks
by Arthur Hill,
Chief Technical Strategist, TrendInvestorPro.com
With the market shifting to risk-off mode the last few days, the Yen ETF (FXY) broke above trend line resistance. The Yen has been moving higher since early July and the Nikkei 225 ($NIKK) has been moving lower. In fact, notice that this seesaw relationship has been quite strong...
READ MORE
MEMBERS ONLY
IWM Gaps below Rising Wedge Trendline - XLF Underperforms
by Arthur Hill,
Chief Technical Strategist, TrendInvestorPro.com
Stocks moved sharply lower on Friday with the Russell 2000 ETF (IWM) and the Nasdaq 100 ETF (QQQ) leading the major index ETFs down. Seven of the nine sectors were lower with the Finance SPDR (XLF) leading this group. The Energy SPDR (XLE) and the Utilities SPDR (XLU) managed to...
READ MORE
MEMBERS ONLY
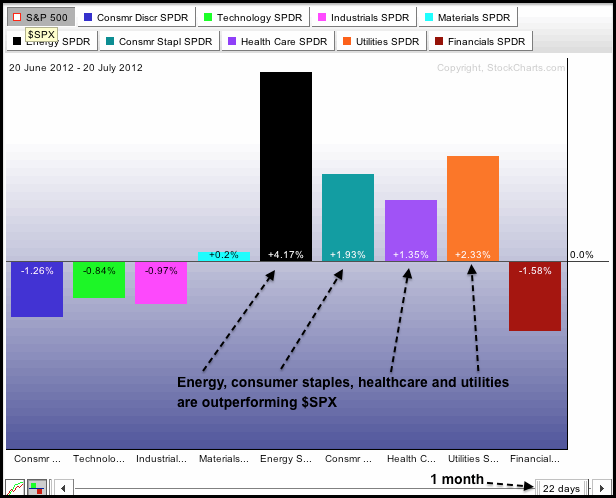
DEFENSIVE SECTORS STILL OUTPERFORMING OFFENSIVE SECTORS
by Arthur Hill,
Chief Technical Strategist, TrendInvestorPro.com
The first chart shows the S&P Sector PerfChart for the one month time frame (22 trading days) and the second chart shows the three month timeframe (64 trading days). Note that these PerfCharts show relative performance, which is the amount the SPDR is outperforming or underperforming the S&...
READ MORE
MEMBERS ONLY
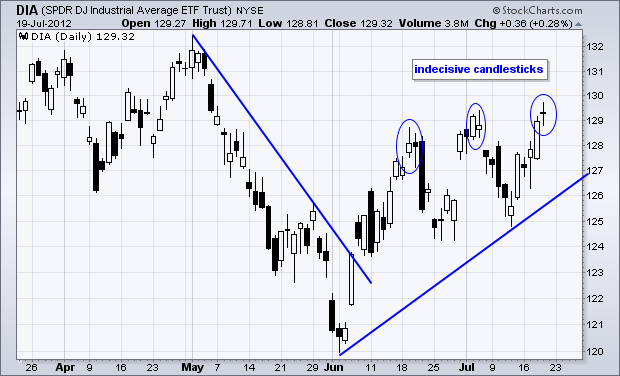
Dow Industrials SPDR Forms a Doji near Resistance
by Arthur Hill,
Chief Technical Strategist, TrendInvestorPro.com
After a four day surge that carried the Dow Industrials SPDR (DIA) above 129, the ETF formed a doji to signal indecision on Thursday. Also notice that DIA formed indecisive candlesticks at the prior two peaks. A gap down and long black candlestick on Friday would form a rare evening...
READ MORE
MEMBERS ONLY
Small-caps Start Underperforming as AD Volume Lines Turn Lower
by Arthur Hill,
Chief Technical Strategist, TrendInvestorPro.com
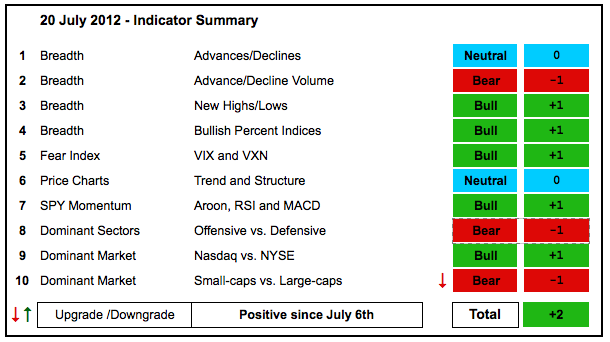
The indicator summary remains positive overall, but I downgraded the small-cap/large-cap indicator because small-caps are seriously underperforming the last two weeks. Even though the indicators remain net positive, I remain concerned because some key indicators are still bearish. The AD Volume Lines are bearish overall and...
READ MORE
MEMBERS ONLY
SPY Forms Doji as XLF and IWM Underperform
by Arthur Hill,
Chief Technical Strategist, TrendInvestorPro.com
Technology stocks led the market again on Thursday, but the finance sector weakened again and small-caps were also down on the day. Relative weakness in these two is not a good sign. At best, it points to a divided market that will trade sideways. At worst, it points to...
READ MORE
MEMBERS ONLY
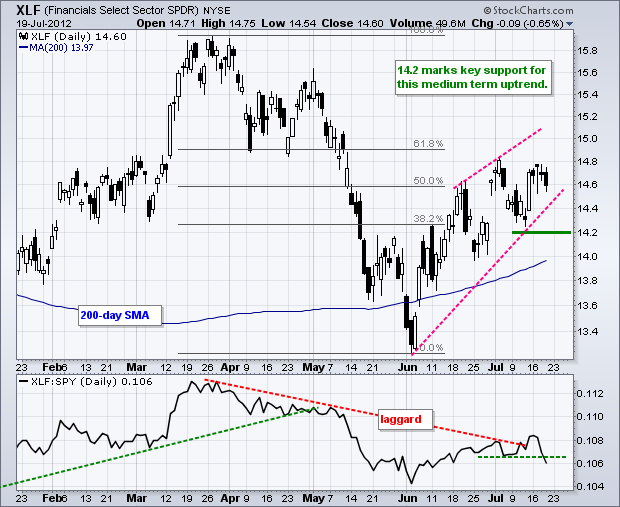
Finance SPDR Looks A Little Sick as the Price Relative Breaks Support
by Arthur Hill,
Chief Technical Strategist, TrendInvestorPro.com
The Finance SPDR (XLF) led the market higher from early June to mid July, but stalled the last four days and started showing relative weakness. The indicator window shows the price relative (XLF:SPY ratio). Notice how this indicator broke support from the early July low and XLF is now...
READ MORE
MEMBERS ONLY
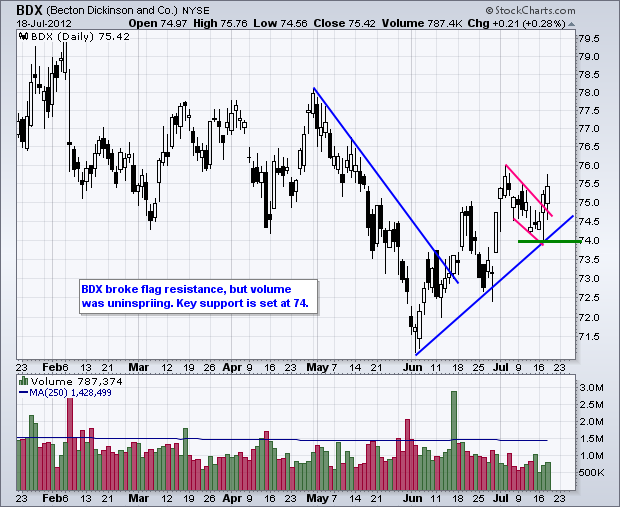
Charts: BDX, BX, CNX, MCD, MCO, MDT, SWKS, UNH, ZION
by Arthur Hill,
Chief Technical Strategist, TrendInvestorPro.com
SWKS Bounces off Support with Good Volume.
UNH Firms at Support Zone.
Plus BDX, BX, CNX, MCD, MCO, MDT, ZION
This commentary and charts-of-interest are designed to stimulate thinking. This analysis is not a recommendation to buy, sell, hold or sell short any security (stock ETF or otherwise)...
READ MORE
MEMBERS ONLY
IWM and XLY are Lagging, but SPY Extends Uptrend
by Arthur Hill,
Chief Technical Strategist, TrendInvestorPro.com
The bulls simply refuse to buckle. Economic reports have been below expectations for months, earnings are less than stellar and the Fed stands ready to act. Perhaps the stock market is pricing in quantitative easing for August or September. Even though stocks advanced, the advance was not even and did...
READ MORE
MEMBERS ONLY
Technology Sector Lights up the Sector Carpet
by Arthur Hill,
Chief Technical Strategist, TrendInvestorPro.com
Stocks moved higher with the technology sector leading the charge on Wednesday. The Sector Carpet shows lots of green in this key sector. Also notice that four of the top five performers come from technology. The finance sector was the weakest with three of the five biggest losers coming from...
READ MORE
MEMBERS ONLY
QQQ Forms Bearish Wedge and Underperforms
by Arthur Hill,
Chief Technical Strategist, TrendInvestorPro.com
Stocks were edgy on Tuesday as Fed chairman Ben Bernanke testified before congress. After an initial pop on the open, the major index ETFs dipped lower for around 40 minutes and then surged back into positive territory in the early afternoon. Tuesday's dip now provides a short-term...
READ MORE
MEMBERS ONLY
SPY and GLD Consolidate above their Breakouts
by Arthur Hill,
Chief Technical Strategist, TrendInvestorPro.com
Selling pressure hit the stock market after a weak retail sales report, but the major index ETFs managed to firm and finish with small losses. With another key economic report coming in below expectations, investors turned their attention to the prospects of more quantitative easing. Fed chairman Ben Bernanke testifies...
READ MORE
MEMBERS ONLY
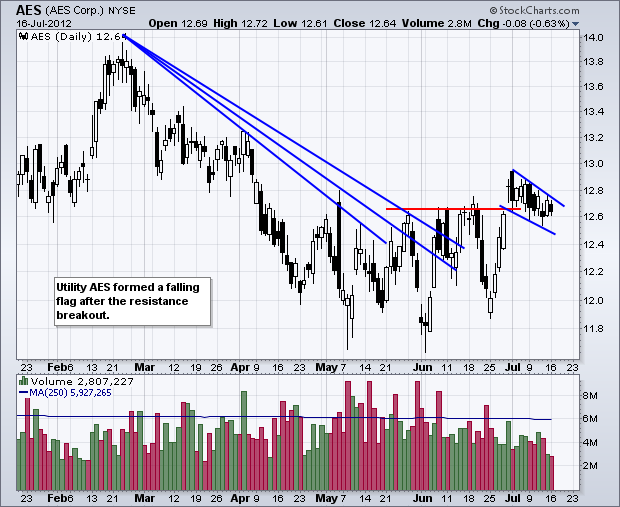
Charts: AES, ARO, ATVI, COV, DNR, GS, IACI, INTU, MRO
by Arthur Hill,
Chief Technical Strategist, TrendInvestorPro.com
AES Extends Flag Consolidation.
ATVI Surges and then Forms Bull Flag.
COV Breaks Wedge Trend Line.
Plus ARO, DNR, GS, IACI, INTU, MRO
This commentary and charts-of-interest are designed to stimulate thinking. This analysis is not a recommendation to buy, sell, hold or sell short any security (stock...
READ MORE
MEMBERS ONLY
Pfizer and Merck Lead Dow with New 52-week Highs
by Arthur Hill,
Chief Technical Strategist, TrendInvestorPro.com
The chart below shows four of the thirty CandleGlance charts for the Dow Industrials. Notice that big pharma is leading the way as Pfizer (PFE) and Merck (MRK) surge to new highs. The Healthcare SPDR (XLV) is also hitting a new high today.
Click this image for a live chart...
READ MORE
MEMBERS ONLY
An Inverse Head-and-Shoulders Develops for Halliburton
by Arthur Hill,
Chief Technical Strategist, TrendInvestorPro.com
With oil bouncing over the last few weeks, Halliburton is tracing out a little head-and-shoulders bottom. Despite a potentially bullish pattern, the stock remains short of the breakout needed to confirm a reversal. Also note that a volume expansion is needed to confirm any breakout.
Click this image...
READ MORE
MEMBERS ONLY
SPY Breaks Channel Resistance - GLD Breaks Wedge Trendline
by Arthur Hill,
Chief Technical Strategist, TrendInvestorPro.com
The risk-on trade took hold on Friday with stocks, oil and gold surging. All major index ETFs were up over 1%. Eight of the nine sector SPDRs were up over 1% with the Finance SPDR (XLF) leading the charge (+2.76%). JP Morgan was the big story of the...
READ MORE
MEMBERS ONLY
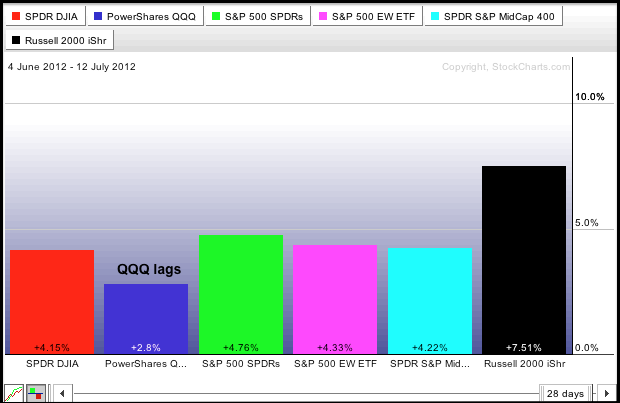
QQQ Lags the other Major index ETFs - IWM Leads
by Arthur Hill,
Chief Technical Strategist, TrendInvestorPro.com
The stock market bottomed on June 4th and moved higher the last 5-6 weeks. All major index ETFs are up since June 4th, but the Nasdaq 100 ETF (QQQ) sports the smallest gain. The PerfChart below shows QQQ up 2.8% and the rest up 4% or more. Note...
READ MORE
MEMBERS ONLY
AD Volume Lines Fail at Broken Support
by Arthur Hill,
Chief Technical Strategist, TrendInvestorPro.com
Despite a decline this week, the indicator summary remains unchanged and net positive. Even so, there are some glaring signs of weakness within the market. The AD Volume Lines failed at broken support and remain bearish overall. The Bullish Percent Indices for the technology and industrials sectors are below 50%...
READ MORE
MEMBERS ONLY
SPY Bounces off Retracement - USO Firms Near Breakout
by Arthur Hill,
Chief Technical Strategist, TrendInvestorPro.com
Stocks started the day with a sharp move lower, but quickly firmed and worked their way higher the rest of the day. The major index ETFs closed with relatively small losses. The sectors were mixed with five down and three up as money moved to relative safety. Note that the...
READ MORE
MEMBERS ONLY
Defensive Sectors Keeping the S&P 500 Positive
by Arthur Hill,
Chief Technical Strategist, TrendInvestorPro.com
The Sector PerfChart shows the percentage change for the S&P 500 and the nine sector SPDRs over the past month (22 trading days). Note that the S&P 500 is up, but the Consumer Discretionary SPDR (XLY), Technology SPDR (XLK) and Industrials SPDR (XLI) are down. In...
READ MORE
MEMBERS ONLY
SPY and IWM Hit Key Retracements
by Arthur Hill,
Chief Technical Strategist, TrendInvestorPro.com
Look out below! Asian stocks are getting hammered with the Nikkei down around 1.5% and the Hang Seng down around 2%. European stocks are down modestly. US stocks were weak yesterday and even dipped after the Fed minutes, but another one of those mysterious buying surges pushed stocks off...
READ MORE
MEMBERS ONLY
Charts of Interest: AES, AMZN, HBAN, HD, ILMN, PBCT
by Arthur Hill,
Chief Technical Strategist, TrendInvestorPro.com
AES Forms Bull Flag after Breakout.
AMZN Breaks Channel Support.
HD Forms Small Wedge after Gap Down.
Plus HBAN, ILMN, PBCT
This commentary and charts-of-interest are designed to stimulate thinking. This analysis is not a recommendation to buy, sell, hold or sell short any security (stock ETF or...
READ MORE
MEMBERS ONLY
Sector Summary Shows the Clothing & Accessories Index Leading the Consumer Discretionary Sector Lower
by Arthur Hill,
Chief Technical Strategist, TrendInvestorPro.com
The Consumer Discretionary SPDR (XLY) is one of the weakest sectors on Wednesday. Drilling down into the sector reveals weakness in apparel stocks. True Religion (TRLG) is down over 5%, while Polo Ralph Lauren (RL) and Warnaco (WRC) are down around 4%.
Click this image for a live chart...
READ MORE
MEMBERS ONLY
USO Breaks Flag Support - GLD Fails to Hold Gains
by Arthur Hill,
Chief Technical Strategist, TrendInvestorPro.com
Stocks started the day strong, but selling pressure soon took over and the major index ETFs closed lower. The S&P MidCap 400 SPDR (MDY) led the decline with a 1.12% loss, but the S&P 500 ETF (SPY) was not far behind with a .87% loss....
READ MORE
MEMBERS ONLY
DIA Fails in Gap Zone as Long Black Candlestick Forms
by Arthur Hill,
Chief Technical Strategist, TrendInvestorPro.com
The Dow Industrials SPDR (DIA) formed a harami last week and then gapped down on Friday. This gap below 128 held as the ETF opened near 128 and then closed below 127 on Tuesday. Short-term, the bulls need to fill this gap. A break below the rising wedge trendline...
READ MORE
MEMBERS ONLY
SPY Gaps Down and Stays Down - XLV Shows Relative Strength
by Arthur Hill,
Chief Technical Strategist, TrendInvestorPro.com
Stocks edged lower on Monday with the major index ETFs finishing slightly lower. Eight of the nine sectors were lower with the Energy SPDR (XLE) and Consumer Discretionary SPDR (XLY) leading the decline. Both were down around .5%. The Healthcare SPDR (XLV) was the lone gainer as big pharma stocks...
READ MORE
MEMBERS ONLY
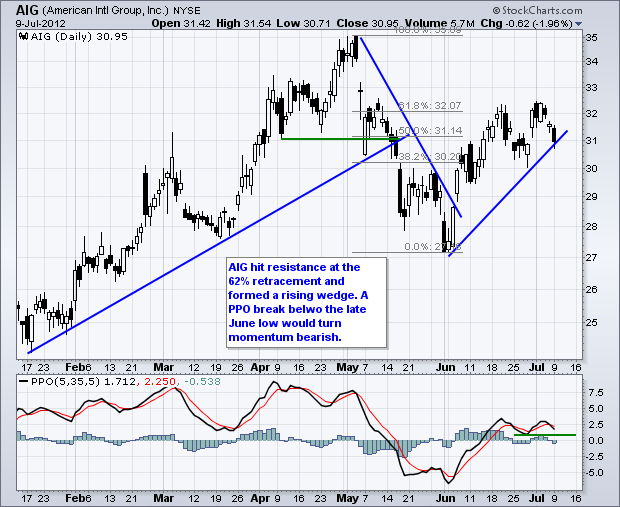
Charts: AIG, APD, CAH, CRM, DDS, MAT, MYL, XRAY
by Arthur Hill,
Chief Technical Strategist, TrendInvestorPro.com
AIG Hits Resistance at Key Retracement.
APD Forms Pennant Near Resistance.
MYL Surges after ACA Ruling.
Plus CAH, CRM, DDS, MAT, XRAY
This commentary and charts-of-interest are designed to stimulate thinking. This analysis is not a recommendation to buy, sell, hold or sell short any security (stock ETF...
READ MORE
MEMBERS ONLY
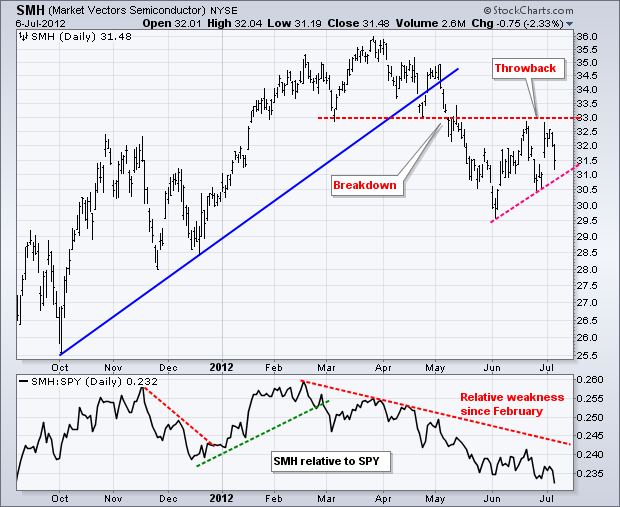
Networking and Semiconductor ETFs Fail at June Highs
by Arthur Hill,
Chief Technical Strategist, TrendInvestorPro.com
Relative weakness in the **Networking iShares (IGN)** and the **Market Vectors Semiconductor ETF (SMH)** weighed on the technology sector this week. The chart below shows SMH breaking down in May and then bouncing back to broken support in mid June. While SPY moved above its mid June high, SMH did...
READ MORE
MEMBERS ONLY
Gone Fishing on Monday
by Arthur Hill,
Chief Technical Strategist, TrendInvestorPro.com
I am taking a day off on Monday. Art's Charts will return on Tuesday....
READ MORE
MEMBERS ONLY
Watch the Yen ETF for Clues on the S&P 500
by Arthur Hill,
Chief Technical Strategist, TrendInvestorPro.com
The Yen ETF (FXY) and the S&P 500 have been moving opposite each other for the last 6-7 months. This is because the Yen represents a safe-haven (risk-off) and the S&P 500 represents a risky asset (risk on). Accordingly, FXY broke down in...
READ MORE
MEMBERS ONLY
Indicator Summary Turns Positive as NYSE AD Line Hits New High
by Arthur Hill,
Chief Technical Strategist, TrendInvestorPro.com
With a number of upgrades, the indicator summary turned positive this week. I am, however, concerned, that this positive switch could be short-lived because some key sectors are lagging and the AD Volume Lines have yet to turn bullish. Also note that the advance since June is looking like...
READ MORE
MEMBERS ONLY
XLY Continues to Lag as UUP Surges off Support
by Arthur Hill,
Chief Technical Strategist, TrendInvestorPro.com
Central banks around the world continue to ease monetary policy and open the money spigots. The Bank of England increased its third quantitative easing program by 50 billion pounds, the European Central Bank (ECB) cut all kinds of rates on Thursday and China surprised the markets with another rate cut....
READ MORE
MEMBERS ONLY
KLA-Tencor Holds the Gap $KLAC
by Arthur Hill,
Chief Technical Strategist, TrendInvestorPro.com
KLA-Tencor (KLA) has an island reversal of sorts working the last three weeks. Notice how the stock gapped down in mid June and then back up in late June. Since gapping higher last week, the stock consolidated the last four days. A break above consolidation resistance would signal a...
READ MORE
MEMBERS ONLY
MDY Leads with Breakout - USO Surges above Resistance
by Arthur Hill,
Chief Technical Strategist, TrendInvestorPro.com
Stocks have been trending higher since early June and the major index ETFs extended these trends on Monday-Tuesday. Uptrends suggest that the path of least resistance is up, but an economic avalanche over the next two days could make-or-break said trends. The European Central Bank (ECB) and...
READ MORE