MEMBERS ONLY
Pfizer and Merck Lead Dow with New 52-week Highs
by Arthur Hill,
Chief Technical Strategist, TrendInvestorPro.com
The chart below shows four of the thirty CandleGlance charts for the Dow Industrials. Notice that big pharma is leading the way as Pfizer (PFE) and Merck (MRK) surge to new highs. The Healthcare SPDR (XLV) is also hitting a new high today.
Click this image for a live chart...
READ MORE
MEMBERS ONLY
An Inverse Head-and-Shoulders Develops for Halliburton
by Arthur Hill,
Chief Technical Strategist, TrendInvestorPro.com
With oil bouncing over the last few weeks, Halliburton is tracing out a little head-and-shoulders bottom. Despite a potentially bullish pattern, the stock remains short of the breakout needed to confirm a reversal. Also note that a volume expansion is needed to confirm any breakout.
Click this image for a...
READ MORE
MEMBERS ONLY
SPY Breaks Channel Resistance - GLD Breaks Wedge Trendline
by Arthur Hill,
Chief Technical Strategist, TrendInvestorPro.com
The risk-on trade took hold on Friday with stocks, oil and gold surging. All major index ETFs were up over 1%. Eight of the nine sector SPDRs were up over 1% with the Finance SPDR (XLF) leading the charge (+2.76%). JP Morgan was the big story of the day...
READ MORE
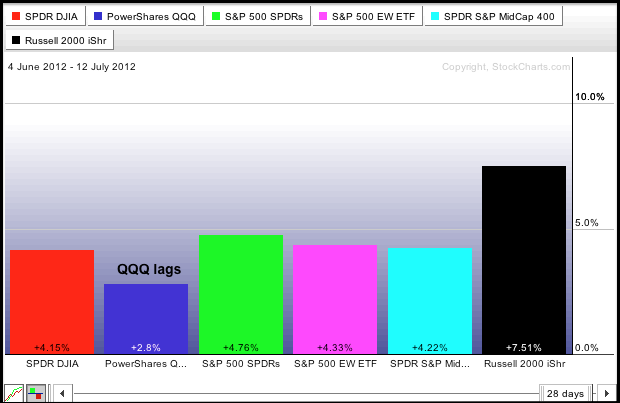
MEMBERS ONLY
QQQ Lags the other Major index ETFs - IWM Leads
by Arthur Hill,
Chief Technical Strategist, TrendInvestorPro.com
The stock market bottomed on June 4th and moved higher the last 5-6 weeks. All major index ETFs are up since June 4th, but the Nasdaq 100 ETF (QQQ) sports the smallest gain. The PerfChart below shows QQQ up 2.8% and the rest up 4% or more. Note that...
READ MORE
MEMBERS ONLY
AD Volume Lines Fail at Broken Support
by Arthur Hill,
Chief Technical Strategist, TrendInvestorPro.com
Despite a decline this week, the indicator summary remains unchanged and net positive. Even so, there are some glaring signs of weakness within the market. The AD Volume Lines failed at broken support and remain bearish overall. The Bullish Percent Indices for the technology and industrials sectors are below 50%...
READ MORE
MEMBERS ONLY
SPY Bounces off Retracement - USO Firms Near Breakout
by Arthur Hill,
Chief Technical Strategist, TrendInvestorPro.com
Stocks started the day with a sharp move lower, but quickly firmed and worked their way higher the rest of the day. The major index ETFs closed with relatively small losses. The sectors were mixed with five down and three up as money moved to relative safety. Note that the...
READ MORE
MEMBERS ONLY
Defensive Sectors Keeping the S&P 500 Positive
by Arthur Hill,
Chief Technical Strategist, TrendInvestorPro.com
The Sector PerfChart shows the percentage change for the S&P 500 and the nine sector SPDRs over the past month (22 trading days). Note that the S&P 500 is up, but the Consumer Discretionary SPDR (XLY), Technology SPDR (XLK) and Industrials SPDR (XLI) are down. In...
READ MORE
MEMBERS ONLY
SPY and IWM Hit Key Retracements
by Arthur Hill,
Chief Technical Strategist, TrendInvestorPro.com
Look out below! Asian stocks are getting hammered with the Nikkei down around 1.5% and the Hang Seng down around 2%. European stocks are down modestly. US stocks were weak yesterday and even dipped after the Fed minutes, but another one of those mysterious buying surges pushed stocks off...
READ MORE
MEMBERS ONLY
Charts of Interest: AES, AMZN, HBAN, HD, ILMN, PBCT
by Arthur Hill,
Chief Technical Strategist, TrendInvestorPro.com
AES Forms Bull Flag after Breakout.
AMZN Breaks Channel Support.
HD Forms Small Wedge after Gap Down.
Plus HBAN, ILMN, PBCT
This commentary and charts-of-interest are designed to stimulate thinking. This analysis is not a recommendation to buy, sell, hold or sell short any security (stock ETF or otherwise). We...
READ MORE
MEMBERS ONLY
Sector Summary Shows the Clothing & Accessories Index Leading the Consumer Discretionary Sector Lower
by Arthur Hill,
Chief Technical Strategist, TrendInvestorPro.com
The Consumer Discretionary SPDR (XLY) is one of the weakest sectors on Wednesday. Drilling down into the sector reveals weakness in apparel stocks. True Religion (TRLG) is down over 5%, while Polo Ralph Lauren (RL) and Warnaco (WRC) are down around 4%.
Click this image for a live chart...
READ MORE
MEMBERS ONLY
USO Breaks Flag Support - GLD Fails to Hold Gains
by Arthur Hill,
Chief Technical Strategist, TrendInvestorPro.com
Stocks started the day strong, but selling pressure soon took over and the major index ETFs closed lower. The S&P MidCap 400 SPDR (MDY) led the decline with a 1.12% loss, but the S&P 500 ETF (SPY) was not far behind with a .87% loss....
READ MORE
MEMBERS ONLY
DIA Fails in Gap Zone as Long Black Candlestick Forms
by Arthur Hill,
Chief Technical Strategist, TrendInvestorPro.com
The Dow Industrials SPDR (DIA) formed a harami last week and then gapped down on Friday. This gap below 128 held as the ETF opened near 128 and then closed below 127 on Tuesday. Short-term, the bulls need to fill this gap. A break below the rising wedge trendline would...
READ MORE
MEMBERS ONLY
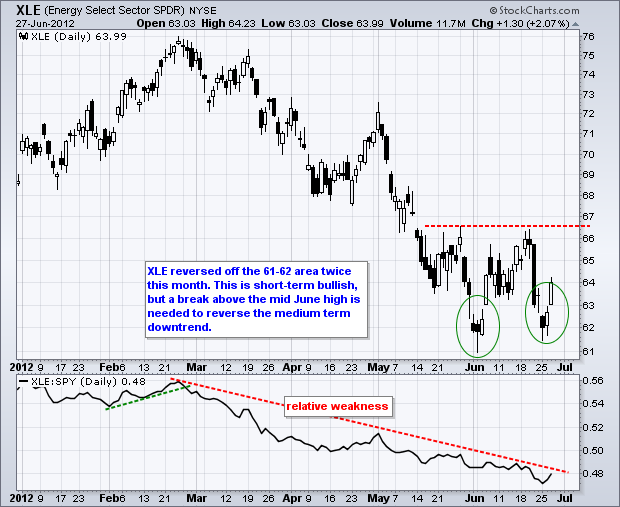
SPY Gaps Down and Stays Down - XLV Shows Relative Strength
by Arthur Hill,
Chief Technical Strategist, TrendInvestorPro.com
Stocks edged lower on Monday with the major index ETFs finishing slightly lower. Eight of the nine sectors were lower with the Energy SPDR (XLE) and Consumer Discretionary SPDR (XLY) leading the decline. Both were down around .5%. The Healthcare SPDR (XLV) was the lone gainer as big pharma stocks...
READ MORE
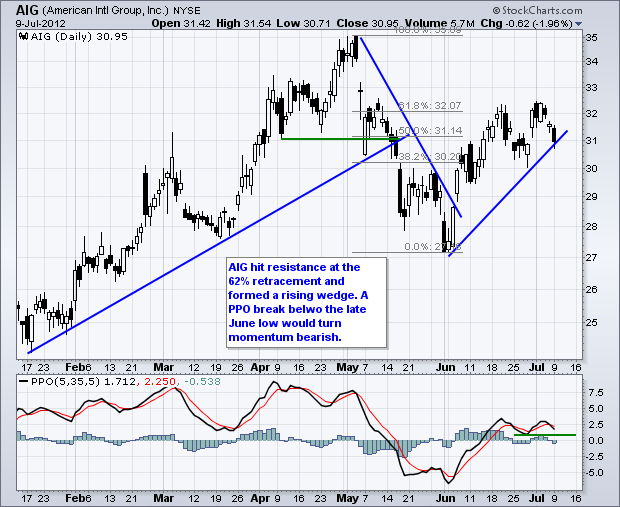
MEMBERS ONLY
Charts: AIG, APD, CAH, CRM, DDS, MAT, MYL, XRAY
by Arthur Hill,
Chief Technical Strategist, TrendInvestorPro.com
AIG Hits Resistance at Key Retracement.
APD Forms Pennant Near Resistance.
MYL Surges after ACA Ruling.
Plus CAH, CRM, DDS, MAT, XRAY
This commentary and charts-of-interest are designed to stimulate thinking. This analysis is not a recommendation to buy, sell, hold or sell short any security (stock ETF or otherwise)...
READ MORE
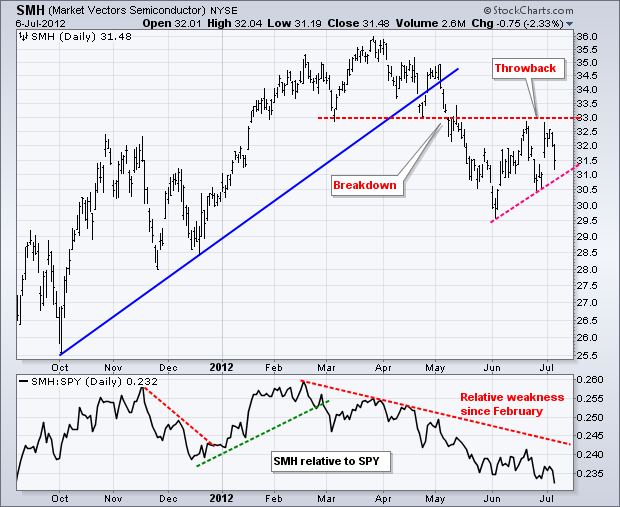
MEMBERS ONLY
Networking and Semiconductor ETFs Fail at June Highs
by Arthur Hill,
Chief Technical Strategist, TrendInvestorPro.com
Relative weakness in the **Networking iShares (IGN)** and the **Market Vectors Semiconductor ETF (SMH)** weighed on the technology sector this week. The chart below shows SMH breaking down in May and then bouncing back to broken support in mid June. While SPY moved above its mid June high, SMH did...
READ MORE
MEMBERS ONLY
Gone Fishing on Monday
by Arthur Hill,
Chief Technical Strategist, TrendInvestorPro.com
I am taking a day off on Monday. Art's Charts will return on Tuesday....
READ MORE
MEMBERS ONLY
Watch the Yen ETF for Clues on the S&P 500
by Arthur Hill,
Chief Technical Strategist, TrendInvestorPro.com
The Yen ETF (FXY) and the S&P 500 have been moving opposite each other for the last 6-7 months. This is because the Yen represents a safe-haven (risk-off) and the S&P 500 represents a risky asset (risk on). Accordingly, FXY broke down in June and $SPX...
READ MORE
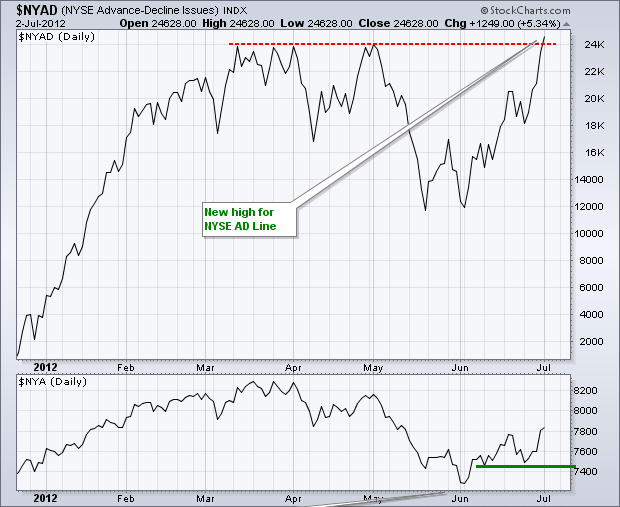
MEMBERS ONLY
Indicator Summary Turns Positive as NYSE AD Line Hits New High
by Arthur Hill,
Chief Technical Strategist, TrendInvestorPro.com
With a number of upgrades, the indicator summary turned positive this week. I am, however, concerned, that this positive switch could be short-lived because some key sectors are lagging and the AD Volume Lines have yet to turn bullish. Also note that the advance since June is looking like a...
READ MORE
MEMBERS ONLY
XLY Continues to Lag as UUP Surges off Support
by Arthur Hill,
Chief Technical Strategist, TrendInvestorPro.com
Central banks around the world continue to ease monetary policy and open the money spigots. The Bank of England increased its third quantitative easing program by 50 billion pounds, the European Central Bank (ECB) cut all kinds of rates on Thursday and China surprised the markets with another rate cut....
READ MORE
MEMBERS ONLY
KLA-Tencor Holds the Gap $KLAC
by Arthur Hill,
Chief Technical Strategist, TrendInvestorPro.com
KLA-Tencor (KLA) has an island reversal of sorts working the last three weeks. Notice how the stock gapped down in mid June and then back up in late June. Since gapping higher last week, the stock consolidated the last four days. A break above consolidation resistance would signal a continuation...
READ MORE
MEMBERS ONLY
MDY Leads with Breakout - USO Surges above Resistance
by Arthur Hill,
Chief Technical Strategist, TrendInvestorPro.com
Stocks have been trending higher since early June and the major index ETFs extended these trends on Monday-Tuesday. Uptrends suggest that the path of least resistance is up, but an economic avalanche over the next two days could make-or-break said trends. The European Central Bank (ECB) and Bank of England...
READ MORE
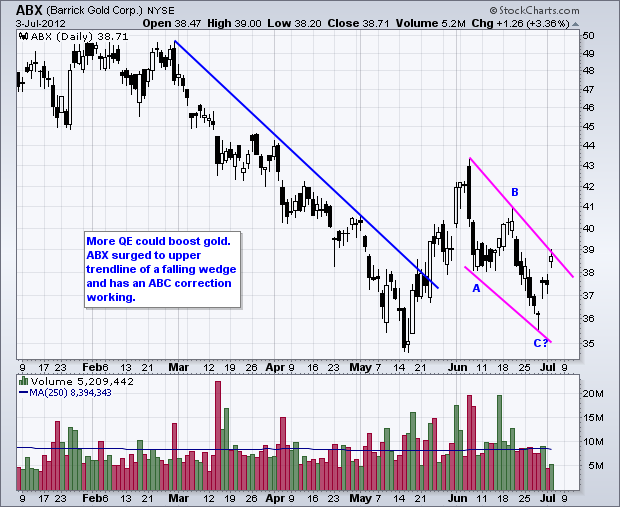
MEMBERS ONLY
Charts: ABX, AFFX, AMCC, CDE, FIO, FLEX, GFI, TEVA, WEN
by Arthur Hill,
Chief Technical Strategist, TrendInvestorPro.com
Charts of Interest: ABX, AFFX, AMCC, CDE, FIO, FLEX, GFI, TEVA, WEN
This commentary and charts-of-interest are designed to stimulate thinking. This analysis is not a recommendation to buy, sell, hold or sell short any security (stock ETF or otherwise). We all need to think for ourselves when it comes...
READ MORE
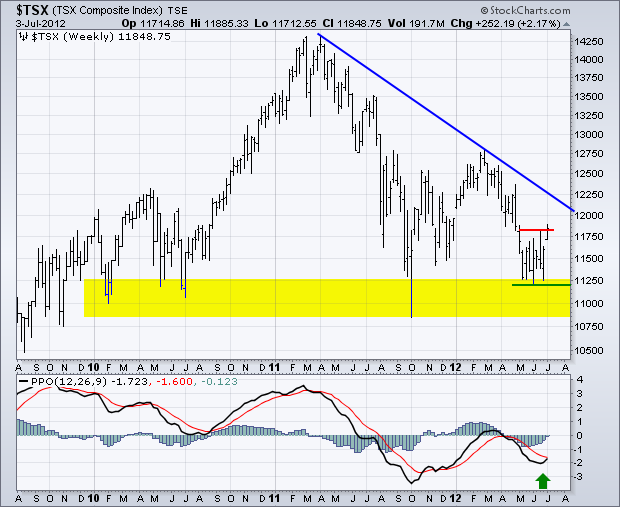
MEMBERS ONLY
TSX Composite Surges off Long-term Support
by Arthur Hill,
Chief Technical Strategist, TrendInvestorPro.com
The big trend is down since early 2011 and a big head-and-shoulders could be forming, but, for now, the TSX Composite is showing life with a surge off support that extends all the way back to early 2010. Also notice that MACD formed a higher low and is poised to...
READ MORE
MEMBERS ONLY
NYSE AD Line Shows Strength with New High
by Arthur Hill,
Chief Technical Strategist, TrendInvestorPro.com
Even though the NY Composite ($NYA) remains below its prior highs, the NYSE AD Line hit a new high this week and shows underlying strength. Advance-decline numbers measure the internal strength or weakness within an index. A new high in the AD Line shows internal strength that may carry thru...
READ MORE
MEMBERS ONLY
SPY Edges above June High as GLD Consolidates after Breakout
by Arthur Hill,
Chief Technical Strategist, TrendInvestorPro.com
The economic news was mixed on Monday. May construction spending hit its highest level in over 2 years. A decrease in public sector construction spending was offset by an increase in private sector spending. The ISM Manufacturing Index slipped below 50 (49.7), which is the first reading below 50...
READ MORE
MEMBERS ONLY
GLD and SPY Break Resistance ahead of Big Economic Week
by Arthur Hill,
Chief Technical Strategist, TrendInvestorPro.com
This broken week could be pivotal for the markets. The week is short with a July 4th break on Wednesday. Despite the shortened week, there are several key economic reports and the big employment report is Friday. The European induced surge is positive from a technical standpoint, but we need...
READ MORE
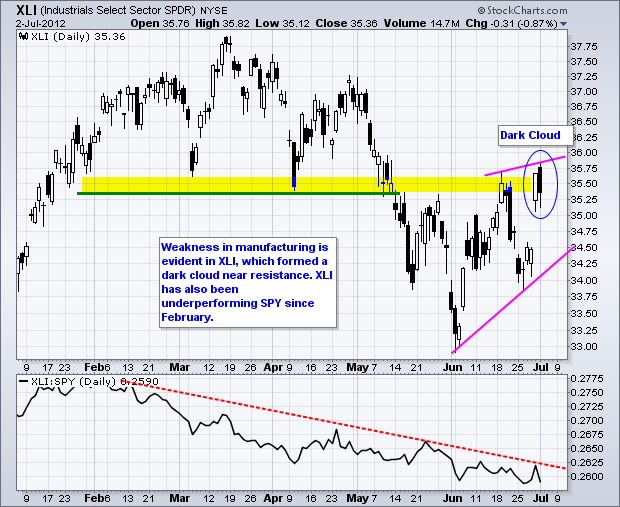
MEMBERS ONLY
Techs and Industrials Light up Sector Carpet
by Arthur Hill,
Chief Technical Strategist, TrendInvestorPro.com
The S&P Sector Carpet is full of green on Friday with the darkest green showing up in the technology and industrials sectors. The average gain in the tech sector is 3.4%, while the average gain in the industrial sector is 3%. There are isolate spots of red...
READ MORE
MEMBERS ONLY
Indicator Summary Improves as June Rally Extends
by Arthur Hill,
Chief Technical Strategist, TrendInvestorPro.com
The June run is set to continue with stock futures up sharply on Friday. Continued strength means the indicator summary is improving. Note that the NYSE AD Line and NYSE Net New Highs are bullish. The Bullish Percent Indices are bullish on the whole and the volatility indices fell sharply...
READ MORE
MEMBERS ONLY
SPY Holds Support for a Fifth Time - FXE Set to Surge
by Arthur Hill,
Chief Technical Strategist, TrendInvestorPro.com
Stocks ended mixed on Thursday as sharp rallies in the final hour paired losses significantly. The Nasdaq 100 ETF (QQQ) still lost over 1%, but the S&P Midcap SPDR (MDY) closed up .30% on the day. The nine sector SPDRs were mixed with four up and five down....
READ MORE
MEMBERS ONLY
XRT Underperforms - GLD Forms Bearish Pennant
by Arthur Hill,
Chief Technical Strategist, TrendInvestorPro.com
Stocks extended their oversold bounce with modest gains on Wednesday. All major index ETFs were up with the Russell 2000 ETF leading the way (+1.63%). The Dow Industrials SPDR, S&P 500 ETF and Nasdaq 100 ETF were up less than 1%. Eight of the nine sectors were...
READ MORE
MEMBERS ONLY
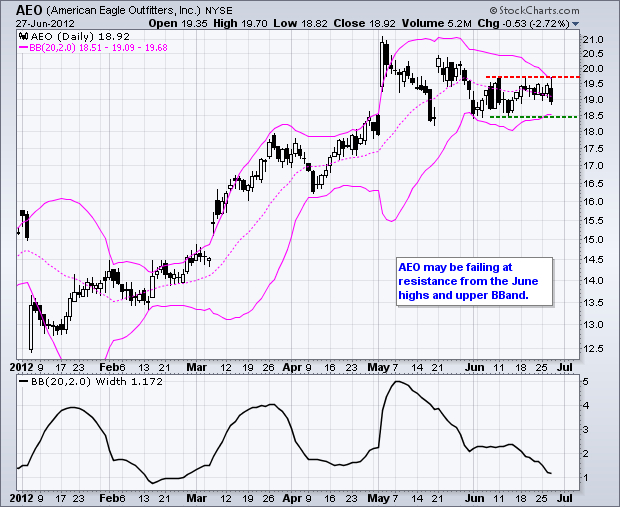
Charts of Interest: AEO, AMZN, AAPL, DRI, HOTT, SBUX, URBN
by Arthur Hill,
Chief Technical Strategist, TrendInvestorPro.com
AEO Fails at Resistance.
AAPL Stalls with Tablet War.
HOTT Does not Look so Hot.
Plus AMZN, DRI, SBUX, URBN
This commentary and charts-of-interest are designed to stimulate thinking. This analysis is not a recommendation to buy, sell, hold or sell short any security (stock ETF or otherwise). We all...
READ MORE
MEMBERS ONLY
Egyptian Stocks Surge after Election
by Arthur Hill,
Chief Technical Strategist, TrendInvestorPro.com
The Egypt Index ETF (EGPT) surged in the lead up to Hosni Mubarak's resignation and then declined as democratic elections were called. The decline ended when uncertainty became certainty and Mohammed Morsi was declared president on 24-June. With the correction holding above the December low, it looks like...
READ MORE
MEMBERS ONLY
SPY Gets Oversold Bounce - GLD Falls after Short Bounce
by Arthur Hill,
Chief Technical Strategist, TrendInvestorPro.com
Stocks got an oversold bounce on Tuesday with the S&P MidCap 400 SPDR (MDY) leading the way. The gains, however, were quite modest with MDY up just .67% and the S&P 500 ETF (SPY) edging higher by .50%. Nothing to write home about for sure. Stocks...
READ MORE
MEMBERS ONLY
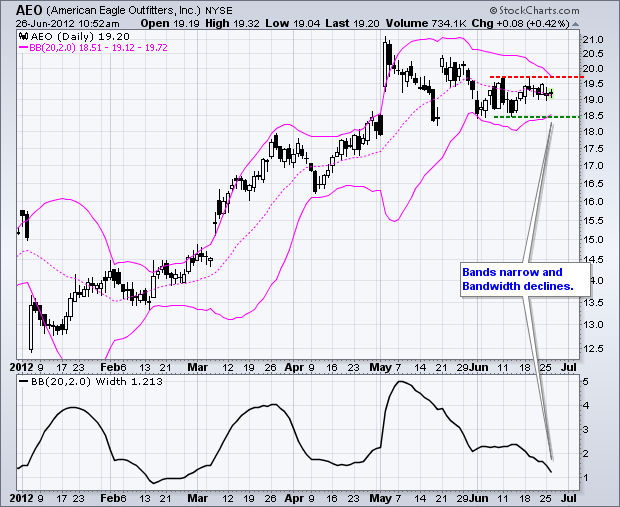
A Bollinger Band Squeeze for American Eagle
by Arthur Hill,
Chief Technical Strategist, TrendInvestorPro.com
American Eagle Outfitters (AEO) has been stuck in a consolidation since early May. Moreover, notice that this consolidation is narrowing as the Bollinger Bands contract. In the indicator window, Bollinger BandWidth is currently at its lowest level since February, which was scene of the last big contraction and breakout. Watch...
READ MORE
MEMBERS ONLY
SPX Sets Up Test of 200-day as GLD Recoups Support Break
by Arthur Hill,
Chief Technical Strategist, TrendInvestorPro.com
Stocks moved sharply lower on Monday with an extremely weak opening. The major index ETFs gapped down on the open, drifted lower throughout the morning and then edged off their lows in the afternoon. Even though selling pressure abated in the afternoon, buying pressure was certainly uninspiring and the gaps...
READ MORE
MEMBERS ONLY
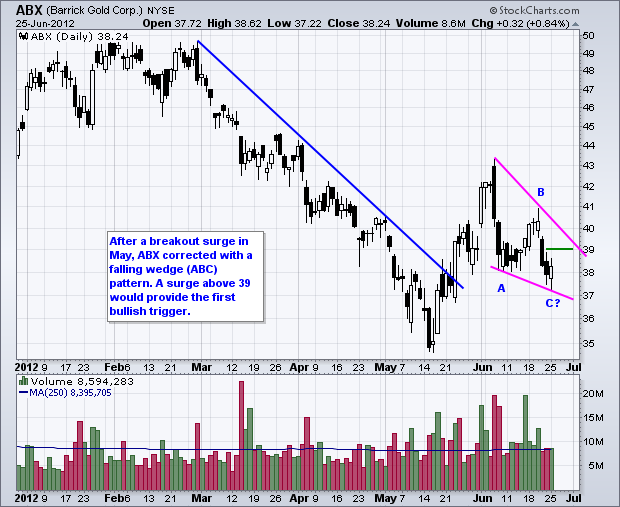
Charts of Interest: ABX, AFFX, CX, HD, MS, NVDA, UTHR
by Arthur Hill,
Chief Technical Strategist, TrendInvestorPro.com
ABX Forms ABC Falling Wedge.
HD Struggles at Resistance.
NVDA Tests Gap Zone with Small Wedge.
Plus AFFX, CX, MS, UTHR
This commentary and charts-of-interest are designed to stimulate thinking. This analysis is not a recommendation to buy, sell, hold or sell short any security (stock ETF or otherwise). We...
READ MORE
MEMBERS ONLY
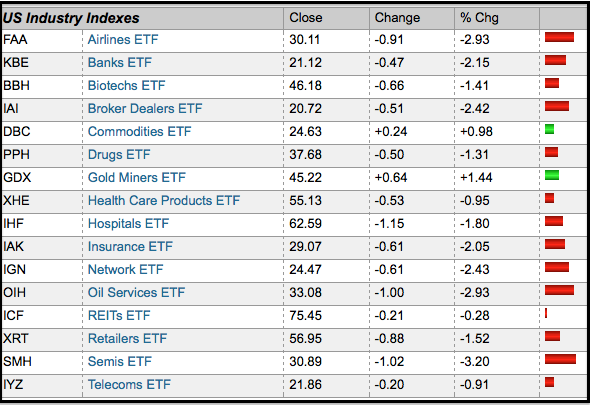
Finding Green in a Sea of Red
by Arthur Hill,
Chief Technical Strategist, TrendInvestorPro.com
Stocks were down sharply on Monday, but there were a two pockets of strength. The image below was taken from the ETF market summary. Notice that the Commodity Index Fund (DBC) and the Gold Miners ETF (GDX) are positive for the day. Also of note, gold, silver and corn were...
READ MORE
MEMBERS ONLY
SPY Breaks Wedge Support as UUP Breaks Wedge Resistance
by Arthur Hill,
Chief Technical Strategist, TrendInvestorPro.com
It is shaping up to be another big week on Wall Street and in Europe. On the news front, we have some key economic reports, another critical EU Summit and a potential ruling on healthcare reform. On the technical front, note that the major index ETFs failed at broken support...
READ MORE
MEMBERS ONLY
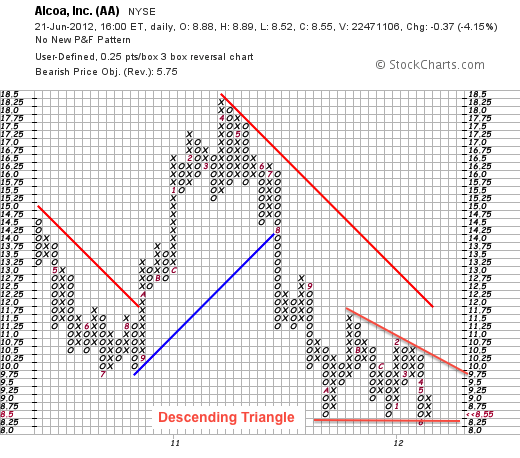
Alcoa Traces out Descending Triangle on Point & Figure Chart
by Arthur Hill,
Chief Technical Strategist, TrendInvestorPro.com
Alcoa (AA) is part of the Basic Materials SPDR (XLB) and in a clear downtrend. On the P&F chart (3 x .25), the stock broke to new lows in 2011 and then formed a descending triangle the last nine months. The red A marks October 2011 and the...
READ MORE
MEMBERS ONLY
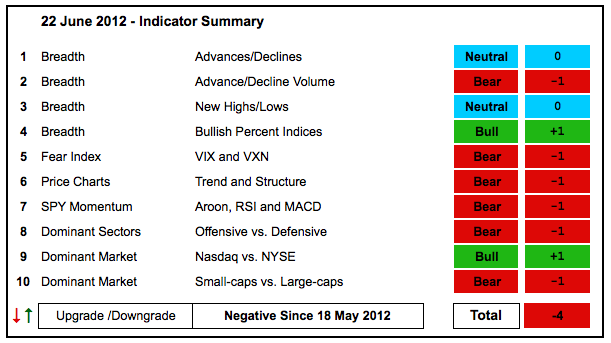
Indicator Summary Improves, But Remains Bearish Overall
by Arthur Hill,
Chief Technical Strategist, TrendInvestorPro.com
Stocks made a valiant run in June, but it was cut short with Thursday's sharp decline. Even though a few indicator groups were upgraded, the bulk of the evidence remains bearish. Strength within the NYSE, pushed the NYSE AD Line sharply higher and NYSE Net New Highs into...
READ MORE