MEMBERS ONLY
SPY Fails at Key Retracement - GLD Fails to Hold Breakout
by Arthur Hill,
Chief Technical Strategist, TrendInvestorPro.com
The market started the week in risk-on mode, but made a sharp u-turn on Thursday with a move to risk-off. The major index ETFs were down sharply with small-caps (IMW) and mid-caps (MDY) leading the way. Both lost over 2.5% on the day. All sectors were down with the...
READ MORE
MEMBERS ONLY
Sector Carpet Sees Red after the Fed
by Arthur Hill,
Chief Technical Strategist, TrendInvestorPro.com
The image below comes from the Sector Carpet. First, notice that all sectors are lower. Second, notice that the Basic Materials SPDR (XLB), Energy SPDR (XLE) and Technology SPDR (XLK) have the most red. The Consumer Discretionary SPDR (XLY) is not far behind. Third, notice that the defensive sectors (XLU,...
READ MORE
MEMBERS ONLY
XLV Forms Harami at Resistance as SCOTUS Looms
by Arthur Hill,
Chief Technical Strategist, TrendInvestorPro.com
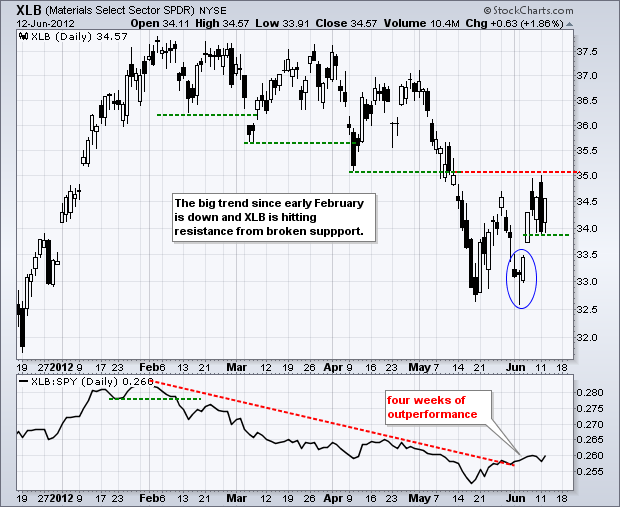
Stocks edged lower on Wednesday as the Fed failed to inspire a continuation of the current rally. Except for the Nasdaq 100 ETF (QQQ), which gained .08%, the major index ETFs closed fractionally lower. Seven of the nine sectors were down with the Industrials SPDR (XLI), Basic Materials SPDR (XLB)...
READ MORE
MEMBERS ONLY
Charts: AEO, BIDU, FFIV, FLEX, IDTI, LEN, OXY, STT, TOL
by Arthur Hill,
Chief Technical Strategist, TrendInvestorPro.com
AEO Extends Consolidation with Tight Triangle.
BIDU Shows Relative Weakness.
JBLU Consolidates after High Volume Surge.
Plus FFIV, FLEX, IDTI, LEN, OXY, RIMM, STT, TOL
This commentary and charts-of-interest are designed to stimulate thinking. This analysis is not a recommendation to buy, sell, hold or sell short any security (stock...
READ MORE
MEMBERS ONLY
CAKE Fails at Resistance as MACD Turns Lower
by Arthur Hill,
Chief Technical Strategist, TrendInvestorPro.com
Cheesecake Factory (CAKE) moved sharply lower at the beginning of June and then rebounded with the market the last few weeks. This rebound, however, is running into resistance from the gap and prior high. Also notice that MACD turned down and is on the verge of breaking below its signal...
READ MORE
MEMBERS ONLY
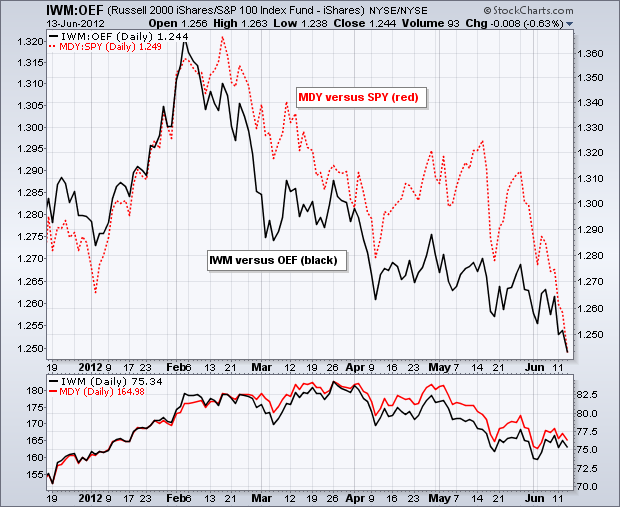
SPY, QQQ and IWM Hit Key Retracements
by Arthur Hill,
Chief Technical Strategist, TrendInvestorPro.com
Stocks moved higher again on Tuesday, but performance was lopsided again. The Russell 2000 ETF (IWM) led the market with a 1.73% gain, but the S&P 100 ETF (OEF) lagged with a .37% gain. Seven of the nine sectors were up. Money moved out of the Consumer...
READ MORE
MEMBERS ONLY
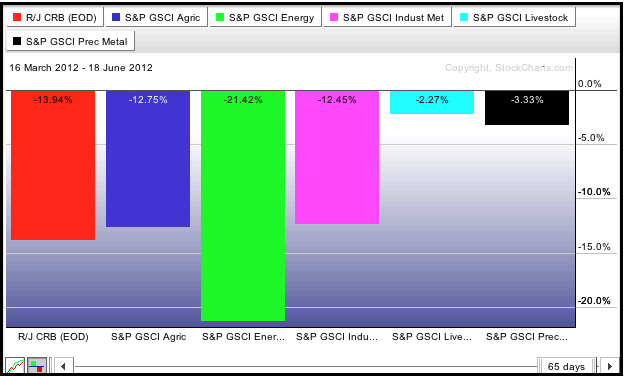
A Rough Three Months for Commodities
by Arthur Hill,
Chief Technical Strategist, TrendInvestorPro.com
The PerfChart below shows the three month performance for five commodity indices and the CRB Index ($CRB). All five are down and $CRB is down around 14%. Blame it on energy, which is down over 21%. Precious metals have held up relatively well with a decline less than 4%.
Click...
READ MORE
MEMBERS ONLY
SPY Maintains Rising Wedge Uptrend - USO Finds Support
by Arthur Hill,
Chief Technical Strategist, TrendInvestorPro.com
It was a mixed day for stocks with the Dow Industrials SPDR (DIA) moving lower and the Nasdaq 100 ETF (QQQ) moving higher. The market was weighed down by the Finance SPDR (XLF) and Energy SPDR (XLE), but lifted by the Technology SPDR (XLK) and the Consumer Discretionary SPDR (XLY)...
READ MORE
MEMBERS ONLY
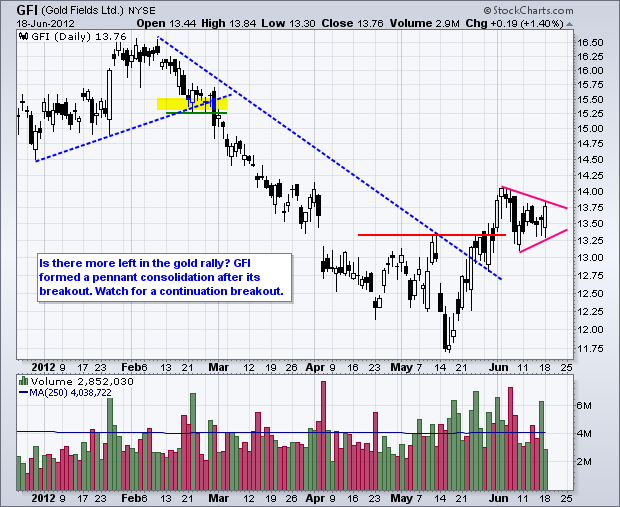
Charts of Interest: GFI, FICO, ISIL, ISRG, MOS, NYT, THC, TSN
by Arthur Hill,
Chief Technical Strategist, TrendInvestorPro.com
GFI Forms Pennant.
ISIL Surges on Big Volume.
MOS Breaks Inverse HS.
Plus FICO, ISRG, NYT, THC, TSN
This commentary and charts-of-interest are designed to stimulate thinking. This analysis is not a recommendation to buy, sell, hold or sell short any security (stock ETF or otherwise). We all need to...
READ MORE
MEMBERS ONLY
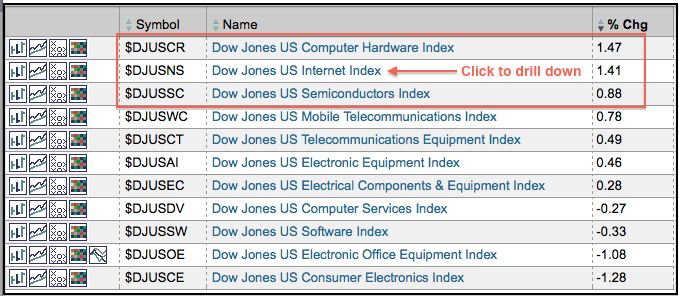
Sector Summary Shows Hardware, Internet and Semis Leading
by Arthur Hill,
Chief Technical Strategist, TrendInvestorPro.com
The image below, which stems from the sector summary at StockCharts.com, shows the key industry groups within technology sector. On Monday, computer hardware, internet and semiconductors were leading the way higher. Users can click on these names to see the individual stocks, which is a great way to identify...
READ MORE
MEMBERS ONLY
Bearish Wedge Takes Shape in SPY as TLT Holds Support
by Arthur Hill,
Chief Technical Strategist, TrendInvestorPro.com
And the results are in! Pro-bailout party New Democracy won the Greek election with around 30% of the vote. They will now have three days to form a coalition with a parliamentary majority. Now comes the tough stuff. The new government will need to renegotiate the austerity package, pass this...
READ MORE
MEMBERS ONLY
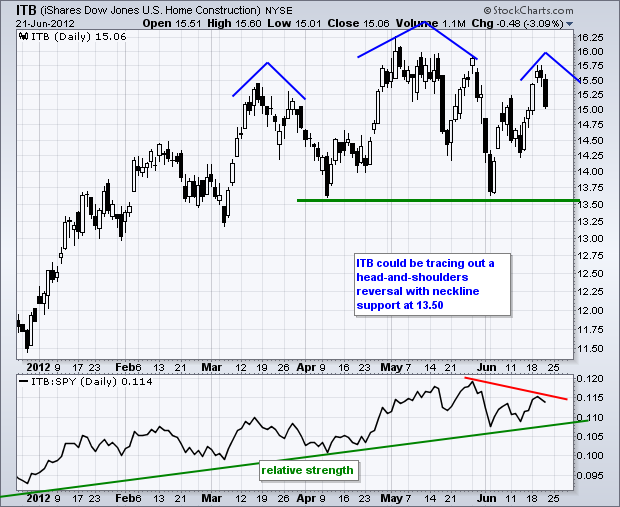
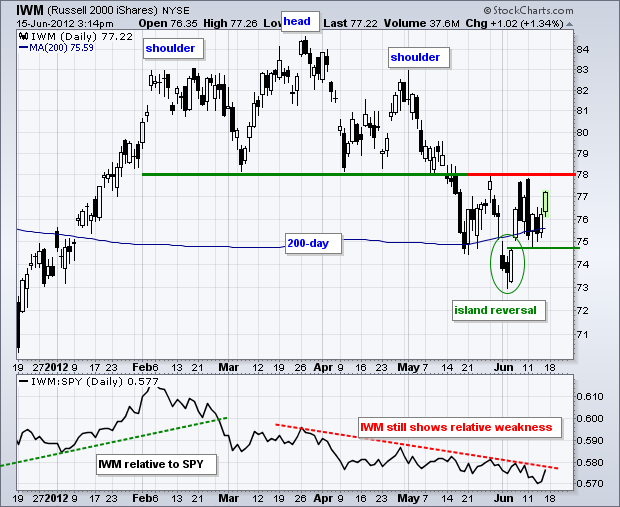
IWM Battles Broken Support and Relative Weakness
by Arthur Hill,
Chief Technical Strategist, TrendInvestorPro.com
The Russell 2000 ETF (IWM) got a bounce at the end of the week, but remains in a trading range since the June 6th gap. There are two dynamics at work on this chart. First, the medium-term trend is down after the ETF broke neckline support from a head-and-shoulders pattern....
READ MORE
MEMBERS ONLY
Stocks with Big Gains and Big Prices Lead the Dow Higher
by Arthur Hill,
Chief Technical Strategist, TrendInvestorPro.com
The Dow surged over 150 points on Thursday and broke above its May high. With only 30 stocks, chartists can use the CandleGlance feature at StockCharts.com to find which stocks led the move. The Dow is a price weighed average and the stocks with the highest price have the...
READ MORE
MEMBERS ONLY
AD Volume Lines Poised to Test Minor Resistance
by Arthur Hill,
Chief Technical Strategist, TrendInvestorPro.com
After a rebound last week, stocks turned flat this week and treaded water ahead of the Greek elections. The AD Volume Lines established minor resistance levels with the late May highs and breakouts would be short-term bullish. However, this would not be enough to turn medium-term bullish again. Also note...
READ MORE
MEMBERS ONLY
XLP Hits New High and XLV Breaks Resistance
by Arthur Hill,
Chief Technical Strategist, TrendInvestorPro.com
Stocks caught a bid on Thursday with the major index ETFs closing modestly higher. The Dow Industrials SPDR (DIA) led the way with a 1.19% advance. The Nasdaq 100 ETF (QQQ) lagged with a .37% advance. All sectors were up with the Energy SPDR (XLE) and Healthcare SPDR (XLV)...
READ MORE
MEMBERS ONLY
S&P MidCap 400 SPDR Forms Falling Flag ahead of Big Weekend
by Arthur Hill,
Chief Technical Strategist, TrendInvestorPro.com
There is a real gut check underway in the stock market. The S&P MidCap 400 SPDR (MDY) surged last week and then corrected the last 5-6 days with a falling flag/wedge. This could be a bullish continuation pattern, but one must wonder if the bulls have the...
READ MORE
MEMBERS ONLY
IWM Forms Falling Flag - XLY Shows Relative Weakness
by Arthur Hill,
Chief Technical Strategist, TrendInvestorPro.com
Stocks moved higher in the first half of the day and then lower in the second half. With the afternoon decline outpacing the morning advance, the major index ETFs closed modestly lower. Mid-caps led the decline with the S&P MidCap 400 SPDR (MDY) losing 1.34%. Small-caps were...
READ MORE
MEMBERS ONLY
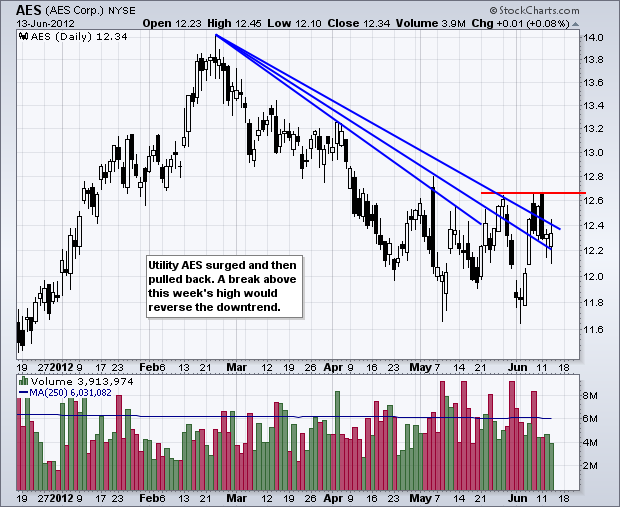
Charts of Interest: AES, APC, COV, LTD, MMM, SBUX
by Arthur Hill,
Chief Technical Strategist, TrendInvestorPro.com
LTD Forms Flat Flag after Sharp Decline.
MMM Forms Harami at Key Retracement.
SBUX Breaks Descending Triangle Support.
Plus AES, APC, COV
This commentary and charts-of-interest are designed to stimulate thinking. This analysis is not a recommendation to buy, sell, hold or sell short any security (stock ETF or otherwise)...
READ MORE
MEMBERS ONLY
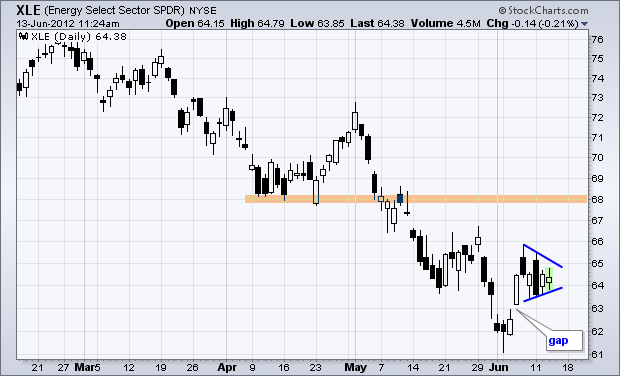
Energy SDDR Forms Pennant after Gap Higher
by Arthur Hill,
Chief Technical Strategist, TrendInvestorPro.com
The Energy SPDR (XLE) remains in a downtrend overall, but signs of life are appearing as the ETF gapped higher last week and formed a pennant over the last five days. A break above this short-term consolidation could signal a continuation of the early June bounce and target further strength...
READ MORE
MEMBERS ONLY
IWM Forms Inverse HS Pattern - GLD Bounces off Support
by Arthur Hill,
Chief Technical Strategist, TrendInvestorPro.com
Stocks rebounded after Monday's bearish reversal day with the major index ETFs gaining over 1%. The Dow Industrials SPDR (DIA) led the way with a 1.61% gain, while the S&P MidCap 400 SPDR (MDY) lagged with a 1.01% gain. Eight of nine sectors were...
READ MORE
MEMBERS ONLY
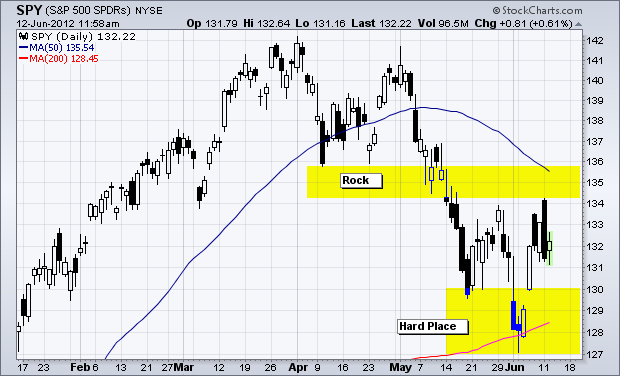
SPY is Stuck Between a Rock and a Hard Place
by Arthur Hill,
Chief Technical Strategist, TrendInvestorPro.com
No wonder the S&P 500 ETF (SPY) cannot make up its mind on direction. The ETF broke key support in mid May and the 50-day moving average turned lower. Combined with Monday's high, these no mark the rock or resistance zone. The support zone, or hard...
READ MORE
MEMBERS ONLY
SPY Fails at Resistance with Bearish Engulfing
by Arthur Hill,
Chief Technical Strategist, TrendInvestorPro.com
Stocks surged on the open with the S&P 500 exceeding 1335 in the first 5 minutes of trading. Selling pressure hit after five minutes of euphoria and the index closed below 1308. $SPX swung 2% from high to low and closed down over 1% on the day. Overall,...
READ MORE
MEMBERS ONLY
Charts of Interest: AEO, BXP, DRI, F, HAS, HES, TE, TOL, VLO
by Arthur Hill,
Chief Technical Strategist, TrendInvestorPro.com
AEO Forms Triangle as Retail Sales Report Looms.
HAS Shows Weakness with Pennant Break.
TE Breaks Falling Wedge Resistance with Good Volume.
Plus BXP, DRI, F, HES, TOL, VLO
This commentary and charts-of-interest are designed to stimulate thinking. This analysis is not a recommendation to buy, sell, hold or sell...
READ MORE
MEMBERS ONLY
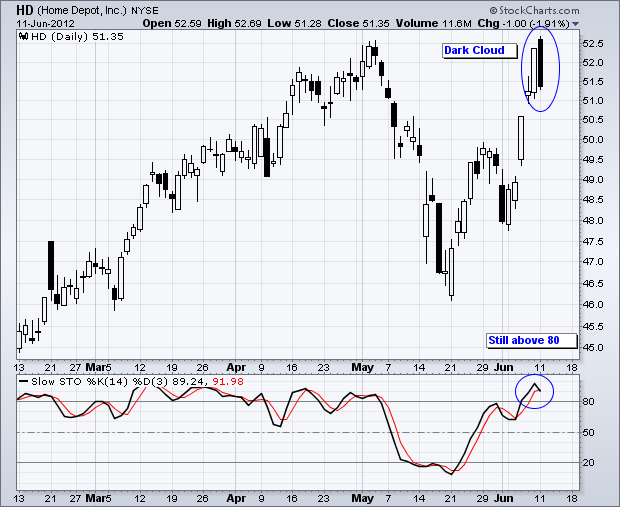
Bearish Engulfings and Dark Clouds Litter the Pre-defined Scan Page
by Arthur Hill,
Chief Technical Strategist, TrendInvestorPro.com
With a strong open and weak close on Monday, hundreds of stocks and ETFs formed either dark cloud patterns or bearish engulfing patterns. The chart below shows Home Depot (HD) forming a dark cloud near resistance and with the Stochastic Oscillator overbought. A move below 80 in the Stochastic Oscillator...
READ MORE
MEMBERS ONLY
SPY Poised to Break Late May High as GLD Holds Breakout
by Arthur Hill,
Chief Technical Strategist, TrendInvestorPro.com
Stocks opened weak on Friday, but rallied throughout the day and closed strong. Rumors of a Spanish bailout fueled los toros (the bulls). Small-caps led the way higher with the Russell 2000 ($RUT) gaining over 1% on the day. All nine sectors were up with the Finance SPDR (XLF) and...
READ MORE
MEMBERS ONLY
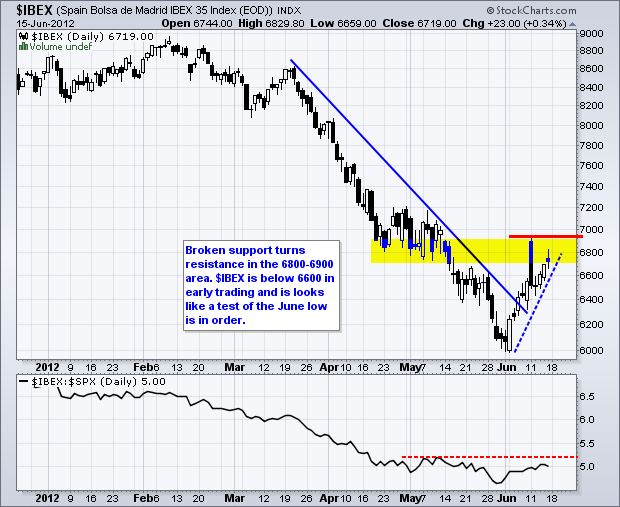
German DAX Index Continues to Show Relative Weakness
by Arthur Hill,
Chief Technical Strategist, TrendInvestorPro.com
The German DAX Index peaked around 7200 in mid March and moved below 6000 in early June. That's over 15% in less than three months. Despite looking oversold, there are no signs of a reversl as the index remains below its late May high. In the indicator window,...
READ MORE
MEMBERS ONLY
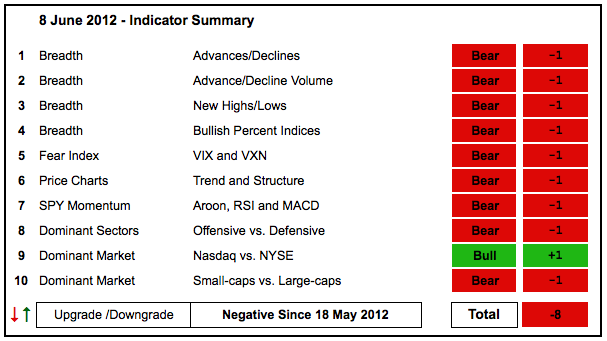
Oversold Bounce Not Enough to Influence Indicator Summary
by Arthur Hill,
Chief Technical Strategist, TrendInvestorPro.com
Stocks bounced this week, but the bounce was clearly not enough to rattle the indicator summary, which remains firmly negative. The AD Volume Lines surged, but remain well below their May support breaks and in downtrend. The major index ETFs also surged, but have yet to negate the May support...
READ MORE
MEMBERS ONLY
SPY Fails at Late May High - TLT Bounces off Broken Resistance
by Arthur Hill,
Chief Technical Strategist, TrendInvestorPro.com
Stocks asked for stimulus and failed to get what they wanted. The EU has yet to come forth with a concrete plan for EU banks, Bernanke did not offer hints of quantitative easing and the ECB stands ready to act. Allez, act already! Bernanke said the Fed would ease if...
READ MORE
MEMBERS ONLY
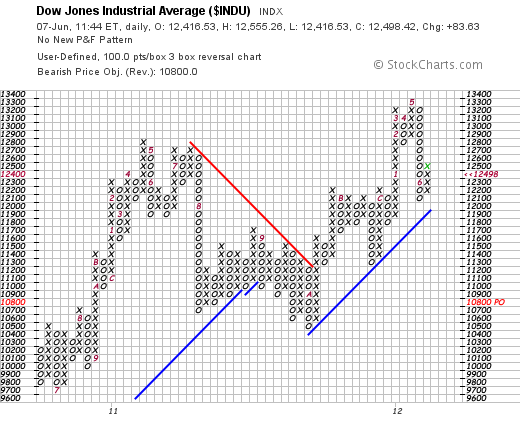
Dow Remains above Long Term Bullish Support Line on P&F Chart
by Arthur Hill,
Chief Technical Strategist, TrendInvestorPro.com
Despite a sharp decline in May-June, the Dow Industrials remains above the Bullish Support Line extending up from the October low. The red "A" marks the October column. This line sets support right at 12000. A break would reverse the current uptrend and require a red Bearish Resistance...
READ MORE
MEMBERS ONLY
SPY Gaps Up and Breaks May Trendline - GLD Stalls
by Arthur Hill,
Chief Technical Strategist, TrendInvestorPro.com
It was a classic stimulus-response rally on Wednesday. Wait, I did not see any actual stimulus. In reality, the market was anticipating stimulus in Europe, the US and elsewhere around the world. Rumors abound that the EU is poised to rescue Spanish banks and implement some sort of Euro-wide banking...
READ MORE
MEMBERS ONLY
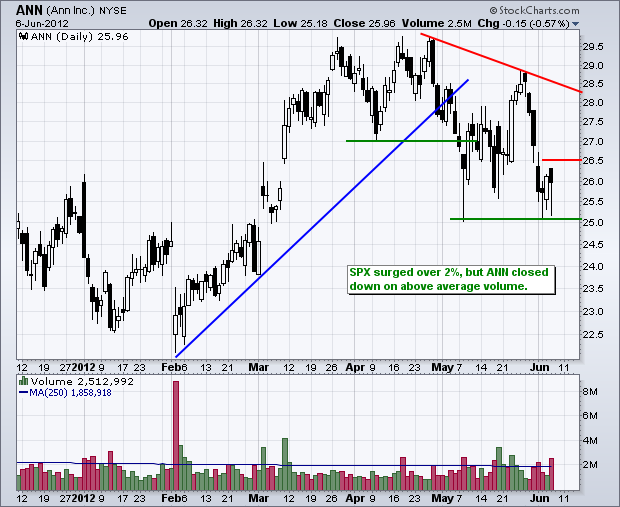
Charts of Interest: ANN, BAC, CCL, DDS, LH, ROL
by Arthur Hill,
Chief Technical Strategist, TrendInvestorPro.com
ANN Closes Lower and Shows Relative Weakness.
BAC Holds above Late May Low and Breaks Resistance.
ROL Shows Relative Strength with a Bull Flag.
Plus CCL, DDS, LH
This commentary and charts-of-interest are designed to stimulate thinking. This analysis is not a recommendation to buy, sell, hold or sell short...
READ MORE
MEMBERS ONLY
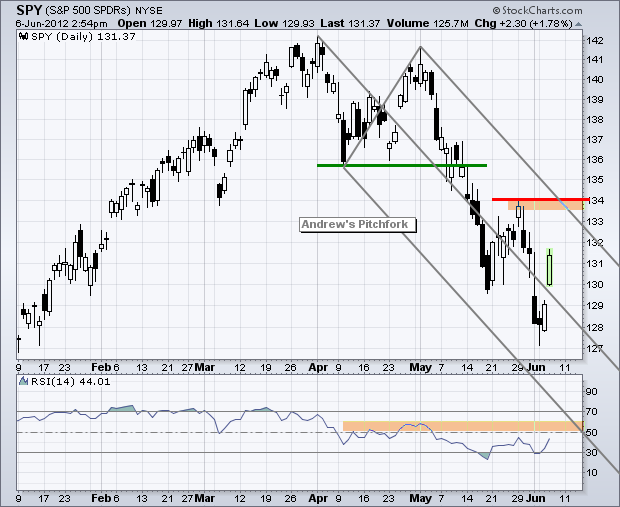
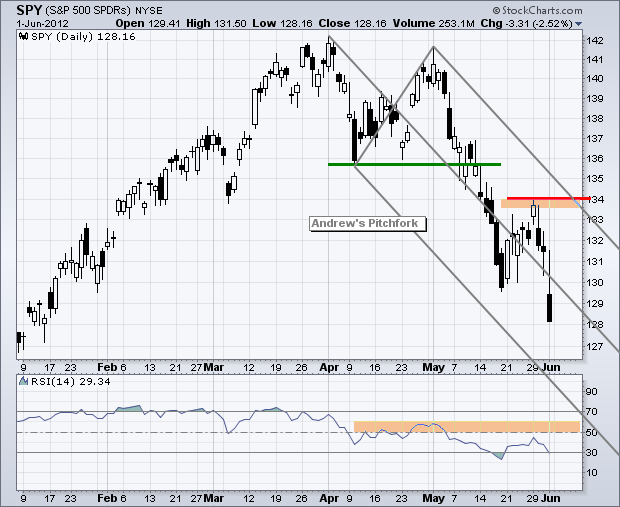
Marking SPY Resistance with Andrews' Pitchfork
by Arthur Hill,
Chief Technical Strategist, TrendInvestorPro.com
SPY is getting a nice oversold bounce with a gap up and Andrews' Pitchfork marks resistance in the 133 area. The pitchfork traces out a falling channel extending down from the April-May highs and the upper line crosses the 133 level next week. You can read more on Andrews...
READ MORE
MEMBERS ONLY
Midcaps Lead Rebound as Gold Holds its Breakout
by Arthur Hill,
Chief Technical Strategist, TrendInvestorPro.com
Stocks bounced on Monday with small-caps and mid-caps leading the way. The Russell 2000 ETF (IWM) gained around 1% and the S&P MidCap 400 SPDR (MDY) surged 2.05%. The chart below shows MDY forming a bullish engulfing as it surged back towards its 200-day moving average. While...
READ MORE
MEMBERS ONLY
Home Builders Turn Dark Green on the Market Carpet
by Arthur Hill,
Chief Technical Strategist, TrendInvestorPro.com
Stocks are rebounded on Tuesday with homebuilders leading the way. The S&P Sector Carpet shows the Lennar (LEN) and Pulte (PHM) leading within the consumer discretionary sector. On the price charts, PHM is bounced off its April low and LEN formed a bullish engulfing pattern.
Click this image...
READ MORE
MEMBERS ONLY
Techs Firm as XLK Forms Harami in Retracement Zone
by Arthur Hill,
Chief Technical Strategist, TrendInvestorPro.com
Stocks ended mixed on Monday with mid-caps showing relative weakness and large techs showing relative strength. The sectors were also mixed with five up and four down. The Finance SPDR (XLF) led the losers by falling almost 1%. Relative weakness in this key sector is a negative for the market...
READ MORE
MEMBERS ONLY
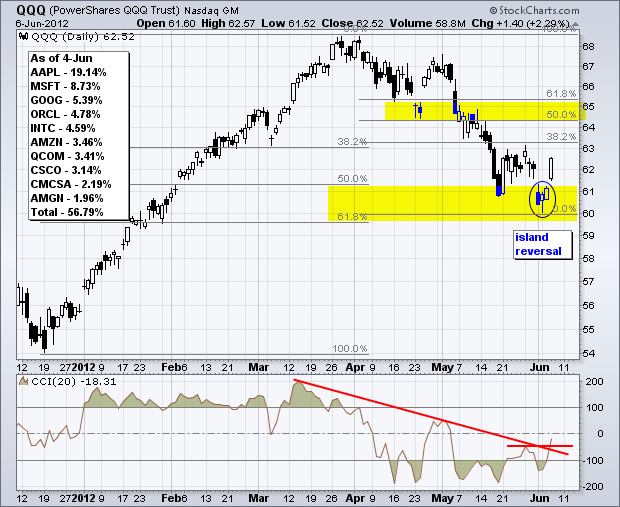
Charts of Interest: AAPL, AMGN, AMZN, CIEN, ORCL
by Arthur Hill,
Chief Technical Strategist, TrendInvestorPro.com
AAPL Shows Relative Strength.
AMZN Retraces 50-61.80% of Prior Surge.
ORCL Firms Just above Support Zone.
Plus $AMGN, $CIEN
This commentary and charts-of-interest are designed to stimulate thinking. This analysis is not a recommendation to buy, sell, hold or sell short any security (stock ETF or otherwise). We all...
READ MORE
MEMBERS ONLY
Utilities SPDR Leads and Forms a Bullish Cup-with-Handle Pattern
by Arthur Hill,
Chief Technical Strategist, TrendInvestorPro.com
The Utilities SPDR (XLU) is virtually alone at the top as it trades near a 52-week high. A bullish cup-with-handle is taking shape and a break above resistance would signal a continuation higher. After showing relative weakness from January to mid March, the ETF started outperforming in mid March as...
READ MORE
MEMBERS ONLY
Gold Breaks Resistance as Oil Becomes Severely Oversold
by Arthur Hill,
Chief Technical Strategist, TrendInvestorPro.com
Friday produced yet another round of economic reports that were below expectations and the stock market moved sharply lower. Even though EU issues may be lurking behind the scenes, don't forget that US economic reports have been falling short for two months now. While the employment numbers were...
READ MORE
MEMBERS ONLY
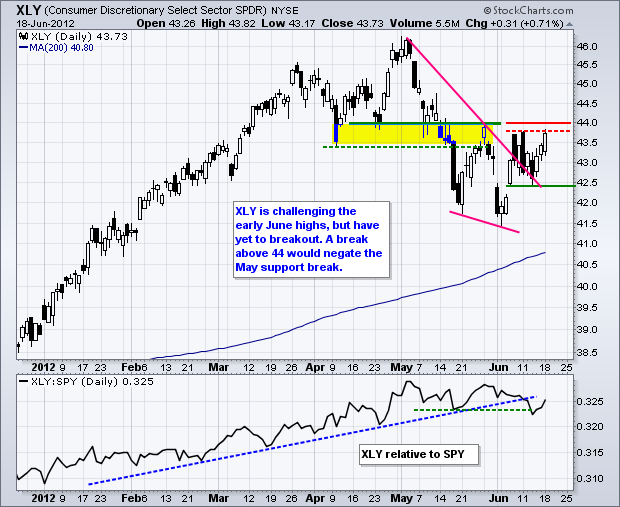
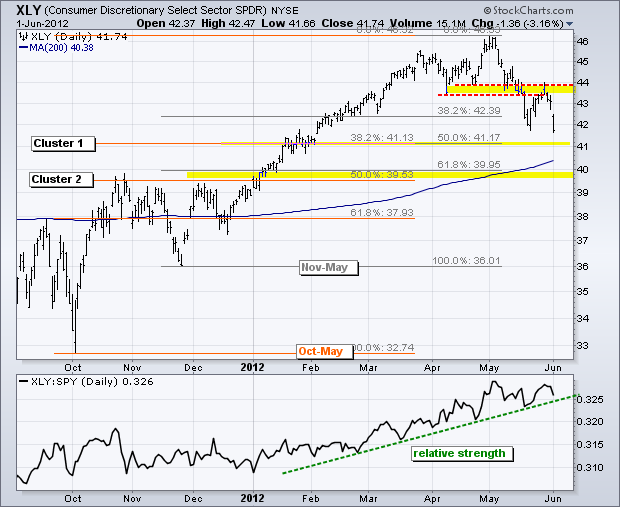
CONSUMER DISCRETIONARY SPDR GETS SQUASHED
by Arthur Hill,
Chief Technical Strategist, TrendInvestorPro.com
After a failure at broken support, the Consumer Discretionary SPDR (XLY) looks set for a move towards a Fibonacci cluster. The chart below shows XLY breaking support and becoming oversold in mid May. The ETF then bounced back to broken support and this area turned into resistance. It is not...
READ MORE
MEMBERS ONLY
5 and 7 Year Treasury Yields Dropping Like Rocks
by Arthur Hill,
Chief Technical Strategist, TrendInvestorPro.com
The chart below shows five different treasuries yields. Notice that five and seven year yields are falling the fastest as money moves into medium-term treasuries. After peaking on March 19th, the 5-year Treasury Yield ($UST5Y) and the 7-year Treasury Yield ($UST7Y) are down over 38% in less than three months....
READ MORE