MEMBERS ONLY
Big Banks Hold Big Breakouts and this Laggard May Play Catchup
by Arthur Hill,
Chief Technical Strategist, TrendInvestorPro.com
Several finance-related ETFs and stocks broke out with big moves from early October to early November. Many of these then stalled over the last two weeks and this rest could be the pause that refreshes. Today we will look at performance for the finance-related ETFs and the bull flags taking...
READ MORE
MEMBERS ONLY
There is (almost) Always Cause for Concern
by Arthur Hill,
Chief Technical Strategist, TrendInvestorPro.com
The S&P 500 SPDR and Nasdaq 100 ETF recorded new all time highs this past week, while the S&P MidCap 400 SPDR hit a new 52-week high in November. Sounds bullish, but the S&P SmallCap 600 SPDR and Russell 2000 ETF are still well...
READ MORE
MEMBERS ONLY
Don't Look Now, but New Highs are Expanding within the Small-cap Universe
by Arthur Hill,
Chief Technical Strategist, TrendInvestorPro.com
The number of stocks making new highs has been a lagging link in the breadth indicators this year. While the S&P 500 trades at a new high, the number of new highs within the index has yet to exceed 100 and get back to the levels seen in...
READ MORE
MEMBERS ONLY
Three Signs Showing that the Offense has Taken the Field
by Arthur Hill,
Chief Technical Strategist, TrendInvestorPro.com
The character of the stock market changed over the last six to seven weeks as the market took on a more offensive tone. Don't get me wrong. The stock market was already in bull mode and the S&P 500 has been above its 200-day SMA since...
READ MORE
MEMBERS ONLY
Small-Caps Come Alive, but Microcaps Fall Short
by Arthur Hill,
Chief Technical Strategist, TrendInvestorPro.com
The Russell 2000 ETF is finally showing signs of an uptrend with the first higher-low/higher-high sequence in six months. The chart below shows the Russell 1000 ETF (IWB), the Russell 2000 ETF (IWM) and the Russell Microcap ETF (IWC) to compare highs and lows. Chartists can use this technique...
READ MORE
MEMBERS ONLY
New High Parade Extends - What About the Consumer Discretionary SPDR?
by Arthur Hill,
Chief Technical Strategist, TrendInvestorPro.com
The new high parade continued this week with the S&P 500 SPDR and four sector SPDRs hitting new highs. The Technology SPDR (XLK), Industrials SPDR (XLI), Finance SPDR (XLF) and Materials SPDR (XLB) recorded new 52-week highs. The Healthcare SPDR (XLV) recorded a new high for 2019, but...
READ MORE
MEMBERS ONLY
How to Distinguish between Selective and Indiscriminate Advances
by Arthur Hill,
Chief Technical Strategist, TrendInvestorPro.com
The Nasdaq AD Line is not keeping pace with the Nasdaq Composite, but this is not bearish for the Nasdaq or the market as a whole. Note that the Nasdaq hit a new high in July and again on November 1st, even though the Nasdaq AD Line has been falling...
READ MORE
MEMBERS ONLY
Biotech ETF Makes a Statement
by Arthur Hill,
Chief Technical Strategist, TrendInvestorPro.com
The Biotech ETF (IBB) is making a bullish statement with recent developments in momentum, volume and trend. IBB is also outperforming its counter part, the Biotech SPDR (XBI), over the last two months.
The chart below shows IBB surging around 10% from the early October low to the current high....
READ MORE
MEMBERS ONLY
Stock Market is Not Firing on All Cylinders
by Arthur Hill,
Chief Technical Strategist, TrendInvestorPro.com
The market as a whole is not firing on all cylinders, but that is not really important. What, then, is important?
We cannot expect a perfectly bullish stock market and rising tide that lifts all boats, as was the case in 2013 and 2017. Instead, we need to know which...
READ MORE
MEMBERS ONLY
Anatomy of a Classic a Bullish Continuation Pattern - And a Live Example
by Arthur Hill,
Chief Technical Strategist, TrendInvestorPro.com
Bullish continuation patterns are my favorite patterns when it comes to stocks and ETFs. As the name suggests, bullish continuation patterns, when confirmed, signal a continuation of the prior trend. Furthermore, because it is a "bullish" continuation, it means the prior trend was up and that trend is...
READ MORE
MEMBERS ONLY
XLI and XLF Zigzag Higher and Underpin Bullish Thesis - Grand Opening
by Arthur Hill,
Chief Technical Strategist, TrendInvestorPro.com
The Industrials SPDR (XLI) and Finance SPDR (XLF) are two of the big six sectors in the S&P 500 and both are moving in the right direction: up.
The Industrials sector accounts for 9.32% of the S&P 500, while the Finance sector accounts for 13....
READ MORE
MEMBERS ONLY
A Mixed Market as Earnings Season Hits
by Arthur Hill,
Chief Technical Strategist, TrendInvestorPro.com
While the S&P 500 and large-caps hold up well, small-caps and mid-caps continue to trade mixed. This suggest that the average stock is trading mixed, some up and some down. Even though we are not in a bear market environment, stock picking is challenging right now and we...
READ MORE
MEMBERS ONLY
Few New Highs, but Even Fewer New Lows
by Arthur Hill,
Chief Technical Strategist, TrendInvestorPro.com
The lack of new highs may seem like a concern, but one cannot talk about new highs without also looking at new lows because there are two sides to the story. The S&P 500 is within 2% of an all time high and there were just 28 new...
READ MORE
MEMBERS ONLY
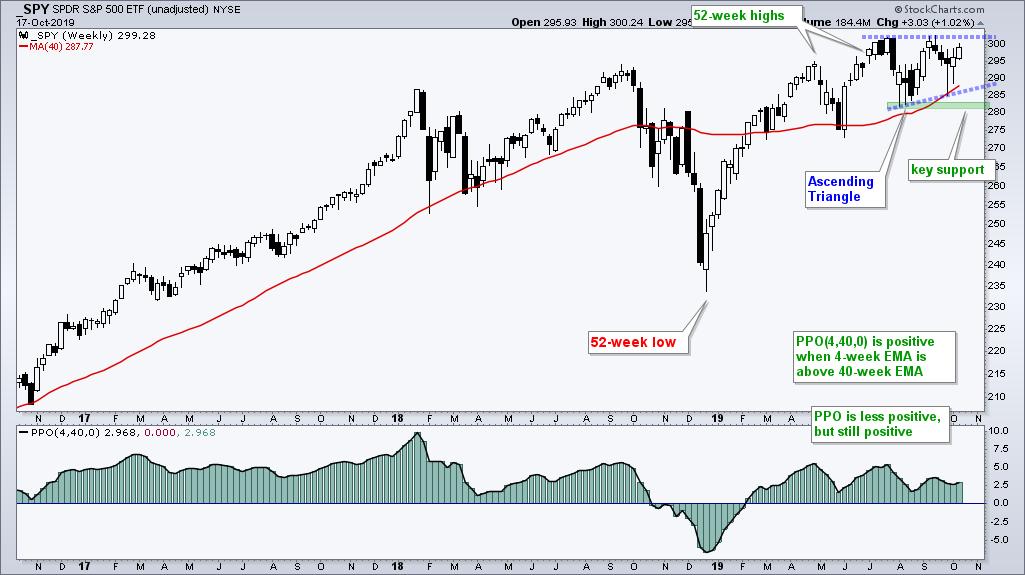
The State of the Stock Market - Waning Upside Momentum is Normal - A Special Announcement
by Arthur Hill,
Chief Technical Strategist, TrendInvestorPro.com
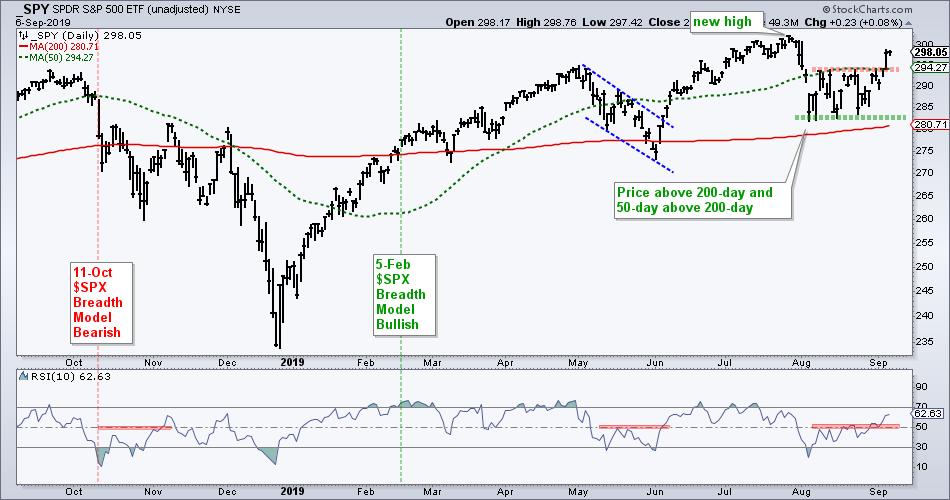
The S&P 500 SPDR (SPY) hit a new high in July and then moved into a trading range the last few months. Momentum turned down during this trading range and this is perfectly normal during a consolidation. Today will look at a weekly chart pattern taking shape and...
READ MORE
MEMBERS ONLY
Ranking and Grouping ETFs - Emerging Markets ETF Challenges Key Level - Big Announcement
by Arthur Hill,
Chief Technical Strategist, TrendInvestorPro.com
Today's report on StockCharts is short because the full report can be found at my new website, TrendInvestorPro.com. More details below. For now, I will leave you with the Core Emerging Markets ETF (IEMG) as its technical picture improves. The chart for IEMG looks similar to the...
READ MORE
MEMBERS ONLY
Follow Through Day or Not?
by Arthur Hill,
Chief Technical Strategist, TrendInvestorPro.com
Follow Through Day or Not? Stocks started Friday with a bang as the S&P 500 SPDR (SPY) gapped above 296 and held this gap throughout the day, despite a sell off in the final 30 minutes. Does this count as a "follow through" day? It is...
READ MORE
MEMBERS ONLY
Eight Stock Setups for the Coming Week
by Arthur Hill,
Chief Technical Strategist, TrendInvestorPro.com
It is time for another round of weekend stock setups. Last weekend I featured seven semiconductor stocks and these are performing well. Two weeks ago I featured a hodgepodge of stocks with mixed results.
The S&P 500 is trending higher, the Index and Sector Breadth Models are net...
READ MORE
MEMBERS ONLY
State of the Stock Market - Key Assumptions Determine Probabilities
by Arthur Hill,
Chief Technical Strategist, TrendInvestorPro.com
My assumptions and biases are based on the bigger trend because it is the dominant force at work. When the trend is up, I view the cup as half full and expect more bullish resolutions than bearish resolutions. This means I favor bullish setups over bearish setups, successful support tests...
READ MORE
MEMBERS ONLY
Ranking and Grouping ETFs - Key Large-cap ETFs at Moment of Truth - Many More Downtrends than Uptrends
by Arthur Hill,
Chief Technical Strategist, TrendInvestorPro.com
The goal of this commentary is to cut through the day-to-day noise and focus on price action that actually matters. Noise can be in the form of news or random price fluctuations. Either way, we are often better off when we filter the noise and focus on what really matters....
READ MORE
MEMBERS ONLY
State of the Stock Market - A Stock Picker's Market
by Arthur Hill,
Chief Technical Strategist, TrendInvestorPro.com
The S&P 500 and Nasdaq 100 remain in good shape, the Russell 2000 remains in bad shape and the S&P MidCap 400 is caught in the middle. I am not going to read too much into relative and absolute weakness in small-caps because the Russell 2000...
READ MORE
MEMBERS ONLY
Semiconductor ETFs Hold Up and Lead Tech - Plus 7 Semiconductor Stock Setups
by Arthur Hill,
Chief Technical Strategist, TrendInvestorPro.com
Semiconductors are holding up relatively well over the last few weeks. While many stocks and ETFs broke their August lows, the Semiconductor SPDR (XSD) held its August low and the Semiconductor ETF (SOXX) did not even test its August lows. Today we will compare and contrast the two ETFs and...
READ MORE
MEMBERS ONLY
Using New Highs and Lows to Track Trends in Two Timeframes
by Arthur Hill,
Chief Technical Strategist, TrendInvestorPro.com
Today we are going to show how 52-week highs and lows can be used to track long-term and short-term trends in the S&P 500. Full disclosure: this is not the holy grail. It is one indicator that can be used in conjunction with others to keep you on...
READ MORE
MEMBERS ONLY
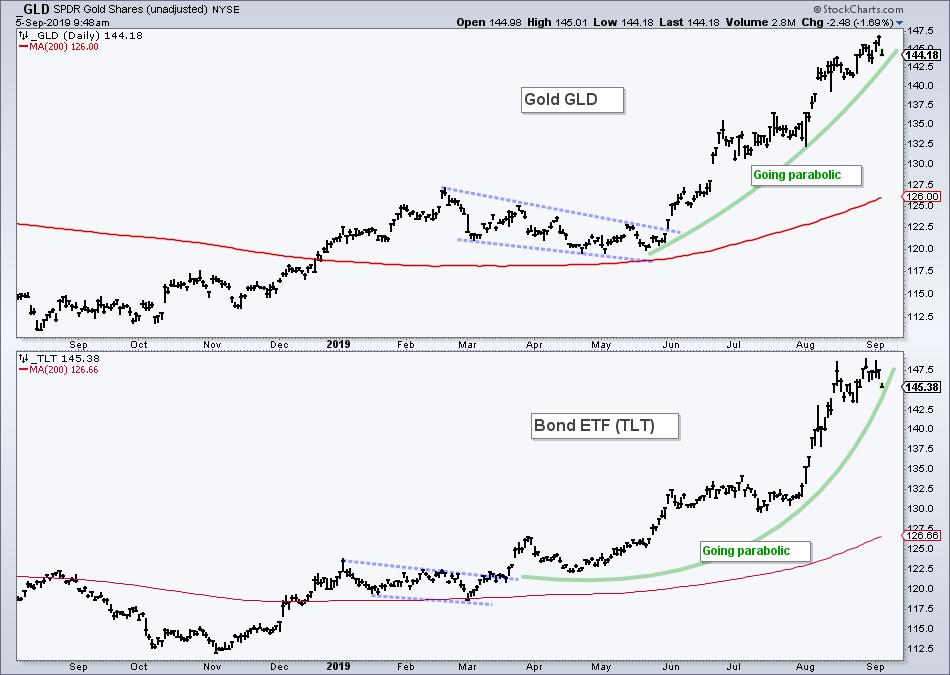
Ranking and Grouping ETFs - SPY Consolidates, GLD Flies the Flag and SOXX Holds Strong
by Arthur Hill,
Chief Technical Strategist, TrendInvestorPro.com
We will start with the S&P 500 SPDR (SPY) and the S&P 500 EW ETF (RSP), two versions of the same 500 or so stocks. These are the most important benchmarks to watch when it comes to the broader market. As such, I will use these...
READ MORE
MEMBERS ONLY
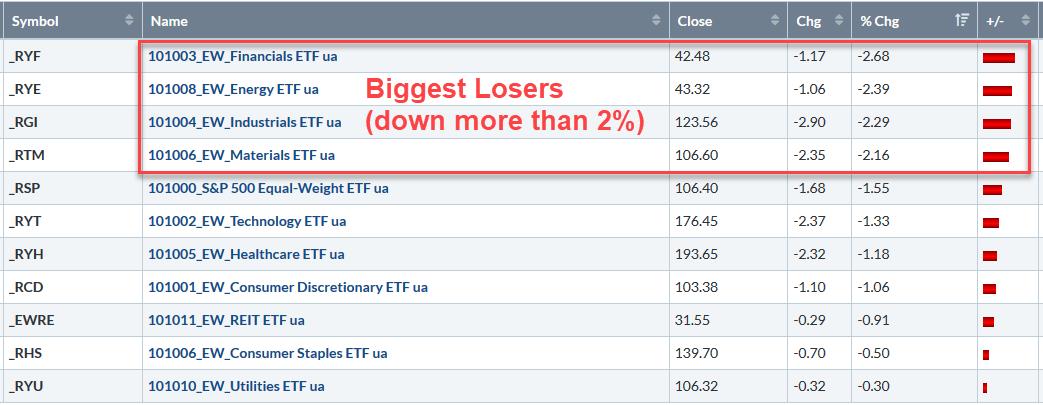
Some Key Equal-Weight Sectors are Under Pressure
by Arthur Hill,
Chief Technical Strategist, TrendInvestorPro.com
Stocks in the Industrials and Finance sectors were hit especially hard on Tuesday with XLI and XLF falling more than 2%. The Technology and Consumer Discretionary sectors held up better than the broader market by falling less than 1%. Nevertheless, these four offensive sectors were down on the day. The...
READ MORE
MEMBERS ONLY
Follow Up to Sunday Setups - When is the Rationale Invalidated?
by Arthur Hill,
Chief Technical Strategist, TrendInvestorPro.com
Several of the Sunday Setups were hit hard on Tuesday as selling pressure hit the Finance, Industrials and Materials sectors quite hard. Five of the eleven stocks came from these sectors (PFG, USB, HON, FAST and PKG). Nine of the Eleven are down over the last two days. KMX and...
READ MORE
MEMBERS ONLY
Sunday Setups - 11 Stocks to Watch this Week
by Arthur Hill,
Chief Technical Strategist, TrendInvestorPro.com
After running some scans, scrolling through the charts and filtering the setups, I came up with a dozen stocks to watch for next week, and perhaps beyond. All are above their rising 200-day SMAs and in uptrends of some sort.
These stocks are also showing short-term relative strength. Eight of...
READ MORE
MEMBERS ONLY
3 Breadth Indicators to Watch Next Week - SOXX Holds up Tech
by Arthur Hill,
Chief Technical Strategist, TrendInvestorPro.com
Today I will expand and update the key breadth indicators for the S&P 500. Notably, I added two more early warning indicators to the mix. They have yet to trigger, but these added indicators will give us something to watch going forward.
I will also update the charts...
READ MORE
MEMBERS ONLY
The State of the Stock Market - Concerns Versus Evidence
by Arthur Hill,
Chief Technical Strategist, TrendInvestorPro.com
This weekly commentary, featuring the S&P 500, Index Breadth Model and Sector Breadth Model, is designed to provide an unbiased view of the current stock market environment. Models, while not perfect, provide a clear process driven approach for evaluating the market. Focusing on present signals, instead of future...
READ MORE
MEMBERS ONLY
ETF Ranking and Grouping - Staples and Utes Leading, while Software and Biotech Looking Vulnerable
by Arthur Hill,
Chief Technical Strategist, TrendInvestorPro.com
Today's report will rank and group my core ETF universe from strong uptrends to clear downtrends. Most of these ETFs are stock ETFs, but I also include several bond-related ETFs and a few commodity ETFs in my universe.
The defensive groups continue to dominate with consumer staples, utilities...
READ MORE
MEMBERS ONLY
There May be Trouble Ahead - SPY, QQQ and IWM Update
by Arthur Hill,
Chief Technical Strategist, TrendInvestorPro.com
My headlines are often inspired by tunes, and this one is a classic going back to 1936 and Fred Astaire. No, I am not old enough to have seen it live on TV, but I've heard plenty of remakes. Even though there may be trouble ahead, I am...
READ MORE
MEMBERS ONLY
What to Watch Next Week in the Major Index ETFs - SPY, QQQ, IWM
by Arthur Hill,
Chief Technical Strategist, TrendInvestorPro.com
Normally I ignore resistance levels in uptrends and support levels in downtrends. Resistance levels are not that important because higher highs are expected in an uptrend. The assumption is that a trend in motion stays in motion so a break above the prior peak is considered normal. Support levels, on...
READ MORE
MEMBERS ONLY
Capturing Mean-Reversion Signals and Trend Direction with One Indicator - Facebook Example
by Arthur Hill,
Chief Technical Strategist, TrendInvestorPro.com
Mean-reversion signals provide a great way to trade in the direction of the bigger uptrend after a pullback. The trick is to identify the bigger uptrend and then capture mean-reversion setups. Mean-reversion setups materialize after a pullback within the uptrend. The strategy is based on the assumption that prices will...
READ MORE
MEMBERS ONLY
State of the Stock Market - Meet the New Leaders, Same as the Old Leaders
by Arthur Hill,
Chief Technical Strategist, TrendInvestorPro.com
The resurgence of small-caps has been greatly exaggerated. Consider this. The S&P 500 SPDR (_SPY) bottomed on August 5th and broke above its August highs on September 5th. The Russell 2000 iShares (_IWM) bottomed on August 27th and broke above its August highs on September 10th. SPY bottomed...
READ MORE
MEMBERS ONLY
Ranking and Grouping Key ETFs - Tech-related ETFs Hit Moment of Truth, while Biotech ETFs Find Support
by Arthur Hill,
Chief Technical Strategist, TrendInvestorPro.com
After studying the charts in my core ETF list, I came up with eight groupings. The top three groups represent ETFs that are still in uptrends, while the bottom three groups represent ETFs that are in downtrends and lagging overall. The middle groups are in flux. Group 4 represents ETFs...
READ MORE
MEMBERS ONLY
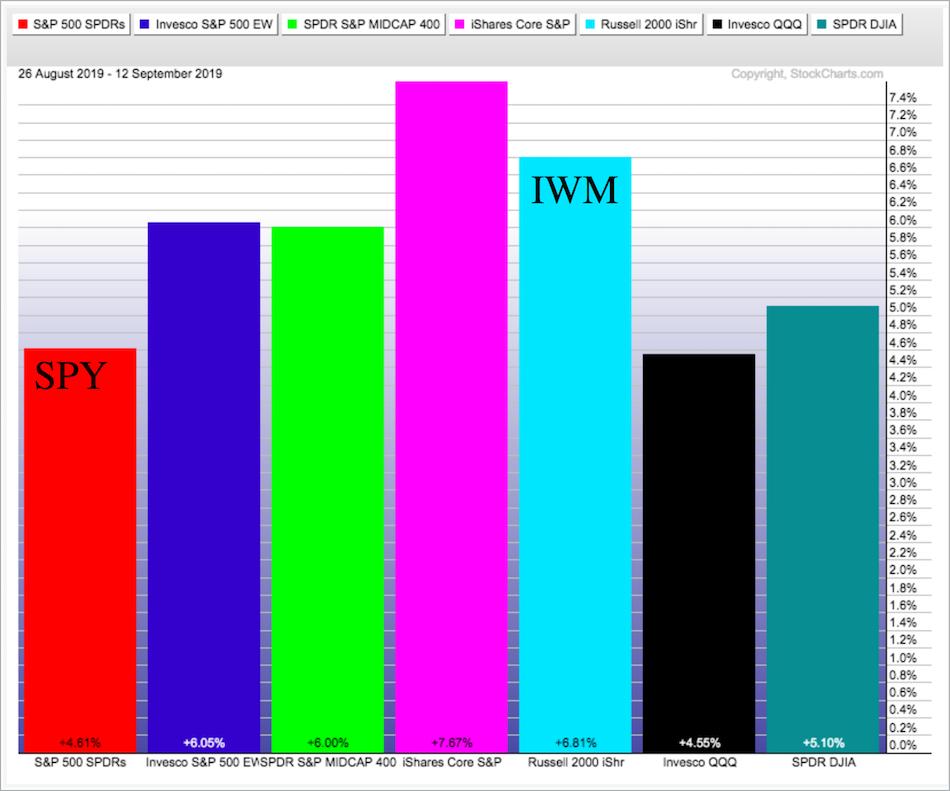
Moment-of-truth for Small-cap and Regional Bank ETFs
by Arthur Hill,
Chief Technical Strategist, TrendInvestorPro.com
The S&P SmallCap iShares (IJR) and Russell 2000 iShares (IWM) are leading the market in September with 8.22% and 7.66% gains, respectively. As the PerfChart below shows, these gains are more than double the gains in the S&P 500 SPDR (SPY), Nasdaq 100 ETF...
READ MORE
MEMBERS ONLY
Are Recent Rotations within the Stock Market Bullish or Bearish?
by Arthur Hill,
Chief Technical Strategist, TrendInvestorPro.com
There are still plenty of strong uptrends out there in ETF land, but we are seeing a bit of rotation in the stock market. The Utilities SPDR (XLU), Real Estate SPDR (XLRE) and Consumer Staples SPDR (XLP) remain in uptrends, but they corrected the last six days as some out...
READ MORE
MEMBERS ONLY
Index Breadth Model Improves as IWM Challenges Resistance
by Arthur Hill,
Chief Technical Strategist, TrendInvestorPro.com
Stocks surged the last 12 days with small-caps leading the way higher. The Russell 2000 iShares (IWM) is up 6.8% and the S&P 500 SPDR (SPY) is up 4.6%. Even though small-caps are leading short-term, they are still lagging on the three and six month timeframes....
READ MORE
MEMBERS ONLY
Big Changes in the Index and Sector Breath Models
by Arthur Hill,
Chief Technical Strategist, TrendInvestorPro.com
It was a big week for stocks and the breadth indicators backed up the bullish price action. The S&P 500 SPDR (SPY) broke out of its August range to signal a continuation of the bigger uptrend. Even though the Index Breadth Model turned bearish in mid August, the...
READ MORE
MEMBERS ONLY
Four Keys to Finding Meaningful Bullish Reversal Patterns - with Two Live Examples
by Arthur Hill,
Chief Technical Strategist, TrendInvestorPro.com
Major bullish reversal patterns signal the start of new up trends that can extend and be very profitable. However, chartists must first learn to distinguish between meaningful patterns and irrelevant patterns. Here's how...
There are three parts to a major bullish reversal pattern. First, there is the price...
READ MORE
MEMBERS ONLY
Semis Extend Bounce off Key Retracement - XLI and XLF Surge off Support - Ranking and Grouping Key ETFs
by Arthur Hill,
Chief Technical Strategist, TrendInvestorPro.com
Today we will rank and group the key ETFs that I follow. Instead of showing all five groups, like in last week's commentary, I will focus the middle three groups, which I think are the most interesting and still have potential. I am not even going to cover...
READ MORE