MEMBERS ONLY
DOW THEORY SELL SIGNAL NOW IN FORCE
by Arthur Hill,
Chief Technical Strategist, TrendInvestorPro.com
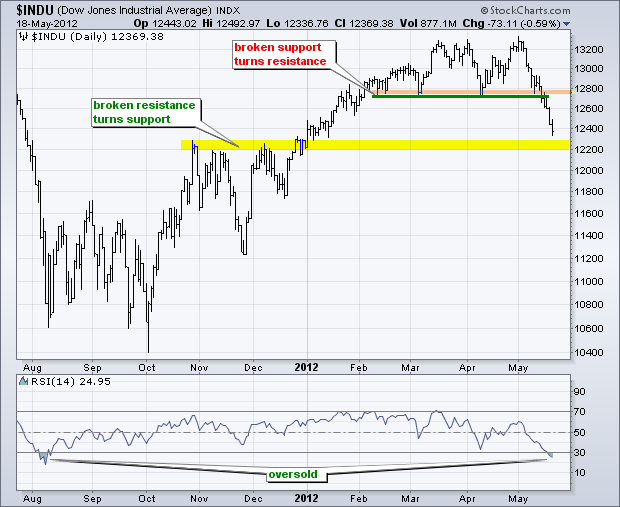
With big declines this past week, the Dow Industrials and Dow Transports both broke support levels and forged lower lows. Confirmed lower lows amount to a Dow Theory sell signal. The first chart shows the Dow Industrials forming a double top and breaking double top support with a decline below...
READ MORE
MEMBERS ONLY
30-year Treasury Yield Breaks Wedge Support
by Arthur Hill,
Chief Technical Strategist, TrendInvestorPro.com
The 30-year Treasury Yield ($TYX) broke down with a sharp decline the last few weeks. This puts the yield near its 2011 lows and within striking distance of its 2008 lows, scene of the last crisis and flight to safety. Notice that treasury yields and the S&P...
READ MORE
MEMBERS ONLY
Indicator Summary Turns Negative as Selling Accelerates
by Arthur Hill,
Chief Technical Strategist, TrendInvestorPro.com
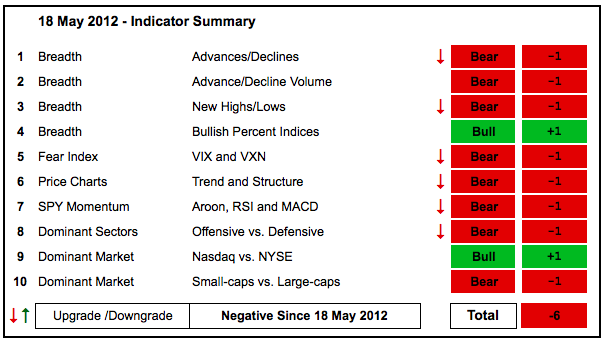
With a slew of downgrades, the indicator summary moved to -6 and decidedly negative for the first time since December. The bull run was long (5+ months), but the evidence has clearly shifted as selling pressure accelerated this week. Net New Highs for the NYSE turned negative and hit their...
READ MORE
MEMBERS ONLY
MidCaps Lead Lower with Support Break - Gold Surges
by Arthur Hill,
Chief Technical Strategist, TrendInvestorPro.com
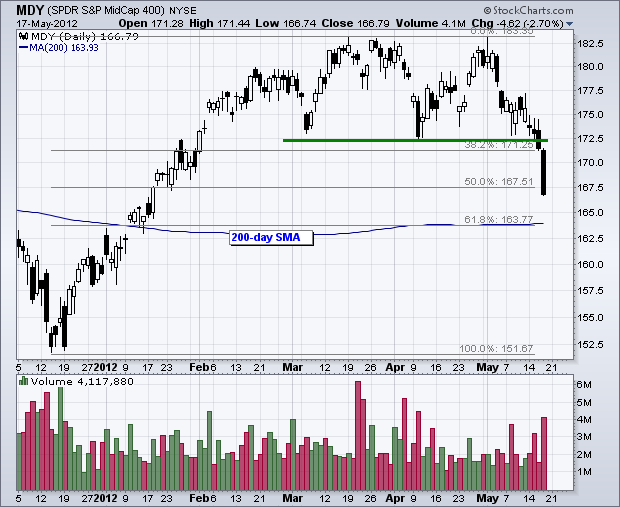
The decline in stocks accelerated on Thursday with QQQ and IMW falling over 2% and SPY loosing around 1.5%. This could be the beginning of the end, or it could simply be the middle of a free fall (see August 2011). Stocks are simply in falling knife mode. Of...
READ MORE
MEMBERS ONLY
Gold and Treasuries Reverse Negative Correlation with Joint Surge
by Arthur Hill,
Chief Technical Strategist, TrendInvestorPro.com
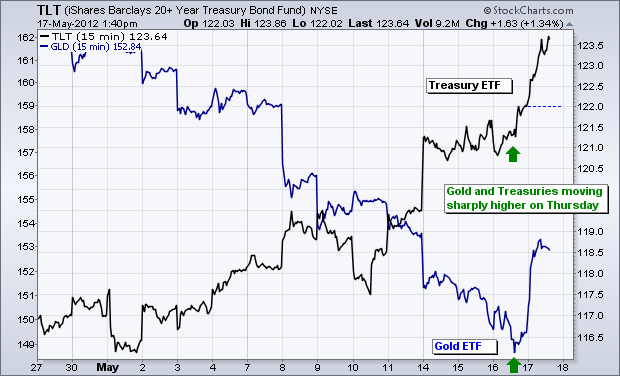
The Gold SPDR (GLD) and the 20+ Year T-Bond ETF (TLT) have been negatively this month. Notice how TLT advanced from 116 to 123.5 and GLD declined from 161 to 150 the prior 11 days. This negative correlation changed today as both surged higher. TLT is up over...
READ MORE
MEMBERS ONLY
SMH Breaks Neckline and IGN Moves Below December Low
by Arthur Hill,
Chief Technical Strategist, TrendInvestorPro.com
There it is again. Stocks opened with a little bounce and then worked their way lower the rest of the day. Every intraday bounce since May 11th has led to renewed selling pressure and lower lows. Buying pressure is weak on the bounce and none-existent after the bounce. The...
READ MORE
MEMBERS ONLY
Charts of Interest: ADP, AFFX, AMZN, FL, LUV, ROK, WSM
by Arthur Hill,
Chief Technical Strategist, TrendInvestorPro.com
AMZN Stalls after Big Gap.
FL Forms Pennant after High Volume Support Break.
WSM Breaks Flag Support after Big Bull Trap.
Plus ADP, AFFX, FL, LUV, ROK
This commentary and charts-of-interest are designed to stimulate thinking. This analysis is not a recommendation to buy, sell, hold or sell...
READ MORE
MEMBERS ONLY
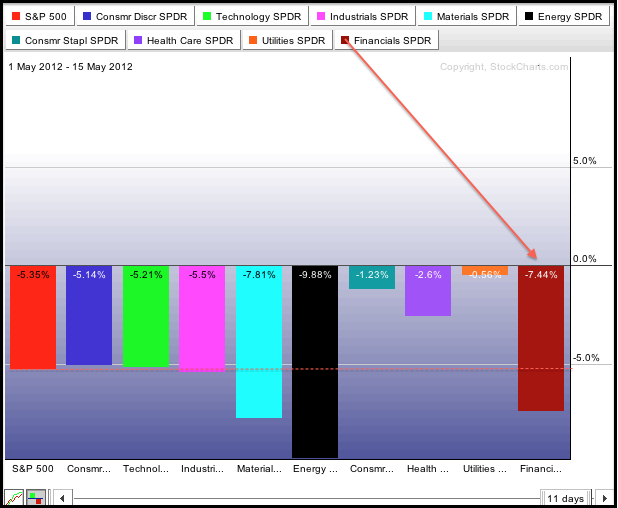
May-hem in the Markets with all Sectors Lower this Month
by Arthur Hill,
Chief Technical Strategist, TrendInvestorPro.com
May has been nothing but mayhem for the market as all nine sectors moved lower. The PerfChart below shows the percentage change since May 1st. Over the last 11 trading days, the Finance SPDR (XLF), Energy SPDR (XLE) and Basic Materials SPDR (XLB) are leading the market lower. The three...
READ MORE
MEMBERS ONLY
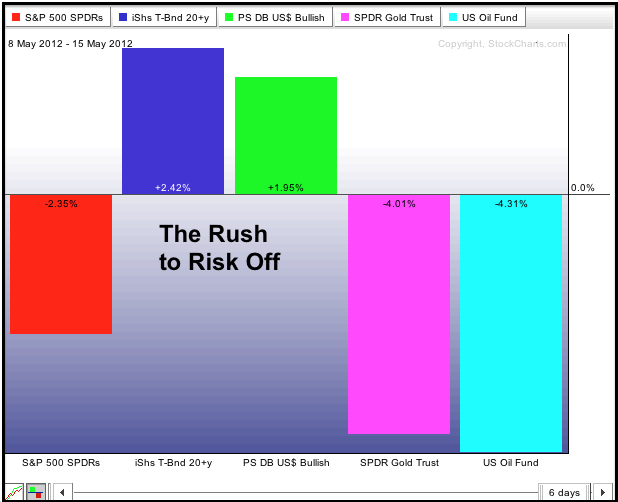
Dollar and Treasuries Lead the Risk-off Trade
by Arthur Hill,
Chief Technical Strategist, TrendInvestorPro.com
US stocks opened strong on Tuesday, but buyers lost their nerve again and the major index ETFs closed near their lows for the day. Treasuries continued higher as investors sought relatively safety ahead of June elections in Greece. Needless to say, the Dollar soared and the Euro plunged. Commodities plunged...
READ MORE
MEMBERS ONLY
A Bollinger Band Squeeze for Google
by Arthur Hill,
Chief Technical Strategist, TrendInvestorPro.com
After a big decline in April, Google ($GOOG) consolidated the last few weeks and the Bollinger Bands narrowed significantly. This could be called a Bollinger Band squeeze or volatility squeeze. The next directional signal depends on the band break. A move above the upper band would be bullish, while a...
READ MORE
MEMBERS ONLY
IWM Breaks Wedge Support with Gap as TLT Hits New High
by Arthur Hill,
Chief Technical Strategist, TrendInvestorPro.com
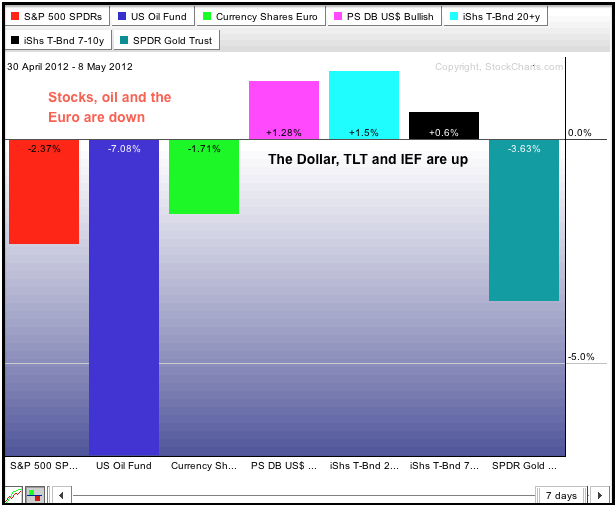
The risk-off trade was in full force on Monday: treasuries and the Dollar moved higher as stocks, oil and the Euro moved lower. Stocks opened weak, bounced a little and then closed weak as buyers lost their nerve. The major index ETFs remain in short-term downtrends, but are...
READ MORE
MEMBERS ONLY
Charts of Interest: AAPL, ABC, CAH, CVG, IMN, NKE, XRX
by Arthur Hill,
Chief Technical Strategist, TrendInvestorPro.com
AAPL Declines to Support on Low Volume.
ABC Surges off Support with Big Volume.
Plus CAH, CVG, IMN, NKE, XRX
This commentary and charts-of-interest are designed to stimulate thinking. This analysis is not a recommendation to buy, sell, hold or sell short any security (stock ETF or otherwise)...
READ MORE
MEMBERS ONLY
QQQ Forms Rising Pennant as TLT Remains Strong
by Arthur Hill,
Chief Technical Strategist, TrendInvestorPro.com
The risk-off trade has been dominant since May and shows no signs of changing this week. The world is openly talking about a Greek exit from the Euro, perhaps within a month. The fear is not so much the Greek exit, but rather the affect it will have on...
READ MORE
MEMBERS ONLY
Activision Gaps up on Big Volume $ATVI
by Arthur Hill,
Chief Technical Strategist, TrendInvestorPro.com
Stocks were under pressure the last three days, but ATVI bucked the trend with an advance and gap on high volume. This gap off support is bullish as long as it holds. Resistance at 13 marks the next challenge.
Click this image for a live chart....
READ MORE
MEMBERS ONLY
AD Volume Lines Break Support as Indicator Summary Slips
by Arthur Hill,
Chief Technical Strategist, TrendInvestorPro.com
The indicator summary moved to +4 because of two downgrades. Of note, the AD Volume Lines broke support to turn bearish. Despite these breaks, the NYSE AD Line remains in bull mode and the Net New Highs indicators are still considered bullish. We have yet to see enough selling pressure...
READ MORE
MEMBERS ONLY
Major Index ETFs Set to Test March-April Lows
by Arthur Hill,
Chief Technical Strategist, TrendInvestorPro.com
A disappointing outlook from Cisco (CSCO) weighed on the tech sector Thursday. In particular, the company sighted future concerns on government spending in the US and Europe. A $2 billion derivatives loss from JP Morgan Chase (JPM) is weighing on stock futures early Friday. This loss could expand another $1...
READ MORE
MEMBERS ONLY
Consumer staples stock Heinz Hits 52-week High with Breakout $HNZ
by Arthur Hill,
Chief Technical Strategist, TrendInvestorPro.com
The Consumer Staples SPDR (XLP) remains one of the strongest sectors and Heinze is part of that strength with an ascending triangle breakout. With a surge the last two weeks, the stock broke above its January-February highs and entered uncharted territory. Relative strength in consumer staples stocks shows a...
READ MORE
MEMBERS ONLY
IWM Tests March-April Lows as UUP Hits April High
by Arthur Hill,
Chief Technical Strategist, TrendInvestorPro.com
Several major index ETFs are testing their March-April lows and these support zones could produce oversold bounces. The Russell 2000 ETF (IWM), Dow Industrials SPDR (DIA), Rydex S&P Equal Weight ETF (RSP) and S&P MidCap 400 SPDR (MDY) are all testing support from the March-...
READ MORE
MEMBERS ONLY
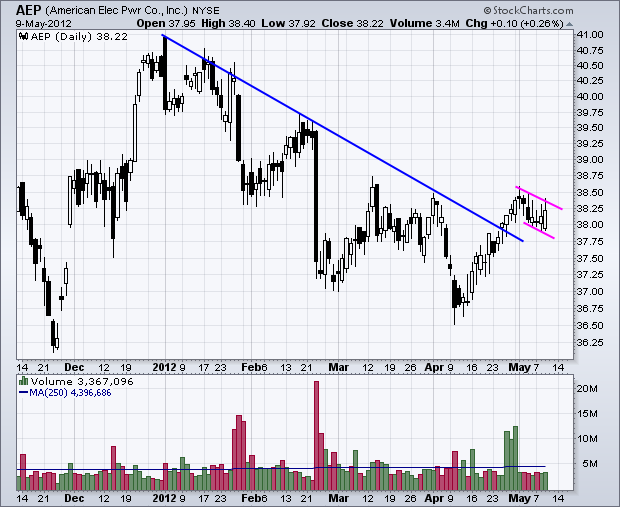
Charts of Interest: AEP, AN, CNX, GFI, ITT, UIS
by Arthur Hill,
Chief Technical Strategist, TrendInvestorPro.com
CNX Bounces off Consolidation Support with big Volume.
GFI Forms Bullish Engulfing.
USI Forms within Gap Zone.
Plus AEP, AN, ITT
This commentary and charts-of-interest are designed to stimulate thinking. This analysis is not a recommendation to buy, sell, hold or sell short any security (stock ETF or...
READ MORE
MEMBERS ONLY
May Starts out as a Big Risk Off Month for Intemarket PerfChart
by Arthur Hill,
Chief Technical Strategist, TrendInvestorPro.com
The PerfChart below shows the percentage change for seven intermarket ETFs. The three risk assets (stocks, oil, euro) are down, while the three safe havens are up (dollar, treasuries). Gold is going against the Dollar and along with the stock market.
Click this image for a live chart....
READ MORE
MEMBERS ONLY
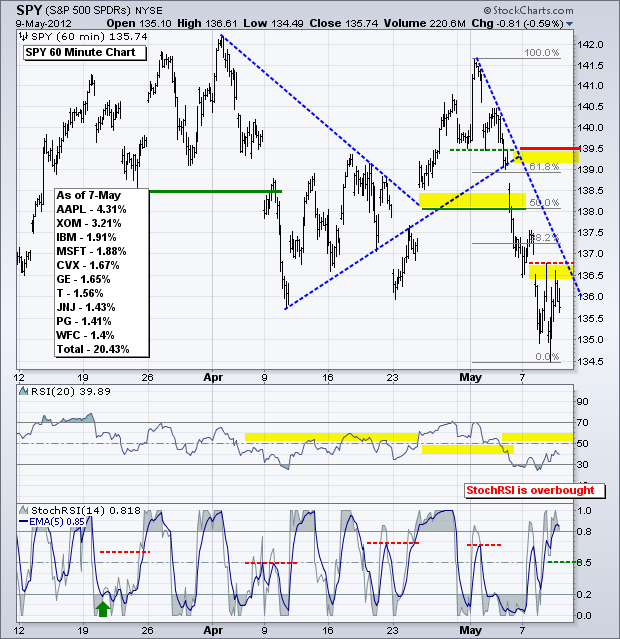
SPY Bounces Off April Low as GLD Breaks Pennant Support
by Arthur Hill,
Chief Technical Strategist, TrendInvestorPro.com
The S&P 500 ETF (SPY) pierced its April lows with a sharp decline on the open and the bounced with an afternoon surge. Traders can expect this kind of volatility because bargain hunters and bottom pickers become active after sharp decline. SPY reached 135 on Tuesday's...
READ MORE
MEMBERS ONLY
SPY Firms after Becoming Oversold - GLD Forms Pennant
by Arthur Hill,
Chief Technical Strategist, TrendInvestorPro.com
After a big decline last week, stocks firmed on Monday and there is no change for the major index ETFs. A lot of news hit the fan over the past week and it looks like traders took a rest on Monday. The results of the Greek and French elections did...
READ MORE
MEMBERS ONLY
Charts: DHR, FITB, GOOG, LUV, MMM, SCHW, URBN
by Arthur Hill,
Chief Technical Strategist, TrendInvestorPro.com
GOOG Forms Pennant after Sharp Decline.
MMM Hits Resistance and Declines into Gap Zone.
URBN Declines after Big Harami Pattern.
Plus DHR, FITB, LUV, SCHW
This commentary and charts-of-interest are designed to stimulate thinking. This analysis is not a recommendation to buy, sell, hold or sell short any...
READ MORE
MEMBERS ONLY
Most Active Lists Show Mixed Market on Monday with Some Bullish Candlestick Patterns
by Arthur Hill,
Chief Technical Strategist, TrendInvestorPro.com
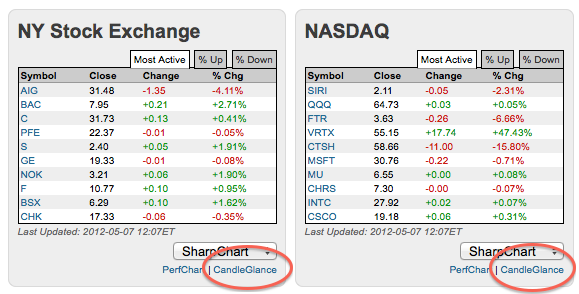
Even though stocks opened lower on Monday, market action quickly turned mixed, as evidenced on the most active tables for the Nasdaq and NYSE. Chartists can see the intraday action by clicking the CandleGlance links. BAC has a bullish engulfing working and Pfizer has an inverted hammer working on Monday....
READ MORE
MEMBERS ONLY
SPY Gaps Below Support and GLD Firms Within Range
by Arthur Hill,
Chief Technical Strategist, TrendInvestorPro.com
Uncertainty ratcheted up a notch in Europe as Hollande won the French election and the ruling coalition in Greece was dealt a setback. Asian stocks are down sharply, European stocks are down and Dow futures are down around 100 points. Oil, gold and the Euro are also down, while the...
READ MORE
MEMBERS ONLY
Industrials SPDR Traces Out Head-and-Shoulders Reversal
by Arthur Hill,
Chief Technical Strategist, TrendInvestorPro.com
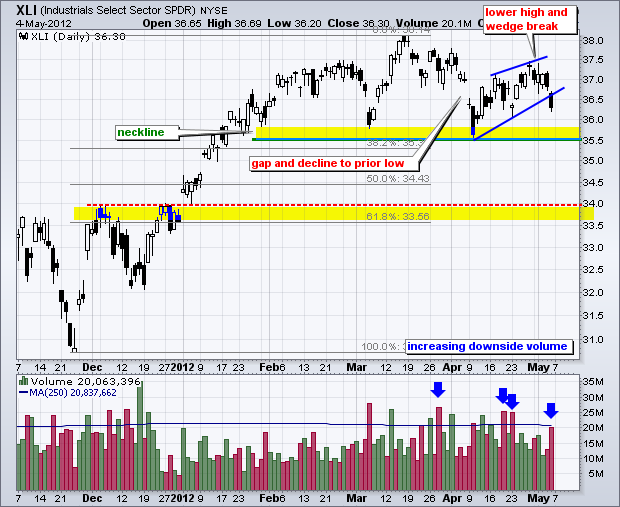
With a gap down and sharp decline, the Industrials SPDR (XLI) formed a lower high and broke wedge support. But that's not all. The chart below also shows a potential head-and-shoulders pattern taking shape. After hitting a 52-week high in March, the ETF declined all...
READ MORE
MEMBERS ONLY
Sector Carpet Shows a Sea of Red and a Few Stocks Bucking the Trend
by Arthur Hill,
Chief Technical Strategist, TrendInvestorPro.com
Stocks were down sharply in early trading on Friday with the energy sector showing the most red in the Sector Carpet. There are, however, usually a few stocks bucking the trend and these can be found by looking for the isolated patches of green. Notice Micron (MU), Flour (FLR) and...
READ MORE
MEMBERS ONLY
AD Volume Lines Hold Support, But Bounce Looks Weak
by Arthur Hill,
Chief Technical Strategist, TrendInvestorPro.com
There are no changes in the indicator summary, but I am watching the AD Volume Lines quite closely. Even though both bounced over the last few weeks and essentially held support from the March lows, this bounce has not been that strong. Failure to reach the March high and a...
READ MORE
MEMBERS ONLY
The Moment of Truth Arrives for Stocks and Treasuries
by Arthur Hill,
Chief Technical Strategist, TrendInvestorPro.com
Stocks were under pressure on Thursday after a worse-than-expected ISM Services Index. This diffusion index came in at 53.5 for April, compared to 56 in March. Even though the index dropped, it remains well above 50 and indicative of economic expansion, not contraction. From ism.com, "...
READ MORE
MEMBERS ONLY
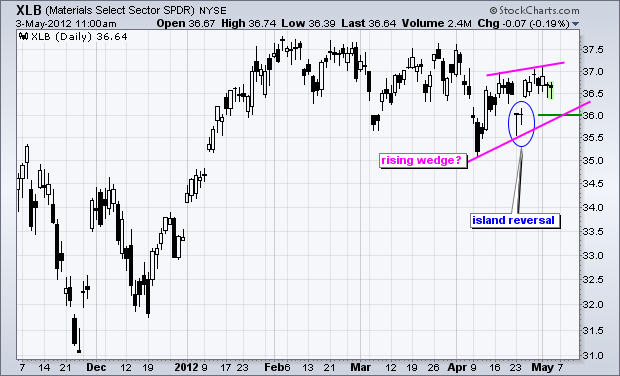
Rising Wedge Threatens Island Reversal in the Basic Materials SPDR
by Arthur Hill,
Chief Technical Strategist, TrendInvestorPro.com
The Basic Materials SPDR (XLB) reversed higher last week with an island reversal, but stalled over the last 4-5 days and a rising wedge is taking shape. For now, the gap and island reversal dominate the chart. A move below 36 would fill this gap and break the wedge...
READ MORE
MEMBERS ONLY
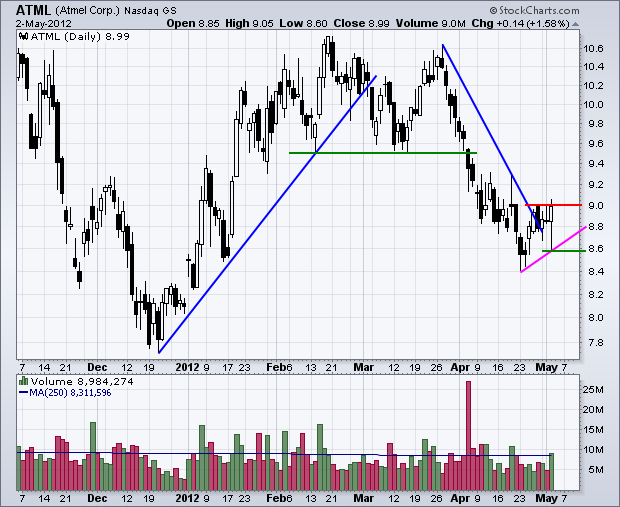
Charts of Interest: ATML, BWA, DWA, KFY, KMX, MD
by Arthur Hill,
Chief Technical Strategist, TrendInvestorPro.com
Upside Volume Picks up for ATML.
KFY Gaps up and Consolidates.
MD Forms Bullish Engulfing on High Volume.
Plus BWA, DWA, KMX
This commentary and charts-of-interest are designed to stimulate thinking. This analysis is not a recommendation to buy, sell, hold or sell short any security (stock ETF...
READ MORE
MEMBERS ONLY
SPY Holds Uptrend as TLT Consolidation Narrows
by Arthur Hill,
Chief Technical Strategist, TrendInvestorPro.com
Stocks opened weak after the ADP Employment report came in below expectations. Nevertheless, the market firmed and worked its way higher the rest of the day. Small-caps (Russell 2000) and techs (Nasdaq) finished with small gains, the S&P 500 and Dow ended the day with small losses....
READ MORE
MEMBERS ONLY
FirstTrust Internet ETF Gaps above Wedge Resistance
by Arthur Hill,
Chief Technical Strategist, TrendInvestorPro.com
The FirstTrust Internet ETF (FDN) broke out with a gap last week and that gap is holding. Mind that gap! The gap is bullish as long as it holds. Also notice that FDN broke resistance from the mid April highs and the Price Relative broke the trendline extending down from...
READ MORE
MEMBERS ONLY
TLT Tests Support after Strong ISM Index and USO Breaks Out
by Arthur Hill,
Chief Technical Strategist, TrendInvestorPro.com
It was pop and drop for stocks on Tuesday. Stocks surged on the heels of a better-than-expected ISM Manufacturing Index, but failed to hold early gains and fell sharply in the final hour. Small-caps (Russell 2000) and techs (Nasdaq) led the way lower. Traders may be getting...
READ MORE
MEMBERS ONLY
Home Construction iShares Hits 52-week High and Components Follow Suit
by Arthur Hill,
Chief Technical Strategist, TrendInvestorPro.com
The Home Construction iShares (ITB) is leading the market higher again with a fresh 52-week high this week. The chart below also shows the Price Relative (ITB:SPY ratio) hitting a new high. Below this chart is a snapshot from today's new high list. A sort by...
READ MORE
MEMBERS ONLY
Gold Recovers after Weak Open and TLT Holds Support
by Arthur Hill,
Chief Technical Strategist, TrendInvestorPro.com
Stocks pulled back on Monday after the Chicago PMI came in below expectations and reached its lowest level since November 2009. Nevertheless, this key indicator came in at 56.20, which is well above 50 and indicative of economic expansion. Anything above 50 is positive. Don't forget that...
READ MORE
MEMBERS ONLY
Charts of Interest: ADM, BHI, CMI, HPQ, MAN, MON, SKS
by Arthur Hill,
Chief Technical Strategist, TrendInvestorPro.com
BHI Breaks Pennant Resistance.
HPQ Consolidates after High Volume Surge.
MAN Breaks Pennant Support.
Plus ADM, CMI, MON, SKS
This commentary and charts-of-interest are designed to stimulate thinking. This analysis is not a recommendation to buy, sell, hold or sell short any security (stock ETF or otherwise). We...
READ MORE
MEMBERS ONLY
Harman and Whirlpool Show Biggest Gains in StockCharts Technical Rank
by Arthur Hill,
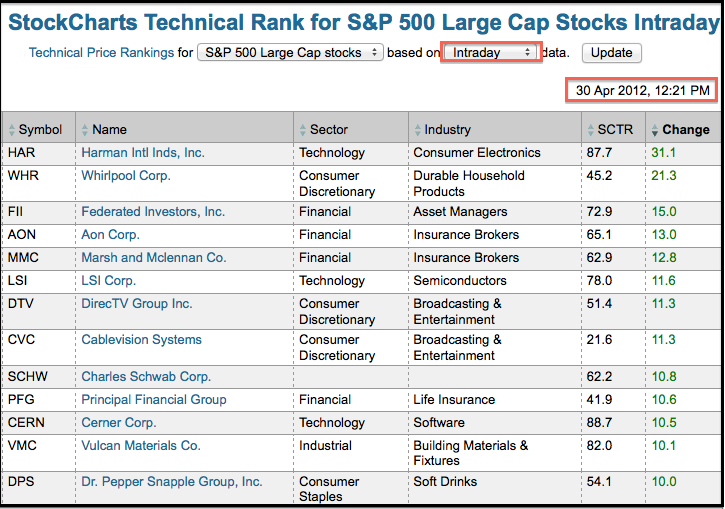
Chief Technical Strategist, TrendInvestorPro.com
The StockCharts Technical Rank (SCTR) is updated throughout the day so traders can find stocks making significant technical moves when they happen. The table below represents a snapshot from April 30th at 12:21 PM ET. These are the stocks with the biggest technical rank moves within the S&...
READ MORE
MEMBERS ONLY
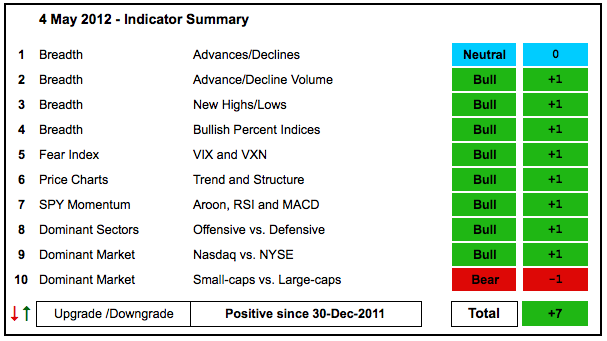
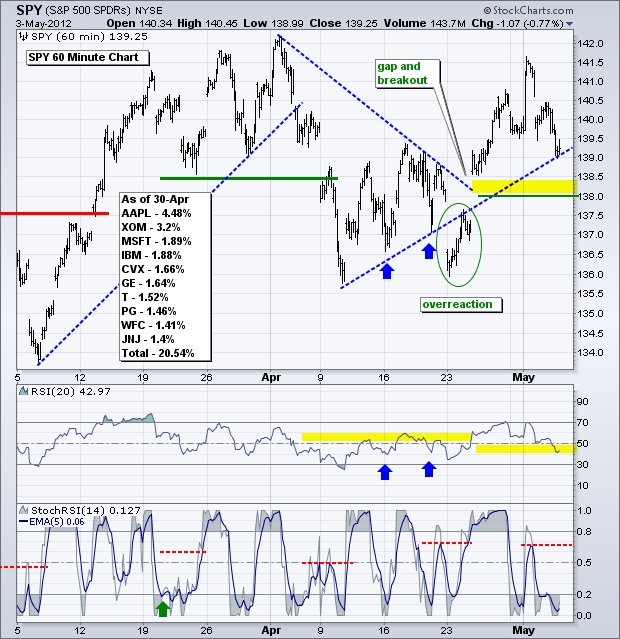
Big Economic Week Could Make or Break the Bulls
by Arthur Hill,
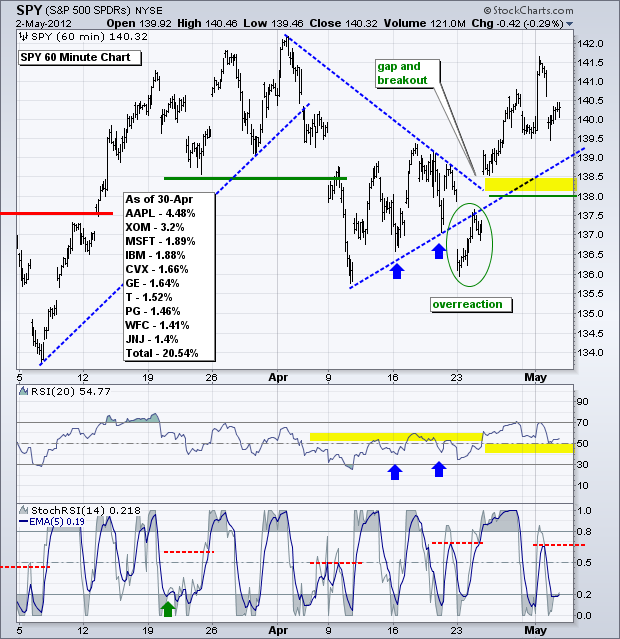
Chief Technical Strategist, TrendInvestorPro.com
The short-term trend for stocks changed with Wednesday's gap and breakout. The medium-term and long-term trends were already up. This means that all three trends are up again and we could see a challenge to the March highs. While I hate to play the fundamental...
READ MORE
MEMBERS ONLY
Consumer Staples Bullish% Index Shows the Most Strength
by Arthur Hill,
Chief Technical Strategist, TrendInvestorPro.com
The Consumer Staples Bullish% Index ($BPSTAP) is the strongest of the nine sector SPDR Bullish Percent Indexes. It is interesting that the BPI for this defensive sector shows the most strength. In contrast, the Consumer Discretionary Bullish% Index ($BPDISC) is currently around 69%. You can read more in our ChartSchool...
READ MORE