MEMBERS ONLY
NYSE and Nasdaq AD Volume Lines Establish Key Support Zones
by Arthur Hill,
Chief Technical Strategist, TrendInvestorPro.com
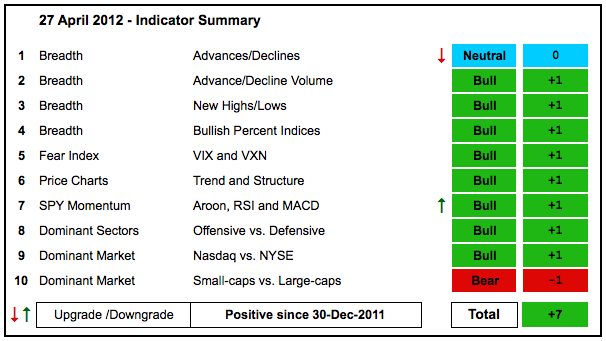
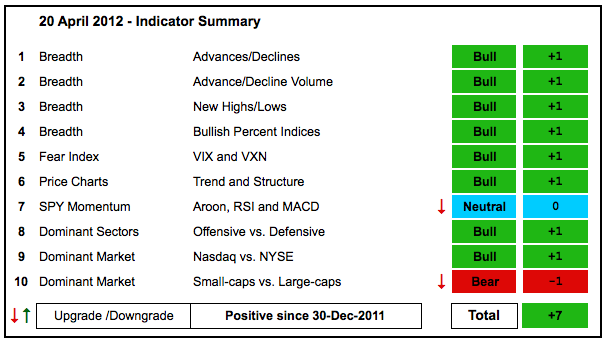
A couple of indicators flipped this week, but the net result is the same as the indicator summary remains at +7. The Nasdaq AD Line shows too much weakness to be considered bullish, but it is offset by strength in the NYSE AD Line. Momentum flipped back to bullish as...
READ MORE
MEMBERS ONLY
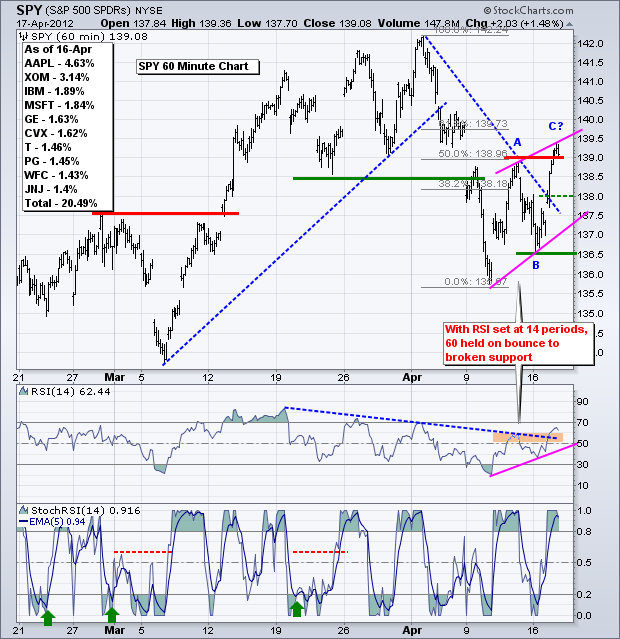
TLT Holds Support as Treasuries Remain Stubbornly Strong
by Arthur Hill,
Chief Technical Strategist, TrendInvestorPro.com
The island reversals, up gaps and breakouts are holding. QQQ formed a lower low early this week, but IWM and SPY held above their early April lows. In fact, the recovery after Monday's gap down was so swift that I am going to draw my trendlines right through...
READ MORE
MEMBERS ONLY
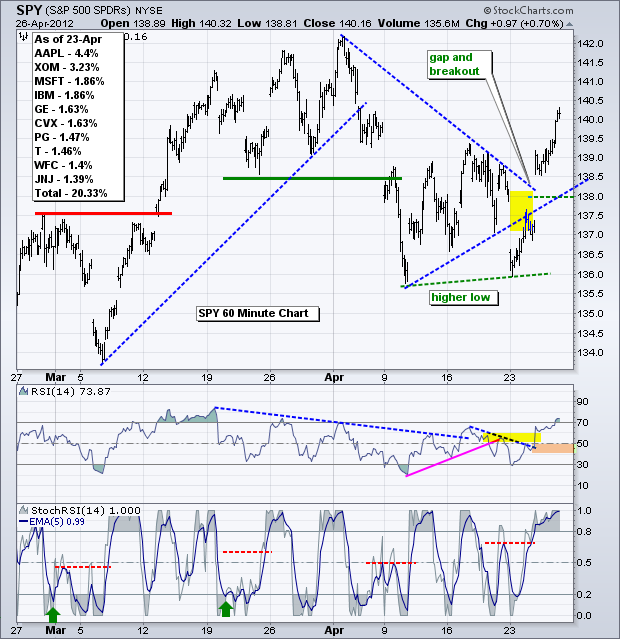
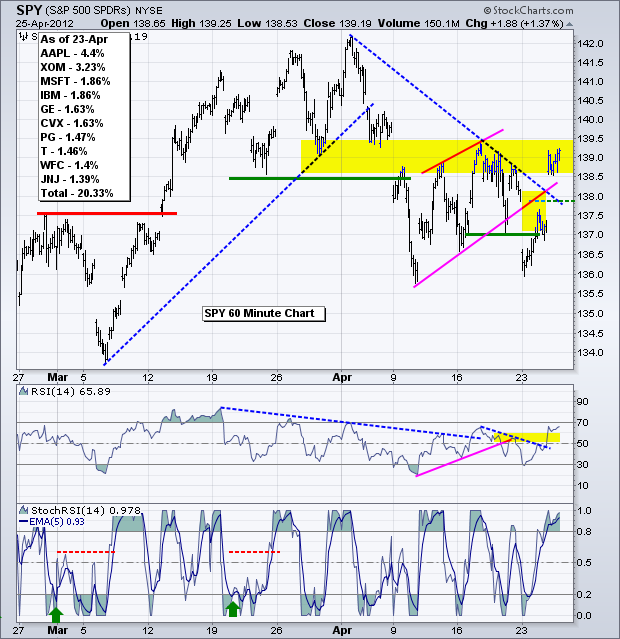
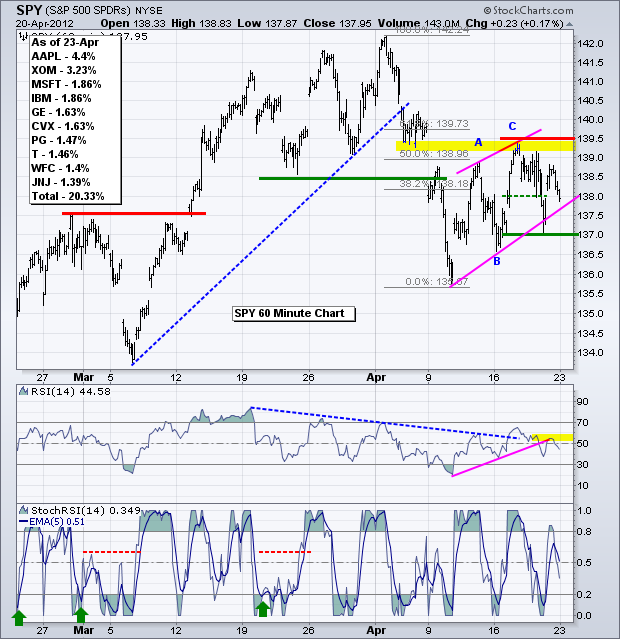
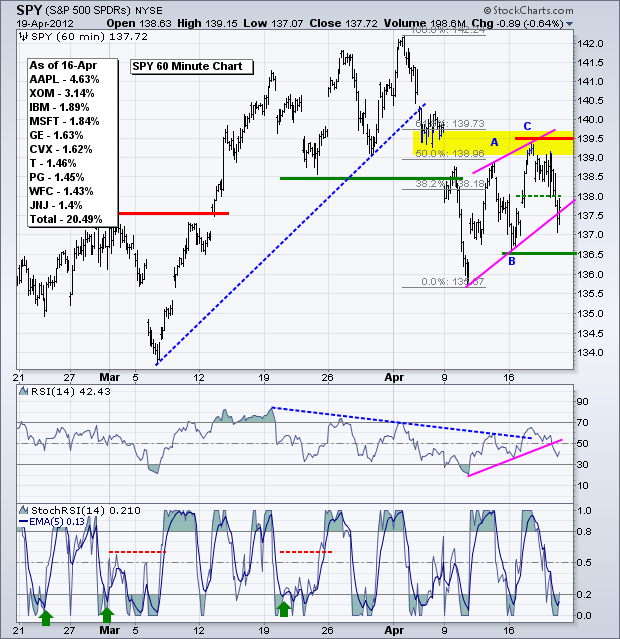
SPY Forges Island Reversal - GLD Firms within Downswing
by Arthur Hill,
Chief Technical Strategist, TrendInvestorPro.com
The Fed made another policy statement with little change in its outlook or wording. Apple produced another blow out quarter. Even though neither event produced a surprise, Apple's coattails provided a big lift for the market overall. Most, if not all, of the gains came before the Fed...
READ MORE
MEMBERS ONLY
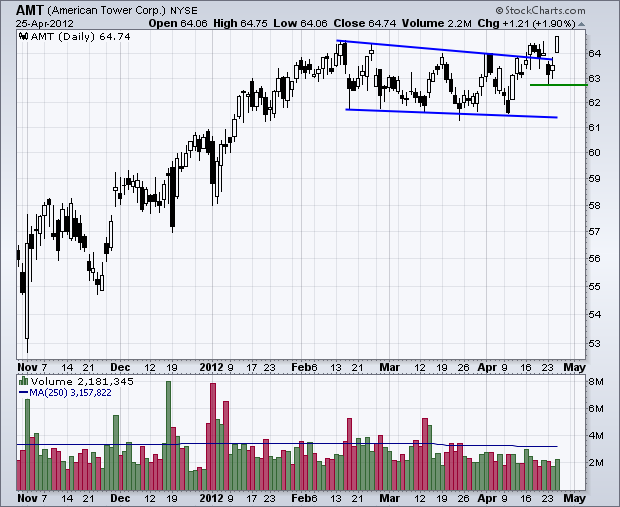
Charts: AMT, AMZN, ATVI, DELL, FDX, IGT, SLM, TER, UTX
by Arthur Hill,
Chief Technical Strategist, TrendInvestorPro.com
Careful out there. It is earnings season.
AMT Breaks Out to 52-week High.
DELL Hits Key Retracement.
SLM Forms Small Descending Triangle.
Plus AMZN, ATVI, FDX, IGT, TER, UTX.
This commentary and charts-of-interest are designed to stimulate thinking. This analysis is not a recommendation to buy, sell,...
READ MORE
MEMBERS ONLY
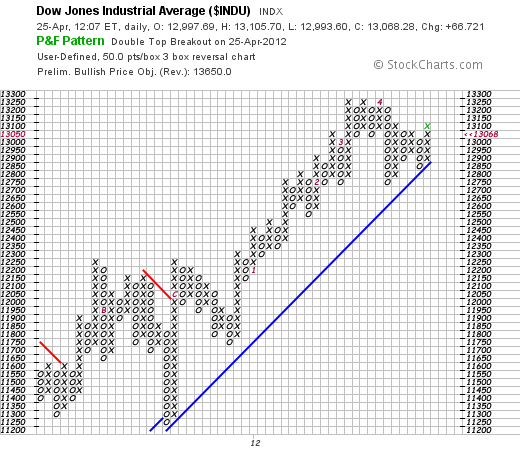
Dow Bounces off Bullish Support Line on P&F Chart
by Arthur Hill,
Chief Technical Strategist, TrendInvestorPro.com
The Dow Industrials remains in a long-term uptrend as it bounced off the bullish support line extending up from October 2011. This line and the April low combine to mark a key support zone in the 12850-12900 area. It would take a P&F print below the...
READ MORE
MEMBERS ONLY
SPY Moves into Gap Zone as QQQ Stalls at Channel Trendline
by Arthur Hill,
Chief Technical Strategist, TrendInvestorPro.com
Apple is stoking the street with a big move after reporting earnings. While a strong open is expected, what happens after the open, and after the Fed statement, is more important. Actually, I think Thursday's price action will hold the key to the next move in stocks. Trading...
READ MORE
MEMBERS ONLY
Citrix Gaps Down after Shooting Star Candlestick
by Arthur Hill,
Chief Technical Strategist, TrendInvestorPro.com
After hitting resistance in the 80-81 area in March, Citrix (CTXS) failed once again at this level with a shooting star candlestick last week. Notice the long upper shadow extending above 80. A down gap followed this bearish reversal candlestick and the next support zone resides around 71.
Click...
READ MORE
MEMBERS ONLY
SPY Gaps Down and Breaks Wedge Support
by Arthur Hill,
Chief Technical Strategist, TrendInvestorPro.com
Stocks are short-term oversold, it is turnaround Tuesday, Apple reports earnings today and the bigger trend (6 months) remains up. On top of all this, traders will also be gearing up for the start of the Fed meeting today and policy statement on Wednesday (12:30PM). Stocks moved lower...
READ MORE
MEMBERS ONLY
Charts of Interest: AMX, ANF, APD, AZO, COH, GLW
by Arthur Hill,
Chief Technical Strategist, TrendInvestorPro.com
APD Breaks Rising Flag Support.
AZO Forms Pennant with Strong Up Volume.
LXK Forms Bullish Engulfing on Big Volume.
Plus AMX, ANF, APD, COH
This commentary and charts-of-interest are designed to stimulate thinking. This analysis is not a recommendation to buy, sell, hold or sell short any security...
READ MORE
MEMBERS ONLY
Apple CCI Becomes Oversold for Third Time in Twelve Months
by Arthur Hill,
Chief Technical Strategist, TrendInvestorPro.com
When it comes to the Commodity Channel Index (CCI), there is oversold and then there is OVERSOLD. Readings below -100 are average oversold, while anything below -200 is really oversold. For just the third time in twelve months, 20-day CCI for Apple moved below -200. Prior readings occurred in...
READ MORE
MEMBERS ONLY
SPY Battles Rising Wedge Trendline as GLD Forms Pennant
by Arthur Hill,
Chief Technical Strategist, TrendInvestorPro.com
Stocks look heavy as selling pressure hit Friday afternoon and remains early Monday. $SPX futures are down around 10 points in early trading (5AM ET). Bonds and the Dollar are up, while gold and oil are down. Stocks surged last Tuesday, but gave back these gains with a decline on...
READ MORE
MEMBERS ONLY
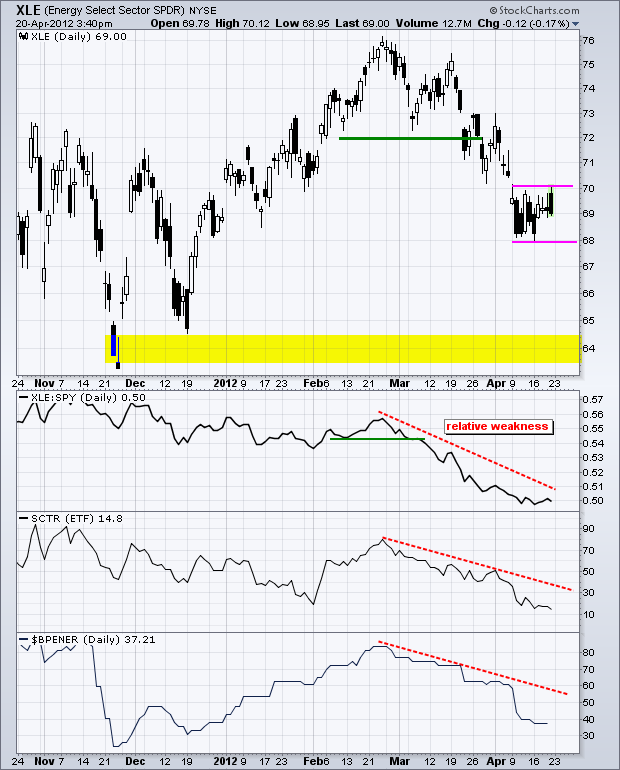
ENERGY SECTOR IS THE WEAKEST OF THE NINE
by Arthur Hill,
Chief Technical Strategist, TrendInvestorPro.com
The Energy SPDR (XLE) broke key support in late March with a sharp decline and has yet to reach the next key support level. The chart below shows XLE consolidating in the 69 area over the last two weeks. This consolidation looks like a rest within the downtrend. A break...
READ MORE
MEMBERS ONLY
QQQ Remains within Falling Flag Pattern
by Arthur Hill,
Chief Technical Strategist, TrendInvestorPro.com
The Nasdaq 100 ETF (QQQ) managed to firm after Monday's sharp decline, but remains within a short-term downtrend defined by a falling flag. It would take a move above resistance at 67 to reverse this fall. Chartists can also watch for the Commodity Channel Index (CCI) for...
READ MORE
MEMBERS ONLY
Indicator Summary Weakens along with Small Caps
by Arthur Hill,
Chief Technical Strategist, TrendInvestorPro.com
The indicator summary dipped to +7 this week after two downgrades. The bulk of the evidence is still bullish, but a few indicators weakened with the April decline. The NYSE AD Line and AD Volume Line briefly broke their March lows. The Energy Bullish% Index ($BPENER) dipped below 50% to...
READ MORE
MEMBERS ONLY
IWM Breaks Flag Trendline, UUP Forms Triangle After Breakout
by Arthur Hill,
Chief Technical Strategist, TrendInvestorPro.com
Stocks weakened over the last two days as IWM broke its rising flag trendline and SPY tested its rising flag trendline. QQQ remains in a downtrend as Apple continues to weigh. On the 60-minute chart, SPY broke support with a sharp decline in early April to start a short-...
READ MORE
MEMBERS ONLY
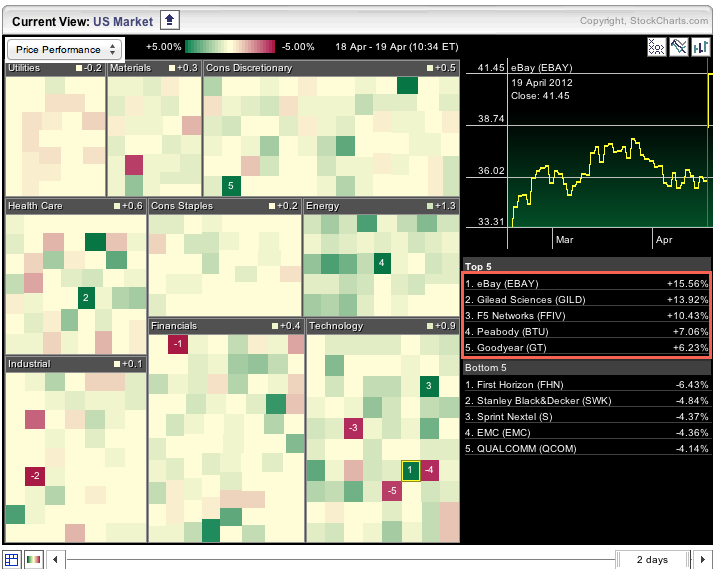
Biotechs, Internet and Networking Lead Market Higher
by Arthur Hill,
Chief Technical Strategist, TrendInvestorPro.com
The Sector Market Carpet shows big gains in three stocks powering these industry groups. EBAY is up over 15% and leading the internet group. FFIV is up over 13% and leading the networking group. Both groups are part of the technology sector. GILD is up over 10% and leading the...
READ MORE
MEMBERS ONLY
SPY and IWM Continue within Rising Flags as GLD Stalls
by Arthur Hill,
Chief Technical Strategist, TrendInvestorPro.com
The moment of truth is drawing near. After a bounce the prior five days, the major index ETFs consolidated on Wednesday. DIA and SPY formed inside days to signal short-term indecision. Also note that rising flag patterns formed in DIA, SPY and IWM. A break below rising flag support...
READ MORE
MEMBERS ONLY
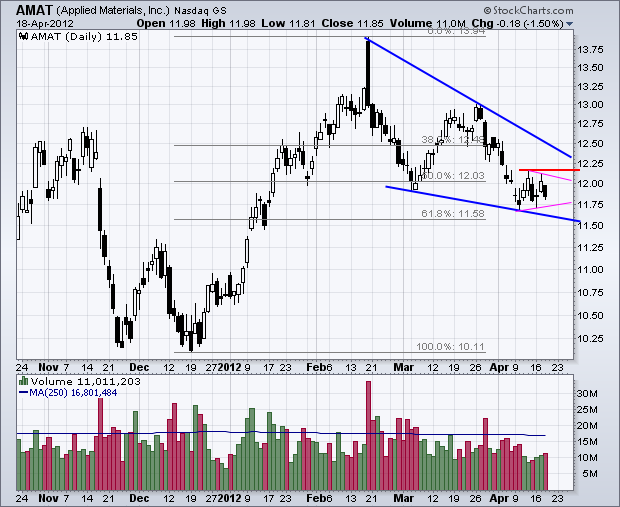
Charts of Interest: AMAT, GRMN, HRB, HUM, STT
by Arthur Hill,
Chief Technical Strategist, TrendInvestorPro.com
Careful out there. It is earnings season.
AMAT Consolidates in Key Retracement Zone.
GRMN Forms Flat Flag after Breakdown.
STT Breaks Short-term Resistance with Volume.
Plus HRB and HUM.
This commentary and charts-of-interest are designed to stimulate thinking. This analysis is not a recommendation to buy, sell,...
READ MORE
MEMBERS ONLY
Morgan Stanley Consolidates at Support
by Arthur Hill,
Chief Technical Strategist, TrendInvestorPro.com
Morgan Stanley fell to support with a sharp decline from late March to early April and then consolidated the last eight days. While the stock market bounced, MS remained flat and is lagging the market the past week. Watch the consolidation boundaries for the next directional signal.
Click this image...
READ MORE
MEMBERS ONLY
IWM and SPY Bounce to Key Retracements and Resistance
by Arthur Hill,
Chief Technical Strategist, TrendInvestorPro.com
Stocks surged with the oversold Nasdaq 100 ETF (QQQ) leading the major index ETFs higher on Tuesday. What is it about Tuesdays and turnarounds? All sectors were up with technology, industrials and energy leading the charge. IWM and SPY have five day uptrends working on the 60-minute charts, but...
READ MORE
MEMBERS ONLY
Sector Summary Shows Coal Leading the Energy Sector
by Arthur Hill,
Chief Technical Strategist, TrendInvestorPro.com
The Industry Summary page provides chartists with an easy way to view performance for the nine big sectors and the industry groups that make up these sectors. The image below shows DJ US Coal Industry Index ($DJUSCL) leading the energy sector with a 4 plus percent gains. Chartists can click...
READ MORE
MEMBERS ONLY
IWM Breaks Flag Trendline and USO Forms Small Falling Flag
by Arthur Hill,
Chief Technical Strategist, TrendInvestorPro.com
The short-term trends for the major index ETFs may be down, but the medium-term and long-term trends are still up. Keep this in mind before getting too bearish. My best guess is that stocks will enter some sort of trading range over the next few weeks to...
READ MORE
MEMBERS ONLY
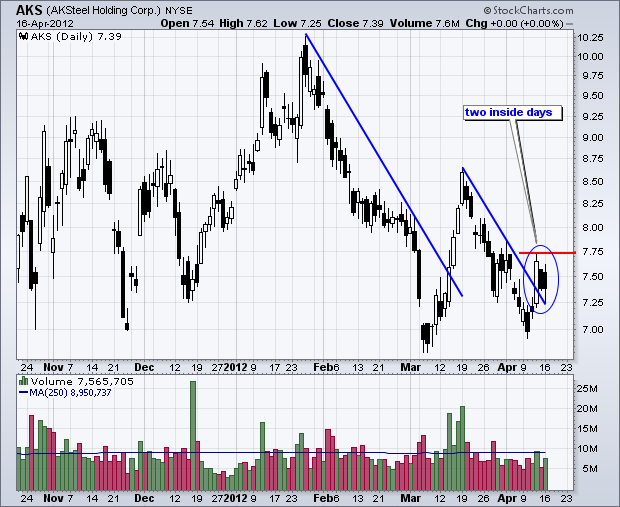
Charts: AKS, DNR, GGP, LLY, ORCL, TRV, UAL, WM
by Arthur Hill,
Chief Technical Strategist, TrendInvestorPro.com
Careful out there. It is earnings season.
AKS Forms Two Inside Days.
TRV Forms Falling Flag after Breakout.
UAL Surges on Higher Volume.
Plus DNR, GGP, LLY, ORCL, WM
This commentary and charts-of-interest are designed to stimulate thinking. This analysis is not a recommendation to buy, sell, hold...
READ MORE
MEMBERS ONLY
Transport iShares Bounces off Range Support
by Arthur Hill,
Chief Technical Strategist, TrendInvestorPro.com
With a bounce the last four days, the Transport iShares (IYT) held support from the early March low and remained range bound. Notice how the ETF has traded between 89.7 and 96 since mid January. Chartists should watch this range for the next directional signal.
Click this image for...
READ MORE
MEMBERS ONLY
Stocks Reverse Short-Term Uptrends as Dollar Breaks Out
by Arthur Hill,
Chief Technical Strategist, TrendInvestorPro.com
There were some trend changes over the last two weeks and some trend extensions. Most notably, stocks reversed their uptrends and the Dollar reversed its downtrend. While the bigger trend remains up for stocks, April's small-cap led decline started a short-term downtrend with key support breaks...
READ MORE
MEMBERS ONLY
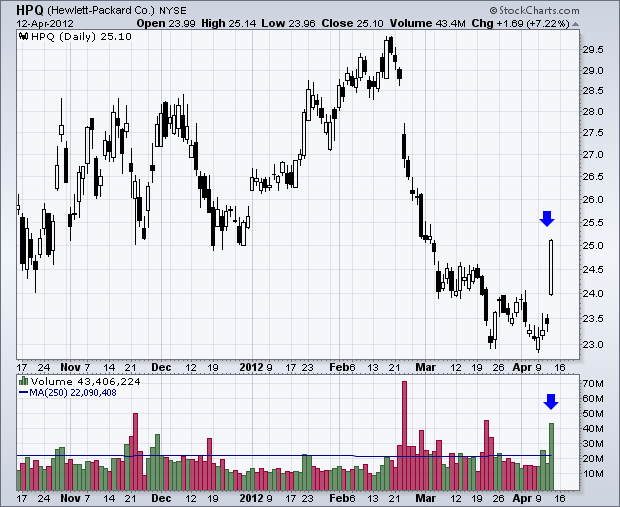
Hewlett Packard Gaps Up on Big Volume
by Arthur Hill,
Chief Technical Strategist, TrendInvestorPro.com
After falling out of favor in February and March, Hewlett Packard found support around 23 and gapped up on Thursday. Notice that the stock opened strong, moved higher throughout the day and closed strong. This gap looks like a breakaway gap that is confirmed by strong volume.
Click this image...
READ MORE
MEMBERS ONLY
German DAX Tests March Low
by Arthur Hill,
Chief Technical Strategist, TrendInvestorPro.com
With a sharp move lower the last five days, the German DAX Index ($DAX) is testing support from the March low. In fact, support in the 6600 area extends back to early February. A break below this support level would suggest an even deeper correction that could weigh on US...
READ MORE
MEMBERS ONLY
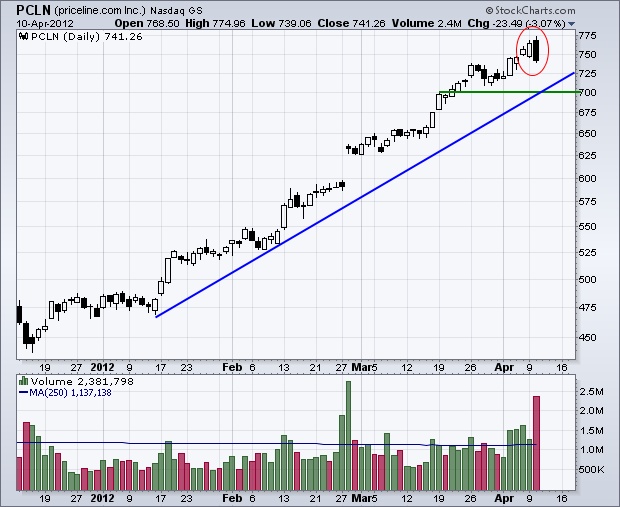
Priceline Forms Bearish Engulfing on High Volume
by Arthur Hill,
Chief Technical Strategist, TrendInvestorPro.com
Priceline has been one of the top performers over the last four months, but a correction may be in the cards after a high-volume bearish engulfing pattern. Notice how the stock opened above the prior close and then declined to close below the prior open. The strong open failed...
READ MORE
MEMBERS ONLY
High-Yield Bond ETF Breaks March Low
by Arthur Hill,
Chief Technical Strategist, TrendInvestorPro.com
The chart below shows the High-Yield Bond ETF (JNK) breaking below its March low with a sharp decline the last eight days. This is negative for stocks because junk bounds and stocks tend to move in the same direction. Notice that the Correlation Coefficient (JNK, $SPX) has been mostly...
READ MORE
MEMBERS ONLY
Finance Sector Has a Rough Week
by Arthur Hill,
Chief Technical Strategist, TrendInvestorPro.com
The nine S&P Sector SPDRs were mixed last week with the defensive sectors scoring gains and the offensive sectors under pressure. The PerfChart below shows the consumer staples, healthcare and utilities sectors gaining for the week, while the fiance, industrials and tech sectors lost ground. With a 2....
READ MORE
MEMBERS ONLY
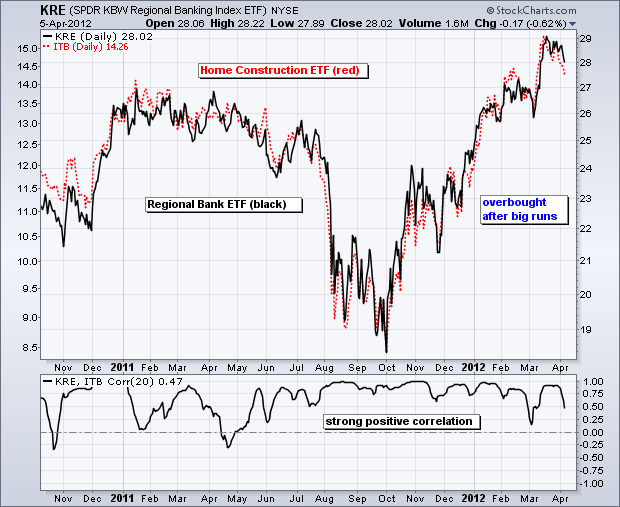
Regional Banks and Housing Stocks Maintain Strong Correlation
by Arthur Hill,
Chief Technical Strategist, TrendInvestorPro.com
The Regional Bank SPDR (KRE) and the Home Construction iShares (ITB) have led the market higher since October. ITB is up over 50% since early October and KRE is up over 40%. The chart below shows ITB in black and KRE in red. Notice how these two moved step-for-...
READ MORE
MEMBERS ONLY
Gold Miners ETF Breaks Down Further
by Arthur Hill,
Chief Technical Strategist, TrendInvestorPro.com
After forming a broadening formation in 2011, the Gold Miners ETF (GDX) broke down with a sharp decline the last six weeks. GDX broke support from the 2011 lows and the next support zone resides in the 47.5 area. The indicator window shows GDX relative to GLD using the...
READ MORE
MEMBERS ONLY
Networking iShares Break Channel Support
by Arthur Hill,
Chief Technical Strategist, TrendInvestorPro.com
The Networking iShares (IGN) shows relative weakness with a lower high in March and channel break the last few days. Relative weakness is also reflected in the price relative (IGN:SPY Ratio), which did not come close to its February high and remains in a downtrend.
Click here for a...
READ MORE
MEMBERS ONLY
Dollar Bullish ETF Surges off Support
by Arthur Hill,
Chief Technical Strategist, TrendInvestorPro.com
The chart below shows Dollar Bullish ETF (UUP) hitting support in the 21.8 area and surging the over 1% the last two days. Notice that UUP formed a higher low above the late October low and this surge could signal a continuation of the November-December advance.
Click here...
READ MORE
MEMBERS ONLY
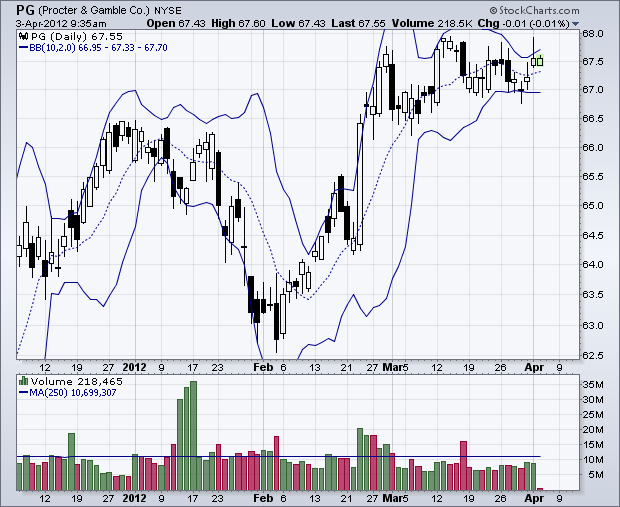
A Bollinger Band Squeeze for Procter & Gamble
by Arthur Hill,
Chief Technical Strategist, TrendInvestorPro.com
After a big surge in February, PG moved into a trading range and the Bollinger Bands contracted significantly. This "squeeze" means volatility is contracting, which in turn could foreshadow a volatility expansion (range break). A close above the upper band would be bullish, while a close below the...
READ MORE
MEMBERS ONLY
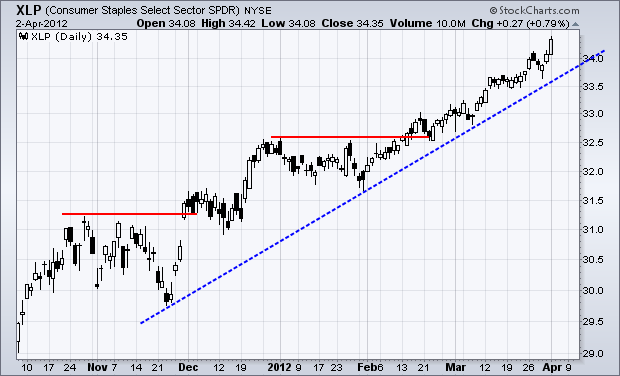
Consumer Staples Sector Hits 52-week High
by Arthur Hill,
Chief Technical Strategist, TrendInvestorPro.com
Even though it may be lagging the S&P 500 ETF (SPY) on a percentage basis, the Consumer Staples SPDR (XLP) is leading the market on a "chart" basis with a 52-week high. In fact, there have been a string of 52-week highs since the...
READ MORE
MEMBERS ONLY
Home Construction iShares Hits 2010 Highs
by Arthur Hill,
Chief Technical Strategist, TrendInvestorPro.com
The Home Construction iShares (ITB) has been one of the best performing ETFs over the last six months, but this run may hit resistance from the 2010 highs in the 15.50 area. The six month trend is clearly up and I would mark support at the early March low....
READ MORE
MEMBERS ONLY
Commodity Groups Hit Hard with Industrial Metals Leading the Way Lower
by Arthur Hill,
Chief Technical Strategist, TrendInvestorPro.com
The six CandleGlance charts shows the CRB Index ($CRB) and five commodity groups. All are down today with the oil heavy CRB Index falling over 1%. The Industrial Metals Index (GJX) moved below its mid February low and the Agriculture Index ($GKX) fell over 4% the last nine days.
Click...
READ MORE
MEMBERS ONLY
SPY Fills Gap, USO Tests Support and GLD Fails
by Arthur Hill,
Chief Technical Strategist, TrendInvestorPro.com
Programming Note: I will be on family vacation the next two weeks and Art's Charts will return on Monday, April 16th. Chinese stocks are under pressure again this morning, but US stock futures are holding fairly firm - so far. Perhaps US stocks look good relative to parts of...
READ MORE
MEMBERS ONLY
Charts of Interest: AMAT, BA, CAKE, DE, MCHP
by Arthur Hill,
Chief Technical Strategist, TrendInvestorPro.com
AMAT Breaks Wedge Support with big Volume.
BA Remains Stuck in Long Consolidation.
DE Declines from Resistance.
Plus CAKE and MCHP
This commentary and charts-of-interest are designed to stimulate thinking. This analysis is not a recommendation to buy, sell, hold or sell short any security (stock ETF or...
READ MORE