MEMBERS ONLY
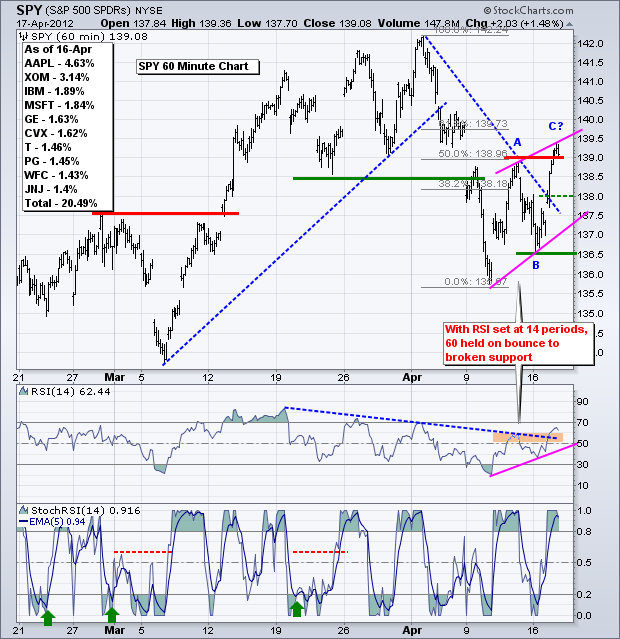
IWM and SPY Bounce to Key Retracements and Resistance
by Arthur Hill,
Chief Technical Strategist, TrendInvestorPro.com
Stocks surged with the oversold Nasdaq 100 ETF (QQQ) leading the major index ETFs higher on Tuesday. What is it about Tuesdays and turnarounds? All sectors were up with technology, industrials and energy leading the charge. IWM and SPY have five day uptrends working on the 60-minute charts, but these...
READ MORE
MEMBERS ONLY
Sector Summary Shows Coal Leading the Energy Sector
by Arthur Hill,
Chief Technical Strategist, TrendInvestorPro.com
The Industry Summary page provides chartists with an easy way to view performance for the nine big sectors and the industry groups that make up these sectors. The image below shows DJ US Coal Industry Index ($DJUSCL) leading the energy sector with a 4 plus percent gains. Chartists can click...
READ MORE
MEMBERS ONLY
IWM Breaks Flag Trendline and USO Forms Small Falling Flag
by Arthur Hill,
Chief Technical Strategist, TrendInvestorPro.com
The short-term trends for the major index ETFs may be down, but the medium-term and long-term trends are still up. Keep this in mind before getting too bearish. My best guess is that stocks will enter some sort of trading range over the next few weeks to digest the big...
READ MORE
MEMBERS ONLY
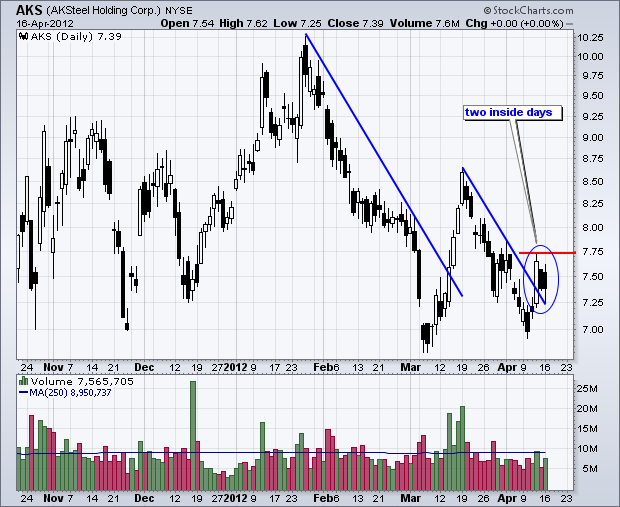
Charts: AKS, DNR, GGP, LLY, ORCL, TRV, UAL, WM
by Arthur Hill,
Chief Technical Strategist, TrendInvestorPro.com
Careful out there. It is earnings season.
AKS Forms Two Inside Days.
TRV Forms Falling Flag after Breakout.
UAL Surges on Higher Volume.
Plus DNR, GGP, LLY, ORCL, WM
This commentary and charts-of-interest are designed to stimulate thinking. This analysis is not a recommendation to buy, sell, hold or sell...
READ MORE
MEMBERS ONLY
Transport iShares Bounces off Range Support
by Arthur Hill,
Chief Technical Strategist, TrendInvestorPro.com
With a bounce the last four days, the Transport iShares (IYT) held support from the early March low and remained range bound. Notice how the ETF has traded between 89.7 and 96 since mid January. Chartists should watch this range for the next directional signal.
Click this image for...
READ MORE
MEMBERS ONLY
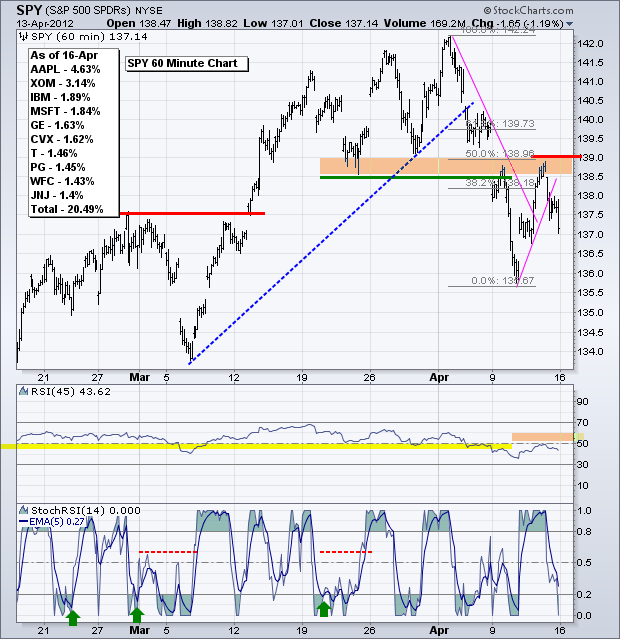
Stocks Reverse Short-Term Uptrends as Dollar Breaks Out
by Arthur Hill,
Chief Technical Strategist, TrendInvestorPro.com
There were some trend changes over the last two weeks and some trend extensions. Most notably, stocks reversed their uptrends and the Dollar reversed its downtrend. While the bigger trend remains up for stocks, April's small-cap led decline started a short-term downtrend with key support breaks last week....
READ MORE
MEMBERS ONLY
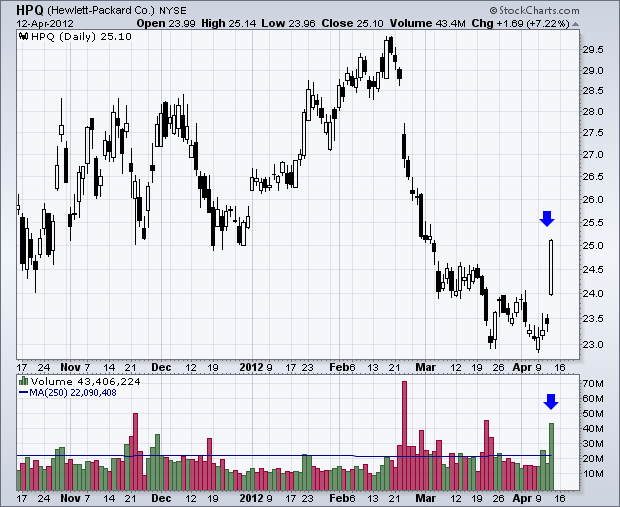
Hewlett Packard Gaps Up on Big Volume
by Arthur Hill,
Chief Technical Strategist, TrendInvestorPro.com
After falling out of favor in February and March, Hewlett Packard found support around 23 and gapped up on Thursday. Notice that the stock opened strong, moved higher throughout the day and closed strong. This gap looks like a breakaway gap that is confirmed by strong volume.
Click this image...
READ MORE
MEMBERS ONLY
German DAX Tests March Low
by Arthur Hill,
Chief Technical Strategist, TrendInvestorPro.com
With a sharp move lower the last five days, the German DAX Index ($DAX) is testing support from the March low. In fact, support in the 6600 area extends back to early February. A break below this support level would suggest an even deeper correction that could weigh on US...
READ MORE
MEMBERS ONLY
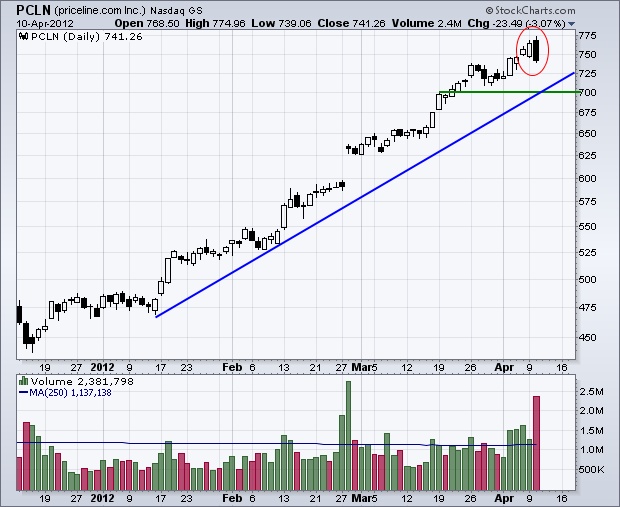
Priceline Forms Bearish Engulfing on High Volume
by Arthur Hill,
Chief Technical Strategist, TrendInvestorPro.com
Priceline has been one of the top performers over the last four months, but a correction may be in the cards after a high-volume bearish engulfing pattern. Notice how the stock opened above the prior close and then declined to close below the prior open. The strong open failed to...
READ MORE
MEMBERS ONLY
High-Yield Bond ETF Breaks March Low
by Arthur Hill,
Chief Technical Strategist, TrendInvestorPro.com
The chart below shows the High-Yield Bond ETF (JNK) breaking below its March low with a sharp decline the last eight days. This is negative for stocks because junk bounds and stocks tend to move in the same direction. Notice that the Correlation Coefficient (JNK, $SPX) has been mostly positive...
READ MORE
MEMBERS ONLY
Finance Sector Has a Rough Week
by Arthur Hill,
Chief Technical Strategist, TrendInvestorPro.com
The nine S&P Sector SPDRs were mixed last week with the defensive sectors scoring gains and the offensive sectors under pressure. The PerfChart below shows the consumer staples, healthcare and utilities sectors gaining for the week, while the fiance, industrials and tech sectors lost ground. With a 2....
READ MORE
MEMBERS ONLY
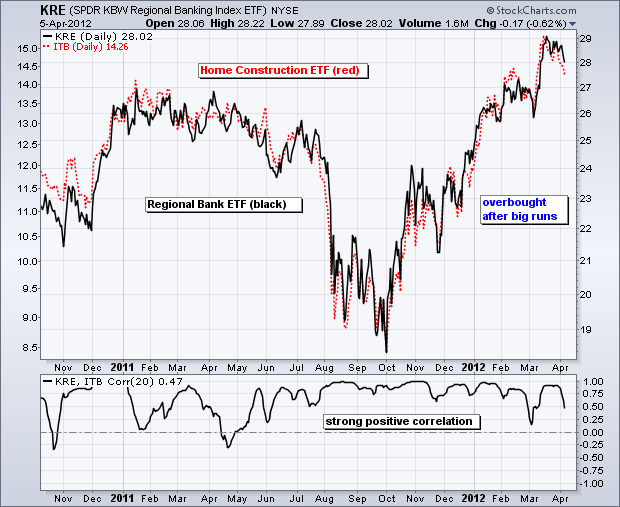
Regional Banks and Housing Stocks Maintain Strong Correlation
by Arthur Hill,
Chief Technical Strategist, TrendInvestorPro.com
The Regional Bank SPDR (KRE) and the Home Construction iShares (ITB) have led the market higher since October. ITB is up over 50% since early October and KRE is up over 40%. The chart below shows ITB in black and KRE in red. Notice how these two moved step-for-step over...
READ MORE
MEMBERS ONLY
Gold Miners ETF Breaks Down Further
by Arthur Hill,
Chief Technical Strategist, TrendInvestorPro.com
After forming a broadening formation in 2011, the Gold Miners ETF (GDX) broke down with a sharp decline the last six weeks. GDX broke support from the 2011 lows and the next support zone resides in the 47.5 area. The indicator window shows GDX relative to GLD using the...
READ MORE
MEMBERS ONLY
Networking iShares Break Channel Support
by Arthur Hill,
Chief Technical Strategist, TrendInvestorPro.com
The Networking iShares (IGN) shows relative weakness with a lower high in March and channel break the last few days. Relative weakness is also reflected in the price relative (IGN:SPY Ratio), which did not come close to its February high and remains in a downtrend.
Click here for a...
READ MORE
MEMBERS ONLY
Dollar Bullish ETF Surges off Support
by Arthur Hill,
Chief Technical Strategist, TrendInvestorPro.com
The chart below shows Dollar Bullish ETF (UUP) hitting support in the 21.8 area and surging the over 1% the last two days. Notice that UUP formed a higher low above the late October low and this surge could signal a continuation of the November-December advance.
Click here for...
READ MORE
MEMBERS ONLY
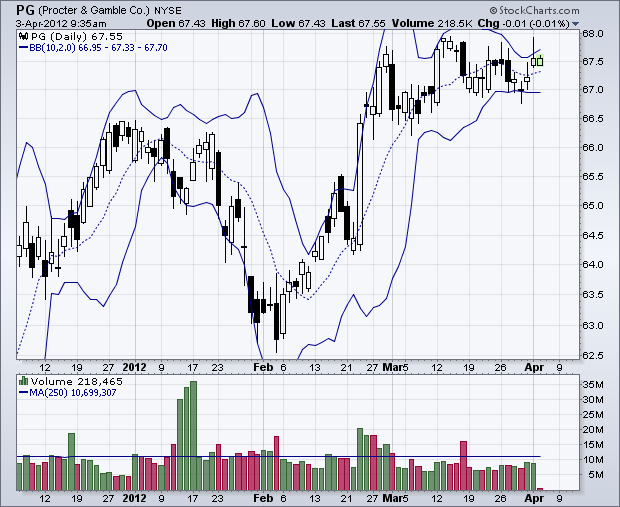
A Bollinger Band Squeeze for Procter & Gamble
by Arthur Hill,
Chief Technical Strategist, TrendInvestorPro.com
After a big surge in February, PG moved into a trading range and the Bollinger Bands contracted significantly. This "squeeze" means volatility is contracting, which in turn could foreshadow a volatility expansion (range break). A close above the upper band would be bullish, while a close below the...
READ MORE
MEMBERS ONLY
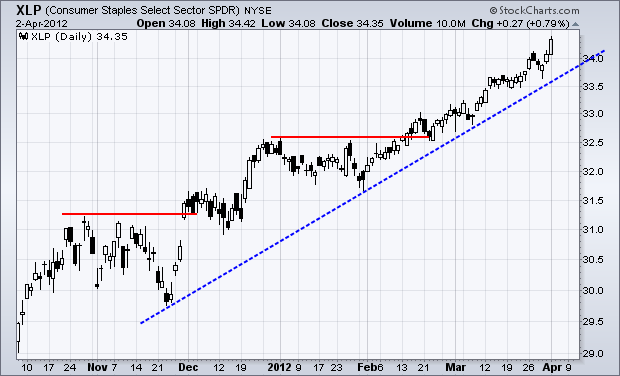
Consumer Staples Sector Hits 52-week High
by Arthur Hill,
Chief Technical Strategist, TrendInvestorPro.com
Even though it may be lagging the S&P 500 ETF (SPY) on a percentage basis, the Consumer Staples SPDR (XLP) is leading the market on a "chart" basis with a 52-week high. In fact, there have been a string of 52-week highs since the latter part...
READ MORE
MEMBERS ONLY
Home Construction iShares Hits 2010 Highs
by Arthur Hill,
Chief Technical Strategist, TrendInvestorPro.com
The Home Construction iShares (ITB) has been one of the best performing ETFs over the last six months, but this run may hit resistance from the 2010 highs in the 15.50 area. The six month trend is clearly up and I would mark support at the early March low....
READ MORE
MEMBERS ONLY
Commodity Groups Hit Hard with Industrial Metals Leading the Way Lower
by Arthur Hill,
Chief Technical Strategist, TrendInvestorPro.com
The six CandleGlance charts shows the CRB Index ($CRB) and five commodity groups. All are down today with the oil heavy CRB Index falling over 1%. The Industrial Metals Index (GJX) moved below its mid February low and the Agriculture Index ($GKX) fell over 4% the last nine days.
Click...
READ MORE
MEMBERS ONLY
SPY Fills Gap, USO Tests Support and GLD Fails
by Arthur Hill,
Chief Technical Strategist, TrendInvestorPro.com
Programming Note: I will be on family vacation the next two weeks and Art's Charts will return on Monday, April 16th. Chinese stocks are under pressure again this morning, but US stock futures are holding fairly firm - so far. Perhaps US stocks look good relative to parts...
READ MORE
MEMBERS ONLY
Charts of Interest: AMAT, BA, CAKE, DE, MCHP
by Arthur Hill,
Chief Technical Strategist, TrendInvestorPro.com
AMAT Breaks Wedge Support with big Volume.
BA Remains Stuck in Long Consolidation.
DE Declines from Resistance.
Plus CAKE and MCHP
This commentary and charts-of-interest are designed to stimulate thinking. This analysis is not a recommendation to buy, sell, hold or sell short any security (stock ETF or otherwise). We...
READ MORE
MEMBERS ONLY
SPY Holds Flag Breakout, but USO Remains in Downtrend
by Arthur Hill,
Chief Technical Strategist, TrendInvestorPro.com
Chinese stocks got slammed on Wednesday and pervasive weakness could weigh on US stocks. The major index ETFs remain in uptrends, but are overbought after big moves on Monday and still quite vulnerable to both a short-term and medium-term correction. On the S&P 500 ETF (SPY) chart, the...
READ MORE
MEMBERS ONLY
Metals & Mining ETF Leads Market Lower
by Arthur Hill,
Chief Technical Strategist, TrendInvestorPro.com
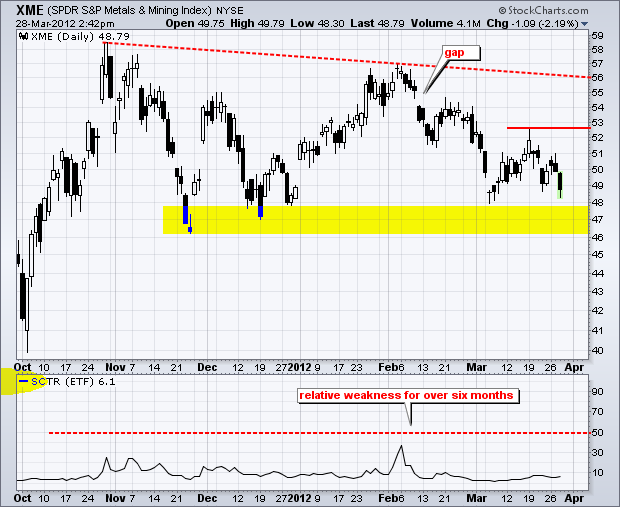
The Metals & Mining SPDR (XME) continues to show relative weakness as it tests its support zone stemming from the November-December lows. Also notice that the StockCharts Technical Rank (SCTR) confirms relative weakness by holding below 50 for over six months.
Click this image for a live chart...
READ MORE
MEMBERS ONLY
Triple Top Breakdown for the Energy SPDR $XLE
by Arthur Hill,
Chief Technical Strategist, TrendInvestorPro.com
On the Point & Figure chart below, the Energy SPDR (XLE) forged a Triple Bottom Breakdown when the most recent O-Column moved below the equal lows of the prior two O-Columns. This breakdown is bearish with a downside projection around 67.50, which coincides with the Bullish Support Line extending...
READ MORE
MEMBERS ONLY
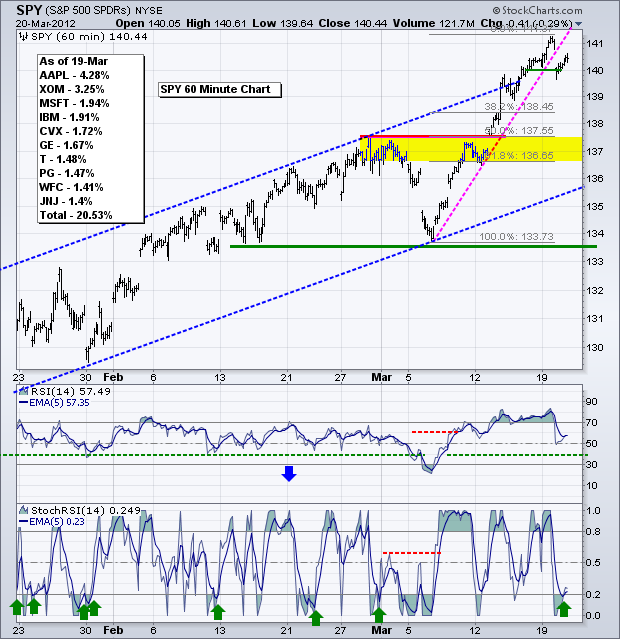
Dollar Extends Downtrend as Gold Surges above Resistance
by Arthur Hill,
Chief Technical Strategist, TrendInvestorPro.com
Stocks moved sharply higher on Monday with small-caps leading the charge. Sector-wise, the technology, consumer discretionary, finance, industrials and healthcare sectors gained over 1.5% to show upside leadership. It was yet another a broad market surge within an uptrend that began way back on 19-Dec. On the S&...
READ MORE
MEMBERS ONLY
Charts of Interest: ALK, AMX, FCX, LUV, MCP, MON, XRX
by Arthur Hill,
Chief Technical Strategist, TrendInvestorPro.com
AMX Surges above Resistance with Good Volume.
LUV Bounces off Support with High Volume.
MON Consolidates with Tight Triangle.
Plus ALK, FCX, MCP, XRX
This commentary and charts-of-interest are designed to stimulate thinking. This analysis is not a recommendation to buy, sell, hold or sell short any security (stock ETF...
READ MORE
MEMBERS ONLY
TechTarget Breaks Resistance on Low Volume
by Arthur Hill,
Chief Technical Strategist, TrendInvestorPro.com
After consolidating since mid February, TechTarget (TTGT) finally made a break with a three-day surge above resistance. The move looks impressive price-wise, but volume is sorely lacking thus far. Even though Monday's trading has yet to close, volume on the three day advance did not validate this breakout....
READ MORE
MEMBERS ONLY
QQQ Forms Pennant/Wedge as UUP Breaks Flag Support
by Arthur Hill,
Chief Technical Strategist, TrendInvestorPro.com
Stocks got an oversold bounce with small-caps, materials and energy leading the way on Friday. Despite this bounce, these three are lagging the broader market overall, which means this is a case of the worst hit groups getting the best bounce. Relative weakness in small-caps and the deterioration in breadth...
READ MORE
MEMBERS ONLY
Finisar Consolidates at Key Retracement $FNSR
by Arthur Hill,
Chief Technical Strategist, TrendInvestorPro.com
Finisar (FNSR) plunged with a move from 23.50 to 18, but found support right at the 61.80% retracement line, which is based on a Fibonacci number. Even though the stock has yet to recover, it is consolidating with clear support and resistance levels to watch going forward.
Click...
READ MORE
MEMBERS ONLY
Indicators Remains Positive Overall, but McClellans Weaken
by Arthur Hill,
Chief Technical Strategist, TrendInvestorPro.com
The indicator summary remains firmly positive with relative weakness in small-caps the only concern in the market right now. Well, I am also concerned with overbought conditions that could lead to a corrective period ahead. Nevertheless, we have yet to see any signs of significant selling pressure. The current advance...
READ MORE
MEMBERS ONLY
SPY Forms Potential Bull Flag as UUP Forms Bear Flag
by Arthur Hill,
Chief Technical Strategist, TrendInvestorPro.com
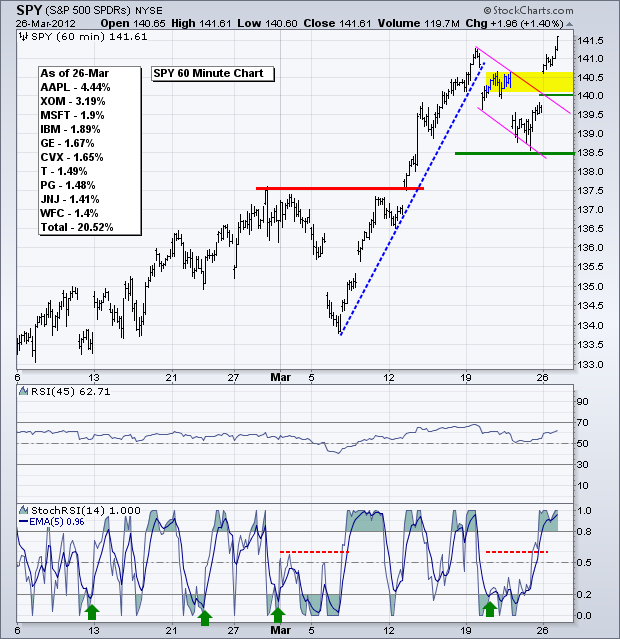
The second shoe dropped for the S&P 500 ETF (SPY) and Russell 2000 ETF (IWM), but the Nasdaq 100 ETF (QQQ) held up rather well (surprise, surprise). I heard an interview with Barry Ritholtz talking about the four asset classes: stocks, commodities, bonds and Apple. While Apple sentiment...
READ MORE
MEMBERS ONLY
Energy Sector Turns Red on Market Carpet
by Arthur Hill,
Chief Technical Strategist, TrendInvestorPro.com
The Sector Market Carpet shows the nine S&P sectors with the energy sector displaying the most red. The average stock is down 2.9% and three of the five biggest losers come from this sector. Defensive sectors held up the best on Thursday with consumer staples, healthcare and...
READ MORE
MEMBERS ONLY
SPY Forms Bear Pennant as UUP Bounces off Retracement
by Arthur Hill,
Chief Technical Strategist, TrendInvestorPro.com
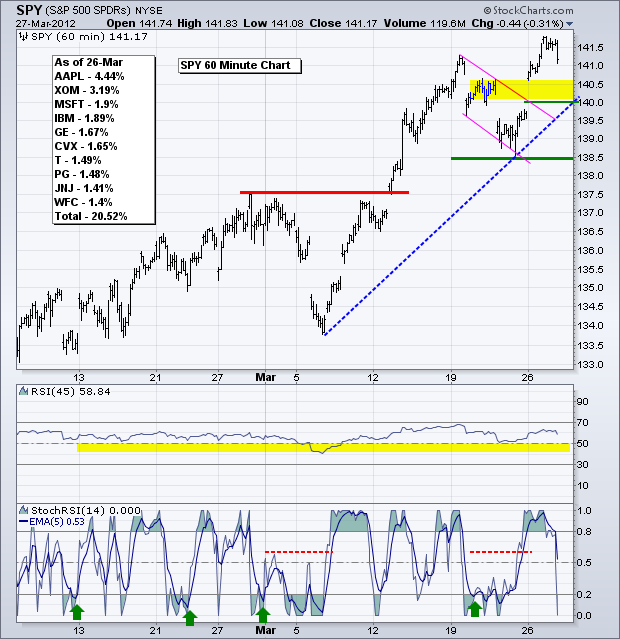
Is the second shoe about to drop? Stocks fell sharply on the open Tuesday and then consolidated since this open. Short-term, and I do mean very short-term, the S&P 500 ETF (SPY) held the gap down and formed a pennant consolidation on the 60-minute chart. A break below...
READ MORE
MEMBERS ONLY
Charts of Interest: AMGN, CAT, HAL, KSS, OIH, MON, SWC
by Arthur Hill,
Chief Technical Strategist, TrendInvestorPro.com
CAT Gaps Down on High Volume.
KSS Stalls after Gap Down.
MON Forms Triangle Consolidation.
Plus AMGN, HAL, OIH, SWC
This commentary and charts-of-interest are designed to stimulate thinking. This analysis is not a recommendation to buy, sell, hold or sell short any security (stock ETF or otherwise). We all...
READ MORE
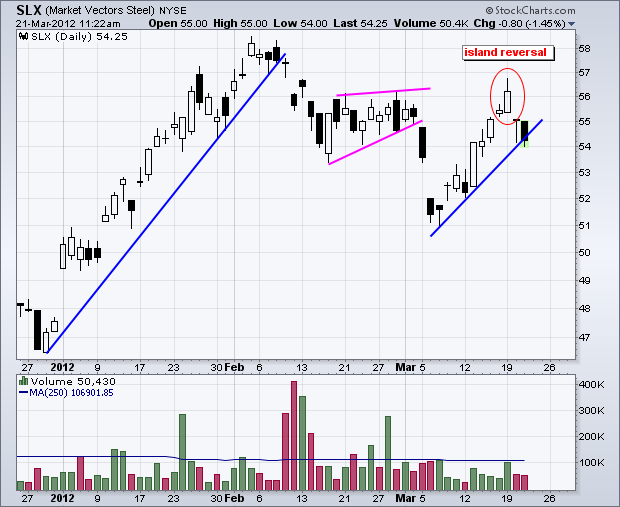
MEMBERS ONLY
Steel ETF Forges Island Reversal with Gap Down $SLX
by Arthur Hill,
Chief Technical Strategist, TrendInvestorPro.com
With a gap up, two candlesticks and a gap down, the Steel ETF (SLX) formed an island reversal over the last five days. Notice that this reversal formed near the late February highs and the ETF broke the March trendline with further weakness on Wednesday.
Click this image for a...
READ MORE
MEMBERS ONLY
SPY Bounces After Gap as USO Fails to Hold Breakout
by Arthur Hill,
Chief Technical Strategist, TrendInvestorPro.com
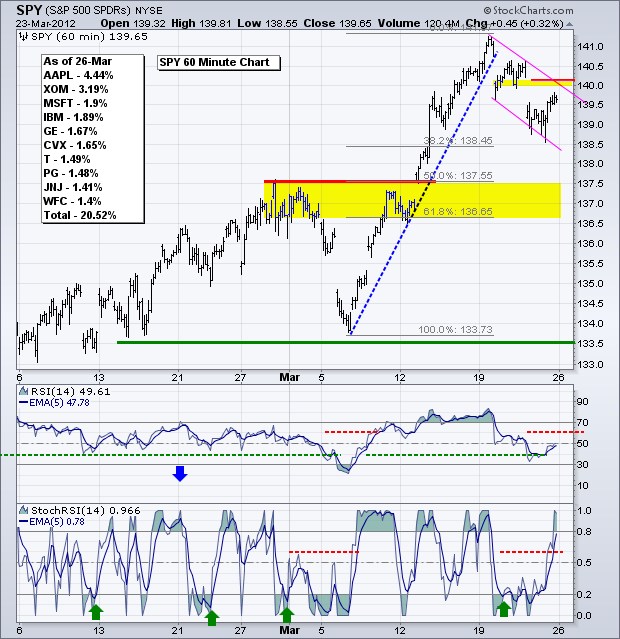
Stocks were hit with selling pressure on the open, but the major index ETFs worked their way higher the rest of the day. The S&P 500 ETF (SPY) opened around 140 and worked its way to the 140.60 area by the afternoon. On the 10-minute chart, this...
READ MORE
MEMBERS ONLY
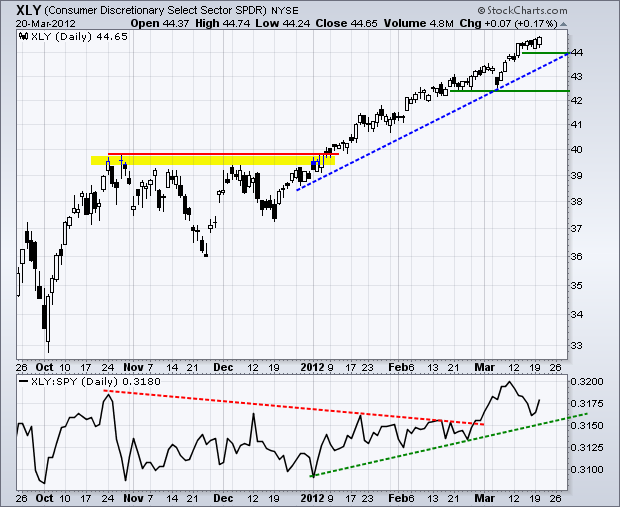
Consumer Discretionary SPDR Hits 52-week High
by Arthur Hill,
Chief Technical Strategist, TrendInvestorPro.com
Want to gauge retail spending? Just take a look at the Consumer Discretionary SPDR (XLY), which hit a new 52-week high today. There are 80 stocks in this sector and most are dependant on consumer spending to drive revenues (think Disney, Macy's, Amazon, Starbucks, DR Horton). New highs...
READ MORE
MEMBERS ONLY
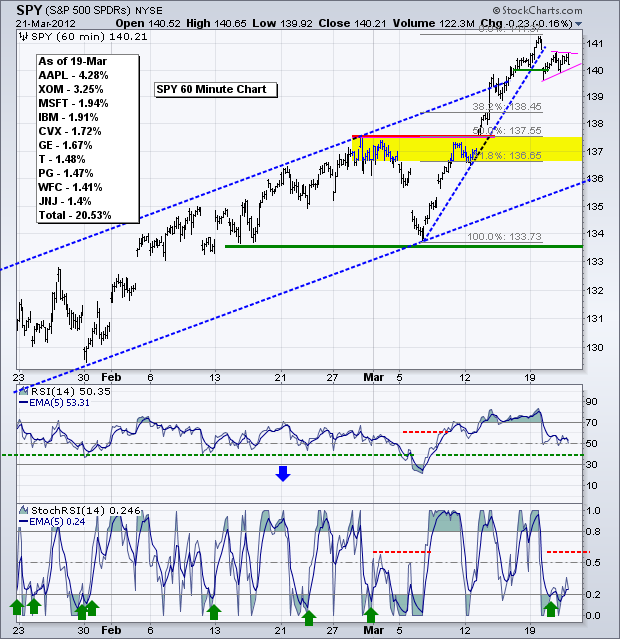
SPY Becomes More Overbought as USO Breaks Wedge Trendline
by Arthur Hill,
Chief Technical Strategist, TrendInvestorPro.com
The song remains the same (circa 1973). Stocks are overbought, but there are simply no signs of significant selling pressure. Maybe that will change with stock futures down in early trading on turnaround Tuesday. Over the last nine days, the S&P 500 ETF (SPY) is up 4.98%...
READ MORE
MEMBERS ONLY
Charts: AMZN, BIDU, CHH, CHRW, D, QLGC, RDC, WIN
by Arthur Hill,
Chief Technical Strategist, TrendInvestorPro.com
AMZN Underperforms with Triangle Consolidation.
CHH Stalls Below Late December high.
RDC Forms Harami Cross within Rising Wedge.
Plus BIDU, CHH, CHRW, D, QLGC and WIN
This commentary and charts-of-interest are designed to stimulate thinking. This analysis is not a recommendation to buy, sell, hold or sell short any security...
READ MORE
MEMBERS ONLY
Crude Oil Volatility Index Plummets
by Arthur Hill,
Chief Technical Strategist, TrendInvestorPro.com
Volatility is falling everywhere these days. Notice that the CBOE Volatility Index ($VIX) and the Crude Oil Volatility Index ($OVX) both moved sharply lower in March. $OVX plunged the last two weeks as Spot Light Crude bounced off the 105 area for the second time this month.
Click this image...
READ MORE