MEMBERS ONLY
USO Challenges Trendline - RSI Hits Supprt Zone for UUP
by Arthur Hill,
Chief Technical Strategist, TrendInvestorPro.com
Stocks are about as overbought as they have been in a long time. Even so, there are simply no signs of significant or sustained selling pressure. Declines, such as those seen in late January or early March, have been short affairs lasting just a few days. The subsequent rallies proved...
READ MORE
MEMBERS ONLY
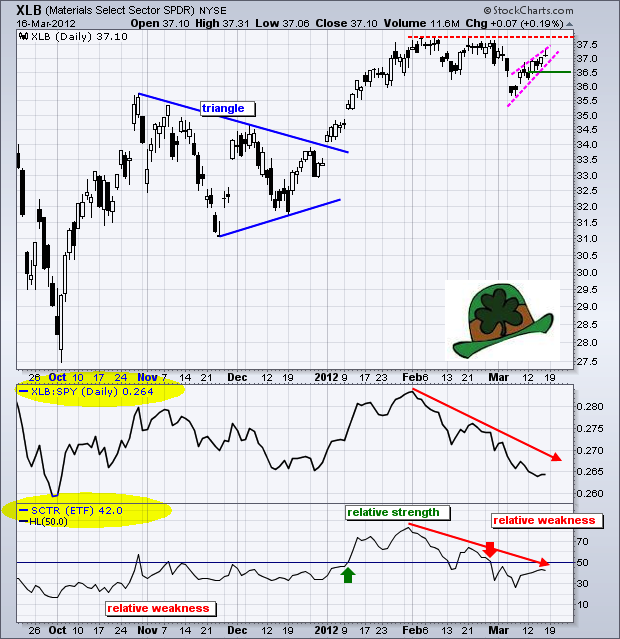
Materials SPDR Continues to Show Relative Weakness
by Arthur Hill,
Chief Technical Strategist, TrendInvestorPro.com
While the S&P 500 and Dow moved to new highs last week, the Materials SPDR (XLB) fell short of its February highs and continues to underperform. Also note that the Technology SPDR (XLK) and Consumer Discretional SPDR moved to new 52-week highs last week. Along with the Finance...
READ MORE
MEMBERS ONLY
Gold SPDR Firms in Key Retracement Zone
by Arthur Hill,
Chief Technical Strategist, TrendInvestorPro.com
It has been a tough March for gold, but the Gold SPDR (GLD) may be at support marked by the Fibonacci Retracements Tool. Notice that the decline to 159 retraced 50-61.80% of the prior advance and the ETF firmed just above 160 the last two days. Watch for a...
READ MORE
MEMBERS ONLY
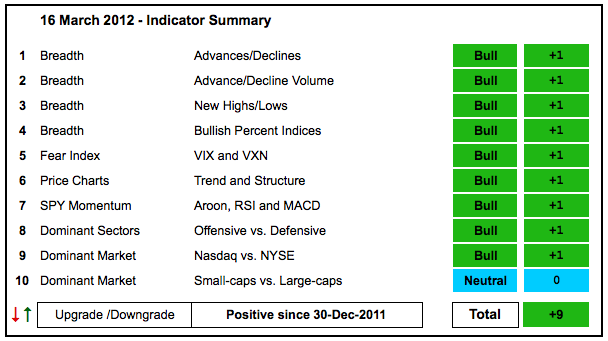
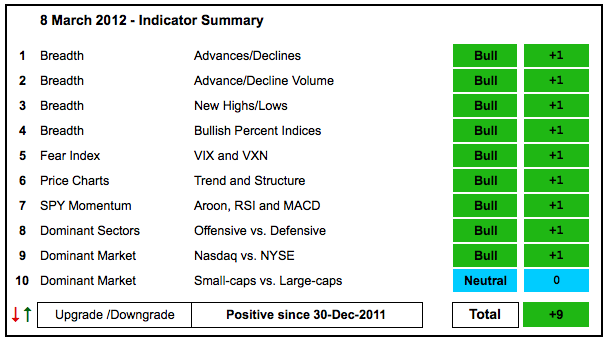
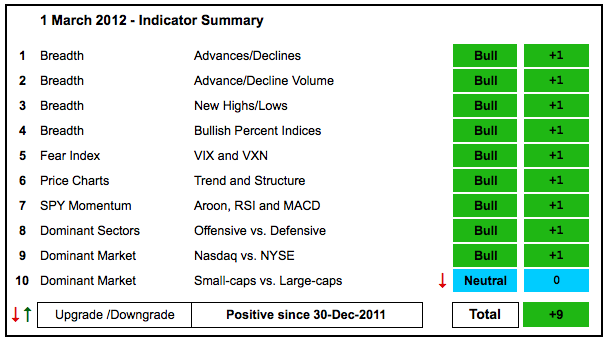
Nasdaq and NYSE AD Volume Lines Hit New 52-week Highs
by Arthur Hill,
Chief Technical Strategist, TrendInvestorPro.com
There is no change in the indicator summary. Nine indicators were bullish at the start of the week and nine remain bullish. The AD Volume Lines surged to new highs with a strong move the last seven days. Net New Highs also expanded on both the NYSE and Nasdaq as...
READ MORE
MEMBERS ONLY
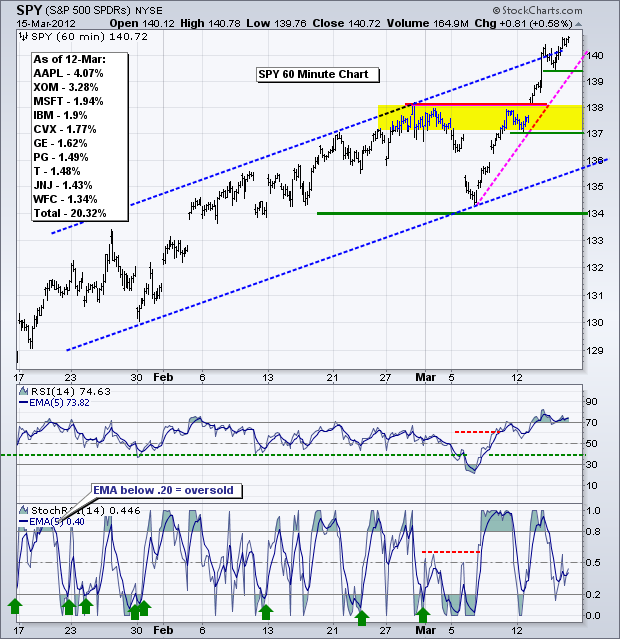
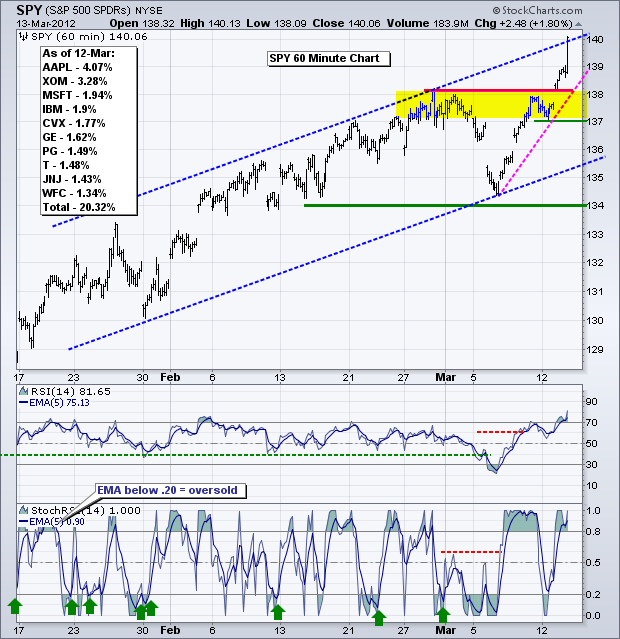
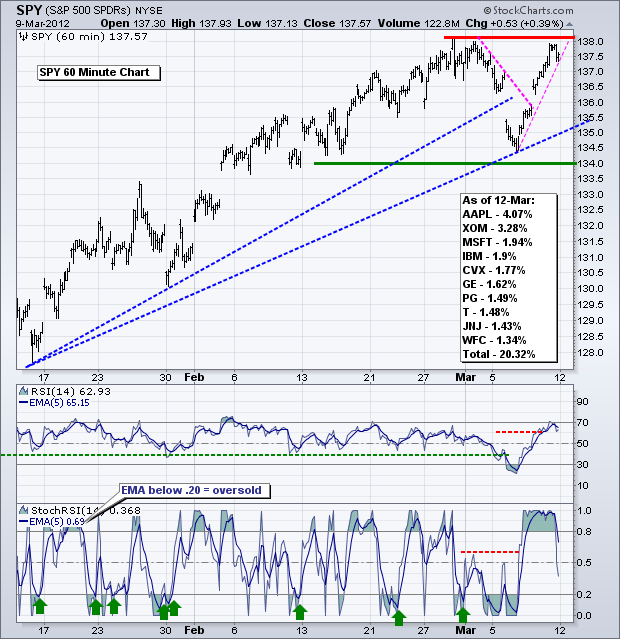
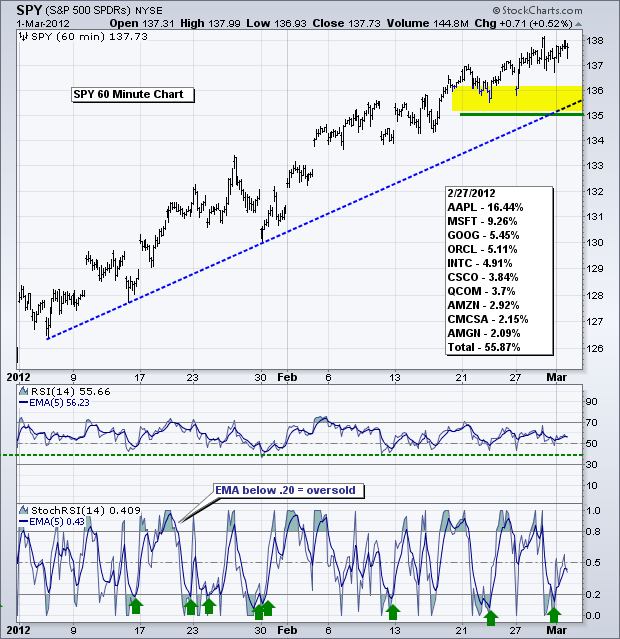
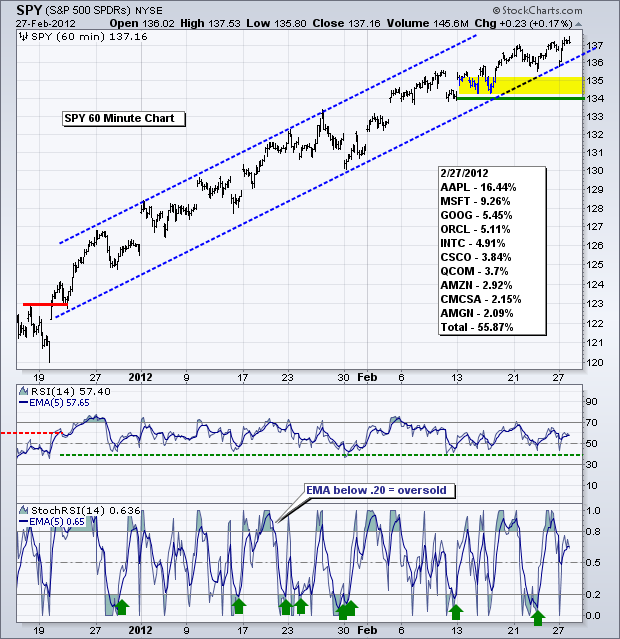
SPY Exceeds Channel Trendline - USO Forms Falling Wedge
by Arthur Hill,
Chief Technical Strategist, TrendInvestorPro.com
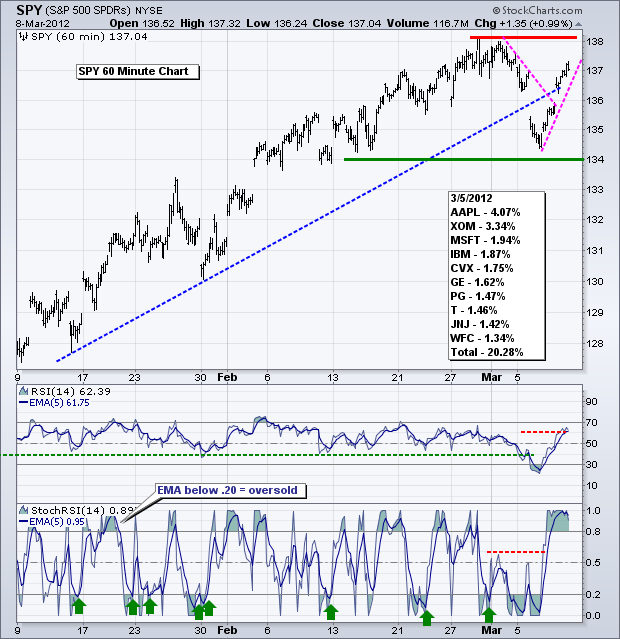
There is not much change overall. Stocks remain in strong uptrends with no signs of selling pressure. The S&P 500 ETF (SPY) surged above the upper trendline of a rising channel. There are two trends at work on this 60-minute chart. First, the rising channel defines an uptrend...
READ MORE
MEMBERS ONLY
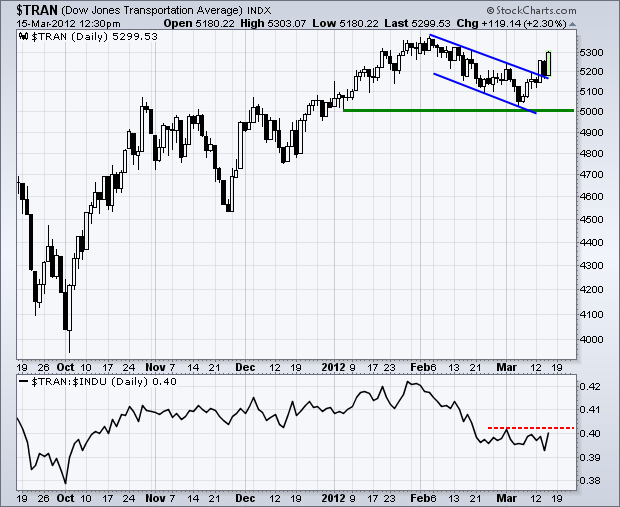
Dow Transports Play Catch Up with Big Move
by Arthur Hill,
Chief Technical Strategist, TrendInvestorPro.com
The Dow Transports has been lagging the Dow Industrials for several weeks now, but is making a catch up bid with a falling flag breakout the last few days. After a breakout on Monday, the Average fell back sharply on Tuesday with a close below 5200. This decline was wiped...
READ MORE
MEMBERS ONLY
Treasuries and Gold Fall off a Cliff as Stocks Hold Gains
by Arthur Hill,
Chief Technical Strategist, TrendInvestorPro.com
Treasuries are falling off a cliff, commodities are softening, gold is plunging, the Dollar is strengthening and stocks remain the best game in town. The recent decline in treasuries suggests that the economy will continue to expand and the labor market will continue to improve. Money moving out of treasuries...
READ MORE
MEMBERS ONLY
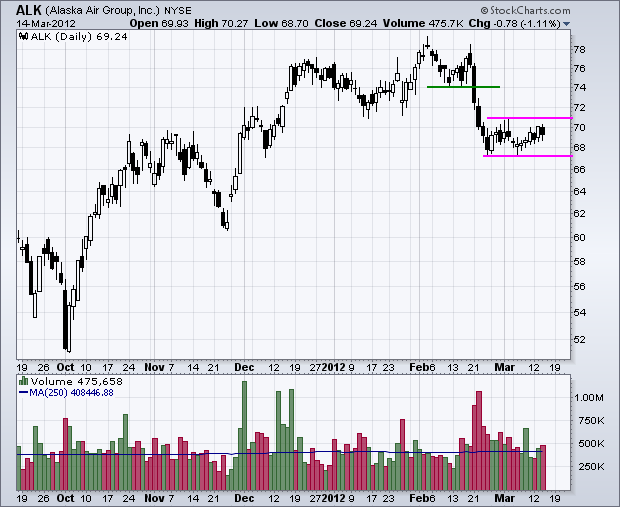
Charts of Interest: ALK, JOYG, LEAP, MOS, SNDK, TTWO
by Arthur Hill,
Chief Technical Strategist, TrendInvestorPro.com
ALK Consolidates after Break Down.
MOS Forms Bear Flag on Low Volume.
SNDK Falls Back below Tuesday's Low.
Plus JOYG, LEAP, TTWO.
This commentary and charts-of-interest are designed to stimulate thinking. This analysis is not a recommendation to buy, sell, hold or sell short any security (stock ETF...
READ MORE
MEMBERS ONLY
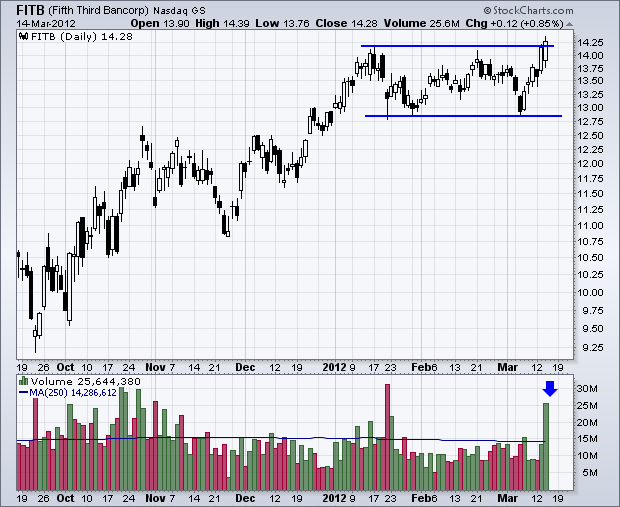
Fifth Third Bancorp Joins the New High List with Big Volume
by Arthur Hill,
Chief Technical Strategist, TrendInvestorPro.com
Looking for a list of market leaders? Simply go to the pre-defined scans page for a list of stocks hitting new 52-week highs. Over 500 stocks made the list on Tuesday and over 400 made the list today. The chart below shows Fifth Third Bancorp (FITB) breaking consolidation resistance and...
READ MORE
MEMBERS ONLY
SPY Surges above Channel Trendline as TLT Breaks Down
by Arthur Hill,
Chief Technical Strategist, TrendInvestorPro.com
Stocks caught a big bullish wind in the final hour and surged with financials leading the charge. Yesterday's surge certainly has the markings of a blow-off top, which is the opposite of a selling climax. However, picking a top in this environment is very dangerous. On the 60-minute...
READ MORE
MEMBERS ONLY
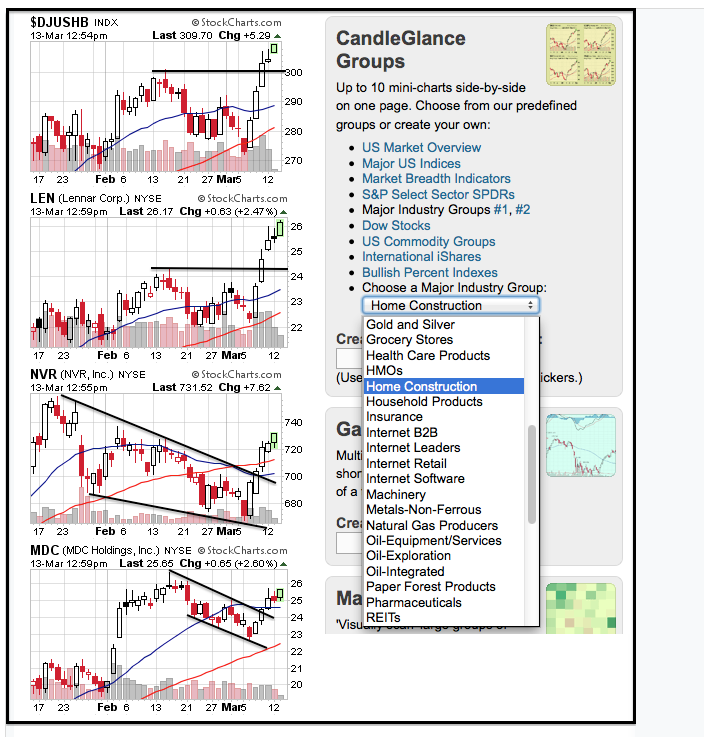
CandleGlance Charts Show Strength in Home Construction Stocks
by Arthur Hill,
Chief Technical Strategist, TrendInvestorPro.com
Chartists can access CandleGlance charts for dozens of industry groups on the FreeCharts page. The screen shot below shows some charts from the Home Construction industry group on the left and the industry group drop-down menu from the Free Charts page. Talk about relative strength. Several stocks in this group...
READ MORE
MEMBERS ONLY
SPY and QQQ Stall Near late February Highs
by Arthur Hill,
Chief Technical Strategist, TrendInvestorPro.com
Stocks were mixed on Monday with the Dow edging higher and the Russell 2000 edging lower. Sector action was also mixed with technology gaining a fraction and the consumer discretionary sector finishing slightly lower. In an interesting twist, the consumer staples and utilities sectors were the biggest gainers. In fact,...
READ MORE
MEMBERS ONLY
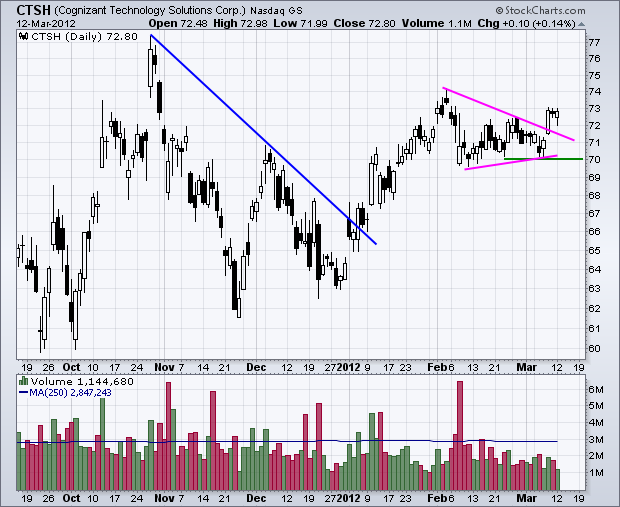
Charts of Interest: CTSH, CTXS, DANG, GOOG, WCRX, WFT
by Arthur Hill,
Chief Technical Strategist, TrendInvestorPro.com
CTXS Challenges Resistance with 3-Day Surge.
GOOG Breaks Wedge Trendline with Gap.
WCRX Moves Above Channel Trendline.
Plus CTSH, DANG, WFT
This commentary and charts-of-interest are designed to stimulate thinking. This analysis is not a recommendation to buy, sell, hold or sell short any security (stock ETF or otherwise). We...
READ MORE
MEMBERS ONLY
RIMM Tests its Low and Shows Relative Weakness
by Arthur Hill,
Chief Technical Strategist, TrendInvestorPro.com
Research in Motion (RIMM) remains down in the dumps as the Price Relative broke below its December low and remains in a downtrend. This RIMM:QQQ ratio falls when RIMM underperforms QQQ. On the price chart, RIMM is testing its December low, but the new low in the Price Relative...
READ MORE
MEMBERS ONLY
Stocks Move from Oversold to Overbougt, Even as Dollar Surges
by Arthur Hill,
Chief Technical Strategist, TrendInvestorPro.com
After a sharp setback on Tuesday, stocks moved from oversold to overbought in three days. The Russell 2000 ETF (IWM) surged from 78.5 to 81.5 (3.8%), the S&P 500 ETF (SPY) moved back to resistance at 138 and the Nasdaq 100 ETF (QQQ) is challenging...
READ MORE
MEMBERS ONLY
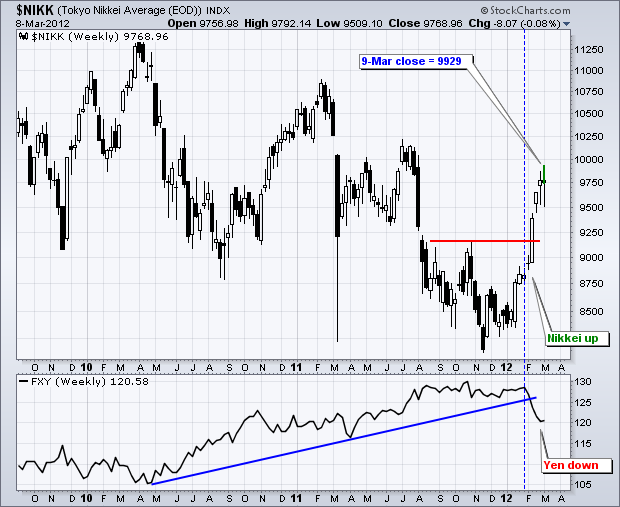
Falling Yen Pushes Nikkei Towards 10K
by Arthur Hill,
Chief Technical Strategist, TrendInvestorPro.com
Lifted by exporters, the Nikkei 225 ($NIKK) is one of the best performing markets over the last eight weeks. The chart below shows the index surging from ±8400 to ±9900 since mid January (+17.8%). With lots of exporters, the sharp drop in the Yen ETF (FXY) no doubt helped...
READ MORE
MEMBERS ONLY
Small-Caps Underperforming, but Evidence Remains Largely Bullish
by Arthur Hill,
Chief Technical Strategist, TrendInvestorPro.com
The first selling pressure in some three months hit the stock market this week, but the short 1-3 day decline is a mere blip in the bigger uptrend. Stocks were overbought and some sort of corrective period is perfectly normal. The correction already started for the Russell 2000 ETF (IWM)...
READ MORE
MEMBERS ONLY
QQQ Challenges its Highs as TLT Breaks Down
by Arthur Hill,
Chief Technical Strategist, TrendInvestorPro.com
There is nothing like the first decent dip after a strong advance. Stocks advanced for some 11 weeks and then corrected hard with a sharp decline Friday-Monday-Tuesday. The S&P 500 ETF (SPY) was down around 2% over these three days. Those who missed the rally or were under...
READ MORE
MEMBERS ONLY
Gold Bounces off Ichimoku Cloud
by Arthur Hill,
Chief Technical Strategist, TrendInvestorPro.com
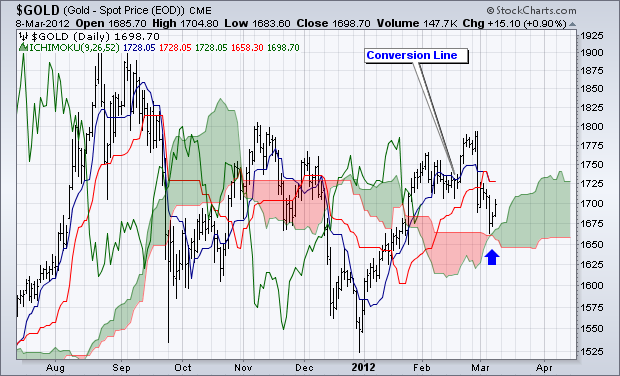
Spot Gold ($GOLD) declined sharply and then found support right at the Ichimoku Cloud with a bounce the last two days. The bulls grabbed the edge with the cloud breakout in January and hold the edge as long as cloud support holds. Watch for a move above the Conversion Line...
READ MORE
MEMBERS ONLY
SPY Moves Back above Support Break at Dollar Hits Resistance
by Arthur Hill,
Chief Technical Strategist, TrendInvestorPro.com
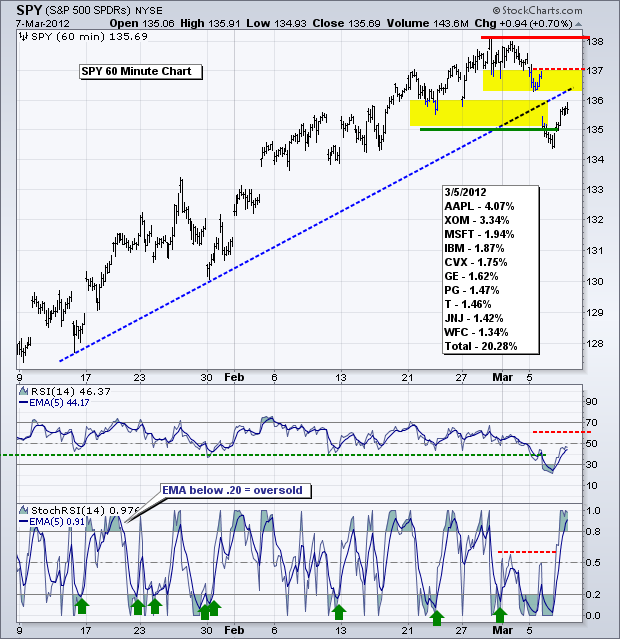
After sharp declines that created oversold conditions on Tuesday, stocks firmed and bounced on Wednesday. The S&P 500 ETF (SPY) broke support at 135 on Tuesday, but moved back above this level on Wednesday. Even though the short-term trend is considered down, the bigger trend is up and...
READ MORE
MEMBERS ONLY
Charts of Interest: ADP, AMZN, ANF, BMY, CHKP, CNP, TBT
by Arthur Hill,
Chief Technical Strategist, TrendInvestorPro.com
AMZN Consolidates with Triangle Pattern.
BMY Consolidates after Breakout.
CNP Forms Bull Flag at Trendline Resistance.
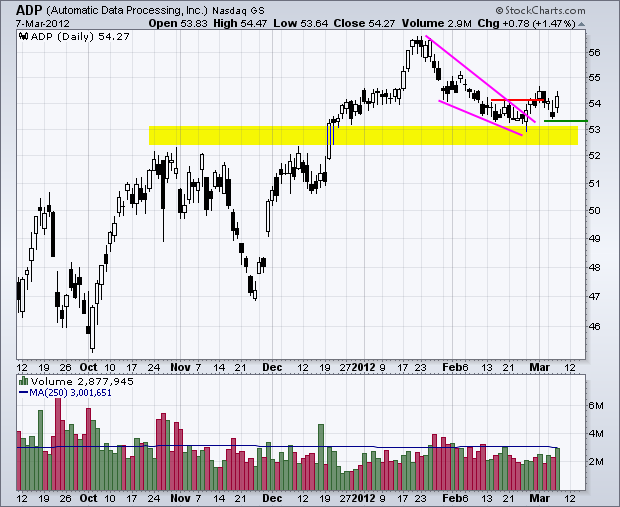
Plus ADP, ANF, CHKP, TBT.
This commentary and charts-of-interest are designed to stimulate thinking. This analysis is not a recommendation to buy, sell, hold or sell short any security (stock ETF or otherwise). We...
READ MORE
MEMBERS ONLY
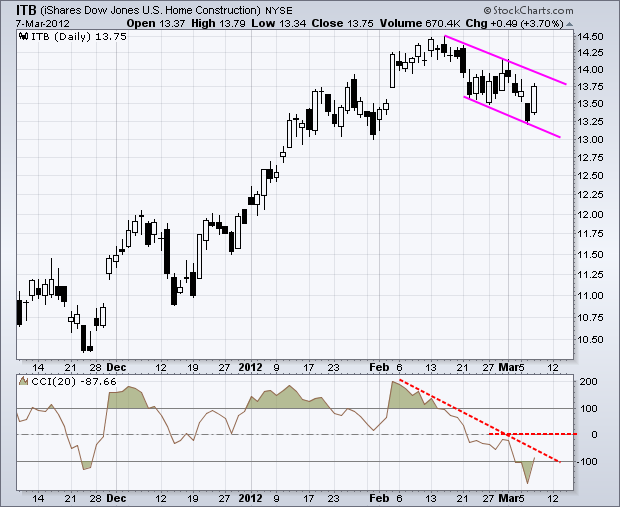
CCI Bounces from Oversold Levels for Home Construction iShares
by Arthur Hill,
Chief Technical Strategist, TrendInvestorPro.com
The Home Construction iShares (ITB) corrected over the last few weeks with a falling flag pattern taking shape. The flag is still falling, but the Commodity Channel Index is rebounding with a move back above -100 (oversold). The next step for CCI is a trendline break.
Click this image for...
READ MORE
MEMBERS ONLY
SPY Breaks Support as UUP Challenges February High
by Arthur Hill,
Chief Technical Strategist, TrendInvestorPro.com
Stocks clearly broke down with a broad-based decline on Tuesday. Even though the short-term trend is now down, keep in mind that stocks are already short-term oversold and the medium-term trend is still up. On the S&P 500 ETF (SPY) chart, the ETF broke the support zone with...
READ MORE
MEMBERS ONLY
Morgan Stanley Leads Lower as Supervalu Bucks the Bears
by Arthur Hill,
Chief Technical Strategist, TrendInvestorPro.com
With stocks down sharply in early trading on Tuesday, it is little surprise that the Sector Market Carpet shows a sea of red and all sectors are lower. There are, however, a few gainers and three come from the consumer discretionary sector, strangely enough. Morgan Stanley, the biggest loser, is...
READ MORE
MEMBERS ONLY
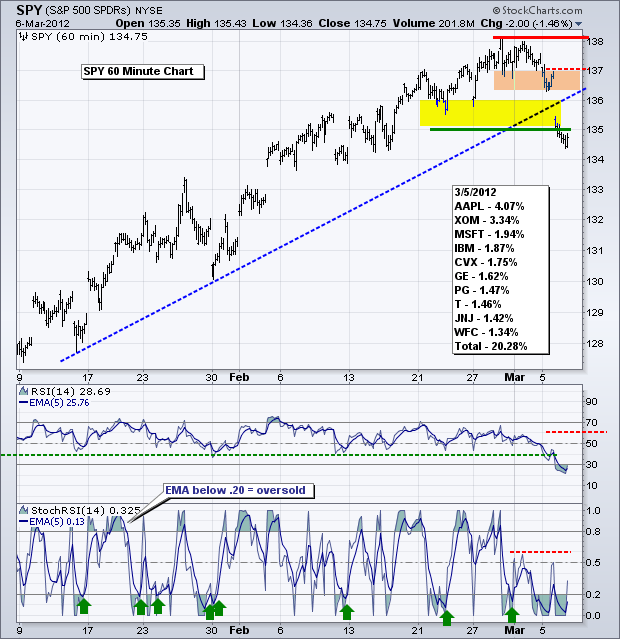
RSI Breaks Support for SPY and Dollar Forms High-Tight Flag
by Arthur Hill,
Chief Technical Strategist, TrendInvestorPro.com
The S&P 500 ETF (SPY) dipped below 137 on Monday. While this is still viewed as a correction within an uptrend, note that RSI dipped to its lowest level since mid December. StochRSI also dipped below .20 twice and failed to break back above the resistance zone (.50-....
READ MORE
MEMBERS ONLY
Charts of Interest: CAKE, CVH, EXPD, MRK, UIS, UNP
by Arthur Hill,
Chief Technical Strategist, TrendInvestorPro.com
CAKE Consolidates after Sharp Decline.
EXPD Surges to Resistance.
MRK Bounds off October Trendline.
Plus CVH, UIS, UNP
This commentary and charts-of-interest are designed to stimulate thinking. This analysis is not a recommendation to buy, sell, hold or sell short any security (stock ETF or otherwise). We all need to...
READ MORE
MEMBERS ONLY
The Noose Tightens for the Utilities SPDR
by Arthur Hill,
Chief Technical Strategist, TrendInvestorPro.com
With the volatility contracting over the last few weeks, the Bollinger Bands on the Utilities SPDR (XLU) are at their narrowest since March 2011. The Bollinger BandWdith indicator is below .50 and the XLU range has narrowed to 75 cents. Watch support and resistance for the next directional clue.
Click...
READ MORE
MEMBERS ONLY
IWM Breaks Support as UUP Surges Twice
by Arthur Hill,
Chief Technical Strategist, TrendInvestorPro.com
The S&P 500 ETF and Nasdaq 100 ETF remain in uptrends, but the Russell 2000 ETF broke support and the Dollar ETF appears to be breaking out. Relative weakness in small-caps and strength in the greenback could further weigh on stocks, which are still overbought and ripe for...
READ MORE
MEMBERS ONLY
Small-caps Continue to Lag as Russell 2000 Breaks February Lows
by Arthur Hill,
Chief Technical Strategist, TrendInvestorPro.com
Relative weakness in small-caps remains a concern for the broader market. Smaller companies are less diversified and have less exposure abroad, which makes them more vulnerable to changes in the domestic economy. As such, small companies are like the canaries in the economic coal mine. They are the first to...
READ MORE
MEMBERS ONLY
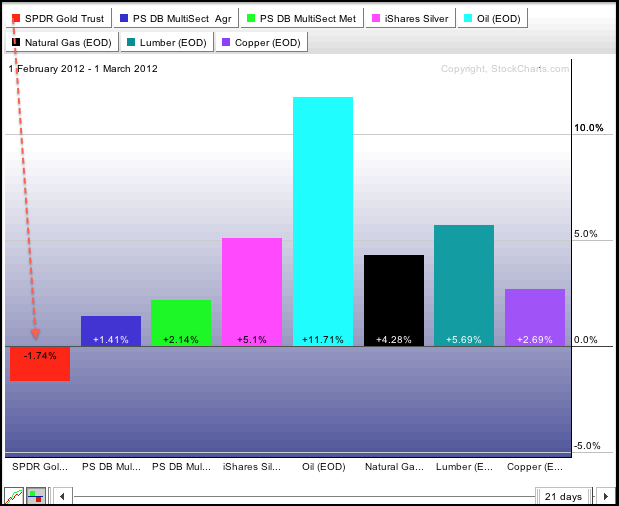
February was a Good Month for Commodities (ex-Gold)
by Arthur Hill,
Chief Technical Strategist, TrendInvestorPro.com
The PerfChart below shows the performance for eight commodity related securities during February. Seven of eight are up with oil leading the charge. Even natural gas was higher. After a big hit on Wednesday, gold is the laggard and the Gold SPDR (GLD) shows a modest loss.
Click this image...
READ MORE
MEMBERS ONLY
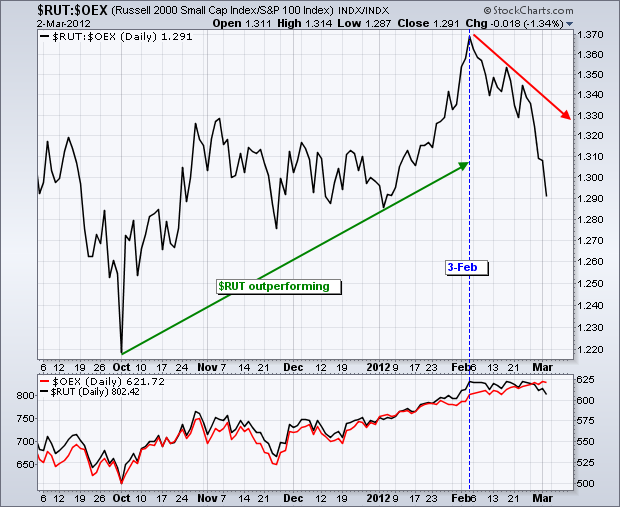
Small Caps Lag, but Most Evidence Remains Bullish
by Arthur Hill,
Chief Technical Strategist, TrendInvestorPro.com
The bulk of the evidence remains bullish, but there was one downgrade on the indicator summary. Small-caps have seriously underperformed large-caps in February and the Price Relative ($RUT:$OEX) ratio moved sharply lower. Even though I am not quite ready to turn bearish on this indicator, it did merit a...
READ MORE
MEMBERS ONLY
IWM Tests Support as UUP Holds Mini Breakout
by Arthur Hill,
Chief Technical Strategist, TrendInvestorPro.com
The S&P 500 ETF (SPY) remains in an uptrend as buying pressure continues to outpace selling pressure. This is clear by the succession of higher highs and higher lows since December 19th. Even though this uptrend is overextended and ripe for a correction, there are simply no signs...
READ MORE
MEMBERS ONLY
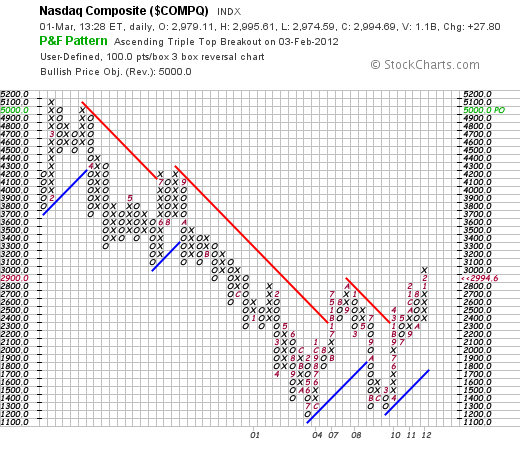
Nasdaq Forms Huge Double Bottom on P&F Chart
by Arthur Hill,
Chief Technical Strategist, TrendInvestorPro.com
The Point & Figure chart below shows the Nasdaq forming two lows in the 1200 area and then breaking above its intermittent high this year. It looks like a massive Double Bottom with an upside price target around 5000. Each box equals 100 points to insure a long-term chart going...
READ MORE
MEMBERS ONLY
IWM Tests Support as GLD Breaks Down
by Arthur Hill,
Chief Technical Strategist, TrendInvestorPro.com
Stocks surged on the open with SPY and QQQ hitting new highs for the move, but promptly fell back and the major index ETFs closed with modest losses. Even though the opening gap-surge failed to hold, selling pressure was not that strong and the major index ETFs remain well above...
READ MORE
MEMBERS ONLY
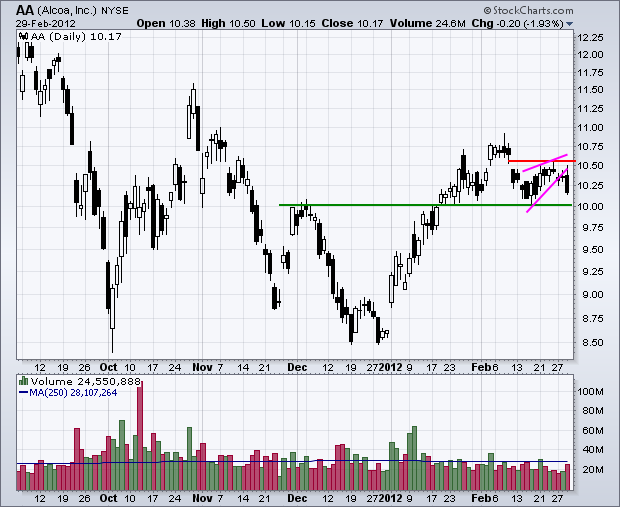
Charts of Interest: AA, AKS, BAC, C, DOW, NOC
by Arthur Hill,
Chief Technical Strategist, TrendInvestorPro.com
AA Breaks Wedge Trendline.
AKS Shows Serious Relative Weakness.
BAC Forms Pennant after Sharp Advance.
PLus C, DOW, NOC
This commentary and charts-of-interest are designed to stimulate thinking. This analysis is not a recommendation to buy, sell, hold or sell short any security (stock ETF or otherwise). We all need...
READ MORE
MEMBERS ONLY
Transports Underperforming on Up-Down Days in February
by Arthur Hill,
Chief Technical Strategist, TrendInvestorPro.com
The major index market carpet shows the Dow Transports underperforming with its components showing more down days than up days in February. Since 31-Jan, the Trannies show -2 for net up days-down days for all components. This indicator counts the number of days each stock moves higher and then subtracts...
READ MORE
MEMBERS ONLY
SPY and QQQ Reach New Highs, but IWM Remains Range Bound
by Arthur Hill,
Chief Technical Strategist, TrendInvestorPro.com
With another strong close and leadership from large-cap tech stocks, SPY and QQQ extended their uptrends and there is no change in the overall picture. Stocks remain overbought and ripe for a corrective period, which could form as a pullback or a flat consolidation. As noted last week, many pundits...
READ MORE
MEMBERS ONLY
Treasuries and Commodities Moving Higher
by Arthur Hill,
Chief Technical Strategist, TrendInvestorPro.com
The CRB Index ($CRB) and the 10-year Treasury Note ($UST) usually move in opposite directions. However, as the John Murphy's Intermarket PerfChart shows, this has not been the case the last six days. Even though the CRB Index is up over 2% since 17-Feb, the 10-year Treasury Note...
READ MORE
MEMBERS ONLY
Oil Corrects, Treasuries Extend Surge and Stocks Hold Uptrends
by Arthur Hill,
Chief Technical Strategist, TrendInvestorPro.com
The warning signs persist, but stocks remain in clear uptrends and selling pressure remains muted. First, recent strength in treasuries is a concern because they are negatively correlated with stocks. Second, the major index ETFs are overextended and ripe for a pullback or consolidation. Third, small-caps have been underperforming since...
READ MORE
MEMBERS ONLY
Charts of Interest: ADP, KR, LLY, STT, TSN
by Arthur Hill,
Chief Technical Strategist, TrendInvestorPro.com
KR Confirms Harami with High Volume Surge.
STT Challenges Triangle Trendline.
TSN Firms at the 50% Retracement Line.
Plus ADP and LLY.
This commentary and charts-of-interest are designed to stimulate thinking. This analysis is not a recommendation to buy, sell, hold or sell short any security (stock ETF or otherwise)...
READ MORE