MEMBERS ONLY
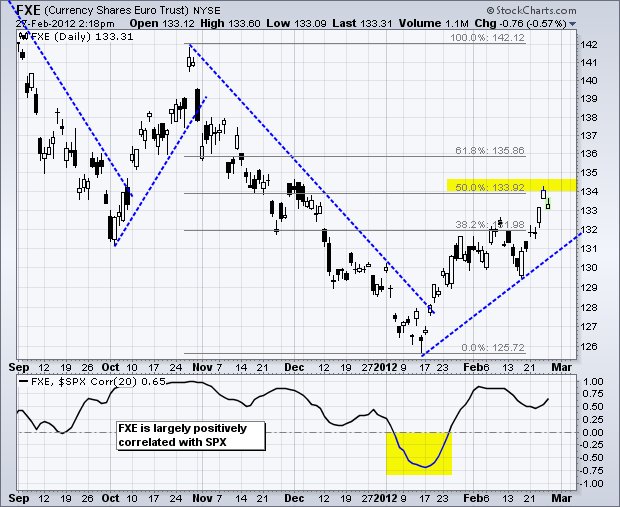
Euro ETF Retraces 50% of its Prior Decline
by Arthur Hill,
Chief Technical Strategist, TrendInvestorPro.com
The rally in the Euro Currency Trust (FXE) has been rather sharp, but the ETF has still only recovered half the prior loss. Notice how FXE declined from 142 to 126 (16 points) and then advanced to 134 (8 points). Like the October surge, this advance could be just a...
READ MORE
MEMBERS ONLY
Treasuries Bounce Along with Oil and Stocks
by Arthur Hill,
Chief Technical Strategist, TrendInvestorPro.com
It was a rather strange week on the intermarket front. Stocks and oil moved higher, which is normal. However, treasuries also moved higher, which is not normal. Strength in stocks and oil should be offset by weakness in treasuries. Strength in treasuries could signal that some traders are taking a...
READ MORE
MEMBERS ONLY
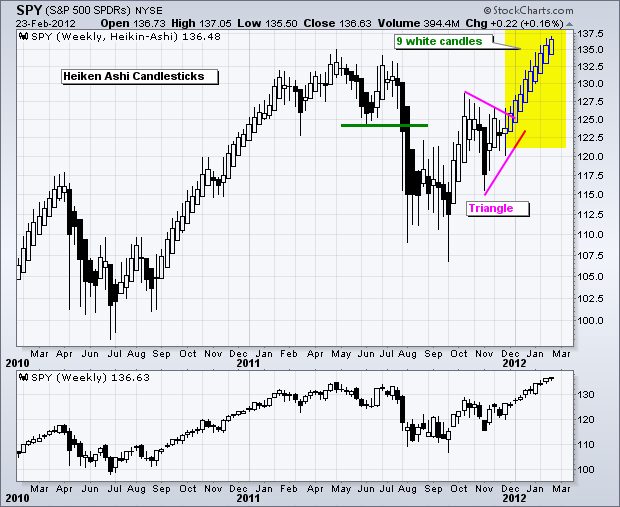
Heikin-Ashi Candlesticks Remain Strong for SPY
by Arthur Hill,
Chief Technical Strategist, TrendInvestorPro.com
The chart below shows weekly Heikin-Ashi Candlesticks, which combine price action from two weeks to form a composite candlestick. As of this week, SPY formed nine white (hollow) Heikin-Ashi Candlesticks in a row and shows no weakness. The first long black candlestick would suggest that a corrective period is starting....
READ MORE
MEMBERS ONLY
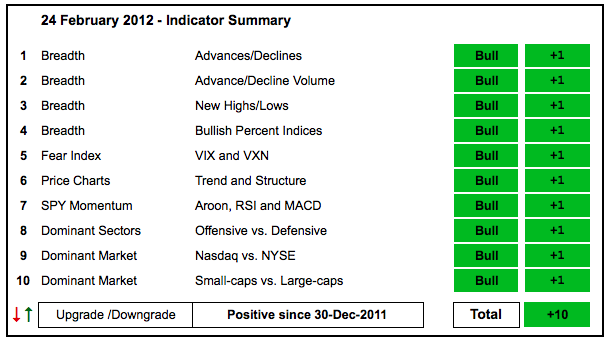
NYSE AD Line Hits New High and Sector BPIs Remain Strong
by Arthur Hill,
Chief Technical Strategist, TrendInvestorPro.com
Unsurprisingly, there is no change in the indicator summary as stocks held their gains this week. Trading turned a little more indecisive, but we have yet to see any signs of significant selling pressure. The NYSE AD Line hit another new 52-week high this week, the AD Volume Lines remain...
READ MORE
MEMBERS ONLY
Stocks Maintian Uptrends Even as Treasuries Bounce
by Arthur Hill,
Chief Technical Strategist, TrendInvestorPro.com
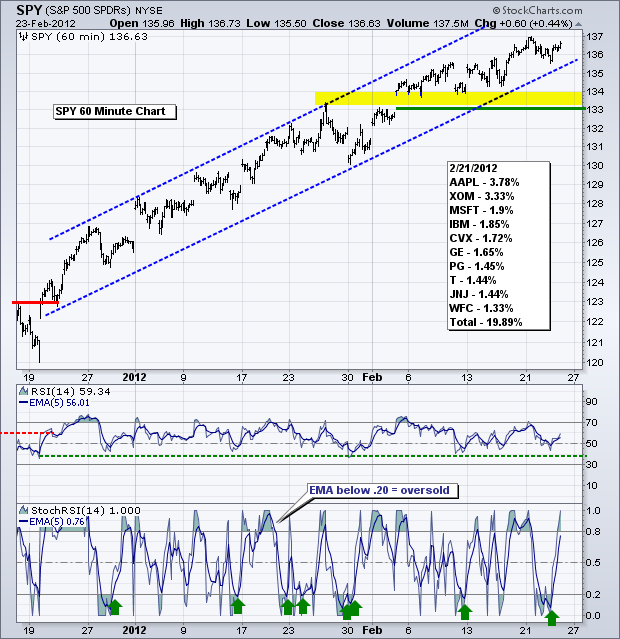
There are no major changes on the charts. However, yesterday was a bit strange because both treasuries and stocks moved higher. The 7-10 year T-Bond ETF (IEF) was up .14% and the S&P 500 ETF (SPY) was up .44%. Despite a day astray, stocks remains in clear uptrends...
READ MORE
MEMBERS ONLY
Bollinger Bands Narrow for Boeing
by Arthur Hill,
Chief Technical Strategist, TrendInvestorPro.com
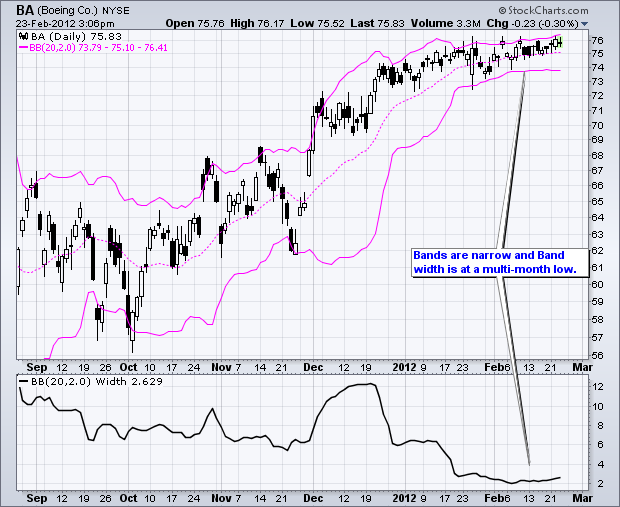
Boeing (BA) moved into a tight range the last 5-6 weeks and the Bollinger Bands contracted to their narrowest in over six months. This signals a volatility contraction, which in turn could foreshadow a volatility expansion. Watch resistance from the February highs and support from the February low for the...
READ MORE
MEMBERS ONLY
Stocks Stall, but Refuse to Buckle - Gold Holds Breakout
by Arthur Hill,
Chief Technical Strategist, TrendInvestorPro.com
Stocks edged lower on Wednesday as commodities moved higher. There is generally a positive correlation between stocks and commodities, including gold. The Dollar and commodities are generally negatively correlated, as are stocks and treasures. Even though intermarket relationships are important, my first focus is on the individual price charts because...
READ MORE
MEMBERS ONLY
Charts of Interest: ABX, BA, GFI, GOOG, ORCL
by Arthur Hill,
Chief Technical Strategist, TrendInvestorPro.com
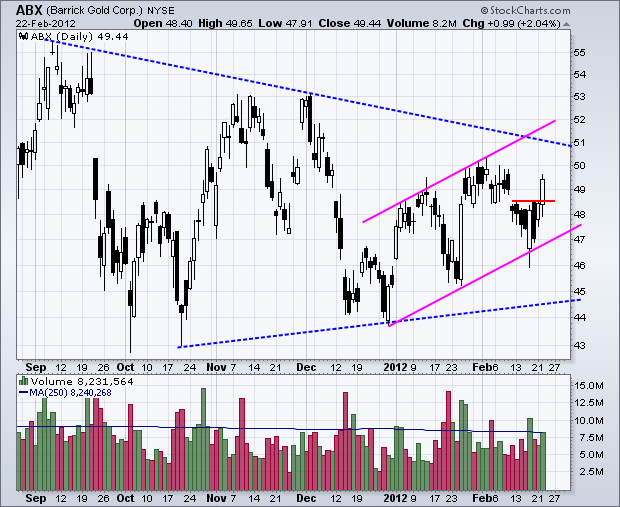
Bollinger Bands Narrow for BA as Ascending Triangle Forms.
GFI Firms at Key Retracement.
GOOG Forms Harami at Resistance.
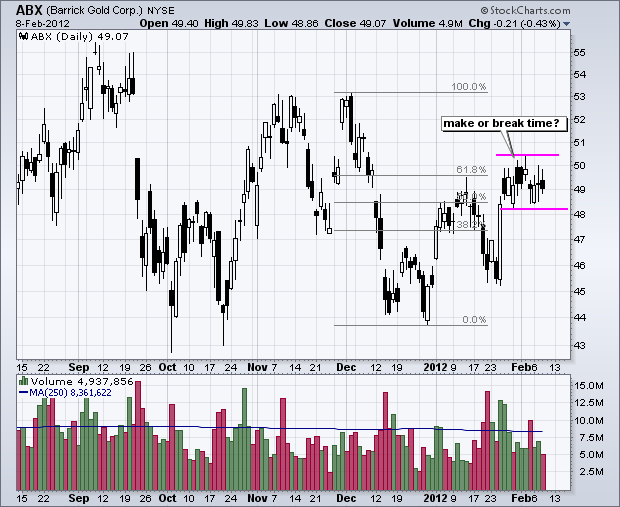
Plus ABX and ORCL.
This commentary and charts-of-interest are designed to stimulate thinking. This analysis is not a recommendation to buy, sell, hold or sell short any security (stock ETF or...
READ MORE
MEMBERS ONLY
Currency PerfChart Reflects Risk-on Environment
by Arthur Hill,
Chief Technical Strategist, TrendInvestorPro.com
The PerfChart below shows the performance for ten currencies since January (year-to-date). The traditional safe-haven currencies are down (Dollar and Yen), while two emerging market currencies are up (Real and Peso). The Euro is also up, which reflects the current risk-on environment for the stock market.
Click this image for...
READ MORE
MEMBERS ONLY
IWM Underperforms, GLD Breaks Out and UUP Hits Retracement
by Arthur Hill,
Chief Technical Strategist, TrendInvestorPro.com
Even though the major index ETFs remain in uptrends, signs of weakness are emerging under the hood and stocks are ripe for a corrective period. First, small-caps continue to show relative weakness since 3-Feb, which is when IWM peaked. Second, sentiment remains overtly bullish as the 10-day SMA of the...
READ MORE
MEMBERS ONLY
Retail SPDR Traces Out Bearish Engulfing
by Arthur Hill,
Chief Technical Strategist, TrendInvestorPro.com
The Retail SPDR (XRT) hit a new high with a gap last week, but failed to hold this gap as a bearish engulfing pattern formed on Tuesday. Volume also perked up to its highest level in four days. After a rally from 52 to 59, the ETF could correct back...
READ MORE
MEMBERS ONLY
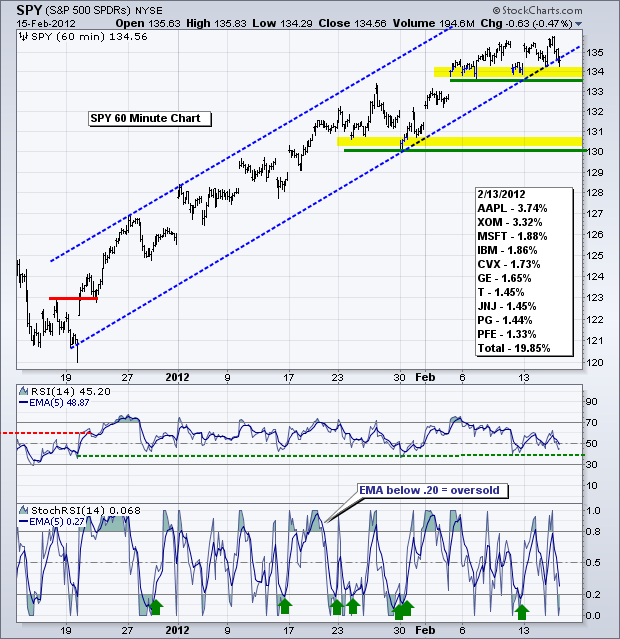
SPY Uptrend Enters 10th Week
by Arthur Hill,
Chief Technical Strategist, TrendInvestorPro.com
Stocks have been overbought for weeks, but the uptrend just keeps extending. SPY is a classic example of an index ETF becoming overbought and remaining overbought. The ETF broke resistance on 19-Dec to start the current uptrend, which is some nine weeks old. SPY was up over 7% in mid...
READ MORE
MEMBERS ONLY
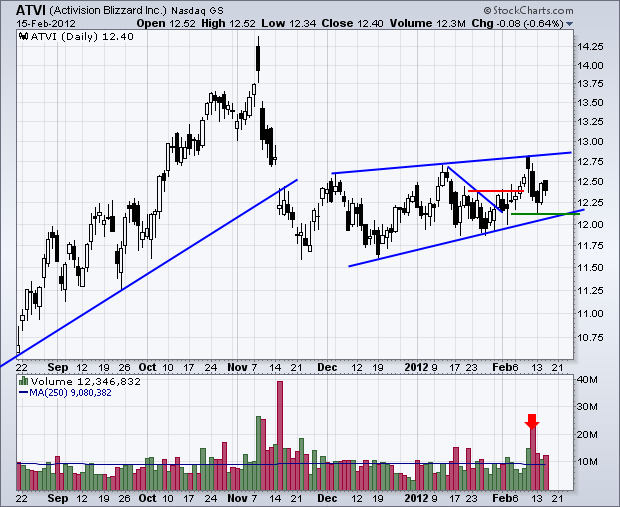
Charts of Interest: ALK, ATVI, BSX, CTSH, IPI, LLY, OMX
by Arthur Hill,
Chief Technical Strategist, TrendInvestorPro.com
ATVI Edges Higher within Rising Wedge.
IPI Consolidates after Breakout.
LLY Gaps above Falling Wedge Trendline.
Plus ALK, BSX, CTSH, IPI, OMX
This commentary and charts-of-interest are designed to stimulate thinking. This analysis is not a recommendation to buy, sell, hold or sell short any security (stock ETF or otherwise)...
READ MORE
MEMBERS ONLY
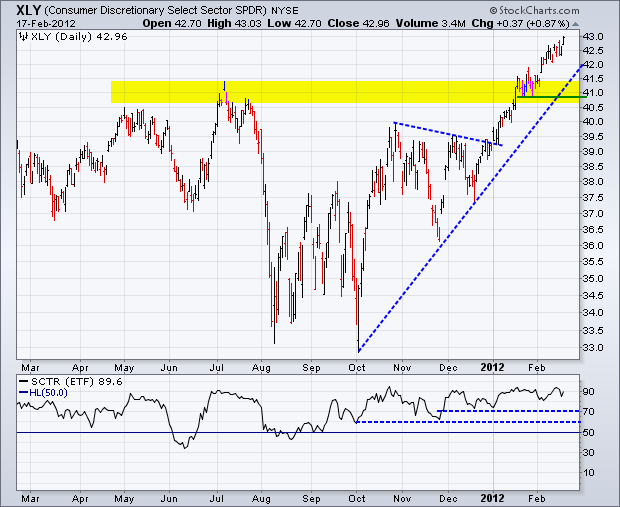
Consumer Discretionary and Technology Lead Sectors in StockCharts Technical Rank
by Arthur Hill,
Chief Technical Strategist, TrendInvestorPro.com
Of the nine sector SPDRs, the Consumer Discretionary SPDR (XLY) and the Technology SPDR (XLK) have the highest StockCharts Technical Rank (SCTR). The SCTR for the Industrials SPDR (XLI) is in a close third. High SCTR scores indicate that these sectors show excellent relative strength and market leadership.
Click this...
READ MORE
MEMBERS ONLY
Gold Miners ETF Forms Big Bad Bullish Engulfing
by Arthur Hill,
Chief Technical Strategist, TrendInvestorPro.com
The Gold Miners ETF (GDX) opened weak with a print below 53, but then recovered with a high volume rally and close near 55. Overall, Thursday's long white candlestick engulfed the prior four candlesticks. At the very least, this establishes support with Thursday's low. Follow through...
READ MORE
MEMBERS ONLY
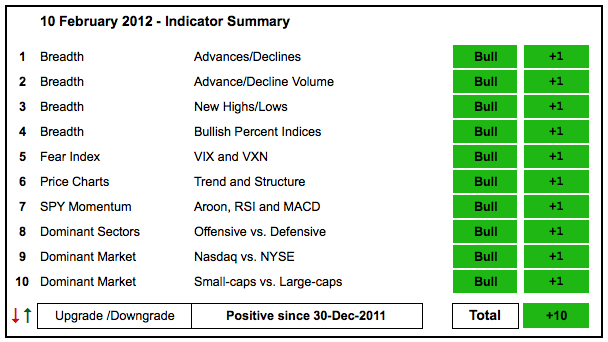
NYSE AD Line Powers Indicator Summary with Another New High
by Arthur Hill,
Chief Technical Strategist, TrendInvestorPro.com
There is no change in the indicator summary as stocks maintain their gains and show no signs of significant selling pressure. While this rally is certainly getting overextended, it takes actual selling pressure to produce a pullback. None of the indicator groups shows weakness just yet. The Nasdaq AD Volume...
READ MORE
MEMBERS ONLY
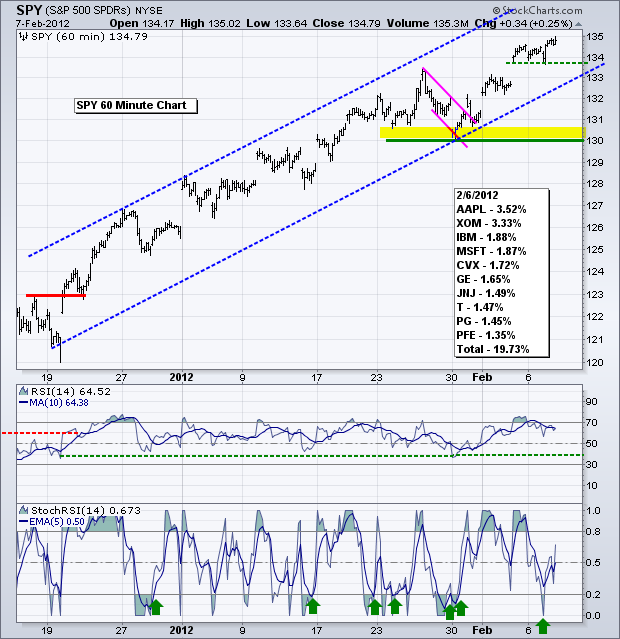
SPY Holds the Gap and Small Caps Spring to Life
by Arthur Hill,
Chief Technical Strategist, TrendInvestorPro.com
Stocks may seem overbought, sentiment may seem too bullish and the odds of a correction may seem high, but a pullback cannot materialize until there is a noticeable and sustainable increase in selling pressure. This means we need to see more than a day of selling pressure AND some sort...
READ MORE
MEMBERS ONLY
Apple Goes Parabolic and Forms Bearish Engulfing
by Arthur Hill,
Chief Technical Strategist, TrendInvestorPro.com
Apple is no doubt in a strong uptrend, but the recent move went parabolic as the trendline slope steepened for the third time. The latest surge from 420 to 520 was pretty much straight up. With a high-volume bearish engulfing pattern taking shape on Wednesday, the stock could be ripe...
READ MORE
MEMBERS ONLY
Stocks Reverse Early Gains as Small Caps Underperform
by Arthur Hill,
Chief Technical Strategist, TrendInvestorPro.com
The Dollar broke resistance, the Euro moved lower and stocks gave up early gains with a rather sharp afternoon sell-off. Conditions remain ripe for a corrective period and stocks are showing signs of fatigue. In particular, Apple-less small-caps have been relatively weak since IWM peaked on February 3rd and sentiment...
READ MORE
MEMBERS ONLY
Charts of Interest: ATVI, BBY, MMM, PNRA, TGT, VZ
by Arthur Hill,
Chief Technical Strategist, TrendInvestorPro.com
BBY Hits Resistance at Key Retracement.
MMM Stalls as Bollinger Bands Contract.
VZ Forms Triangle within Downtrend.
Plus ATVI, PNRA, TGT
This commentary and charts-of-interest are designed to stimulate thinking. This analysis is not a recommendation to buy, sell, hold or sell short any security (stock ETF or otherwise). We...
READ MORE
MEMBERS ONLY
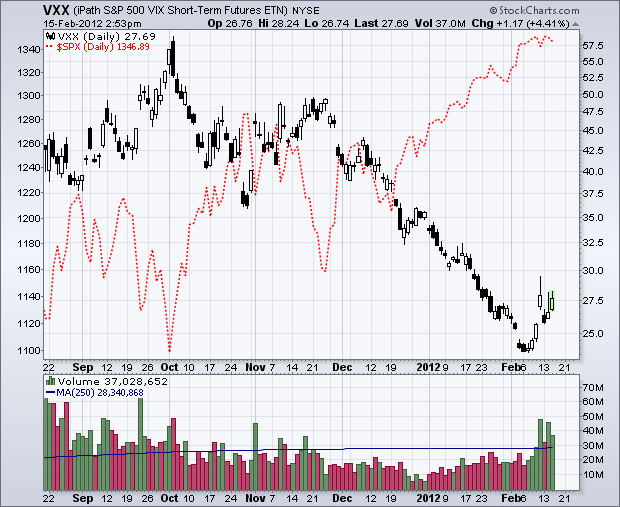
Volatility Surges as Vix ETN Moves Higher
by Arthur Hill,
Chief Technical Strategist, TrendInvestorPro.com
After a sharp move lower from late November to early February, the S&P 500 VIX ETN (VXX) bounced the last seven days with its biggest move since November. Volume also surged. It appears that traders are taking out a little insurance with the stock market so overbought.
Click...
READ MORE
MEMBERS ONLY
Gold Tests Key Support as Dollar Breaks Resistance
by Arthur Hill,
Chief Technical Strategist, TrendInvestorPro.com
Stocks edged lower most of the day and then surged in the final 30 minutes. Even the smallest of dips brought out the bulls. I would hazard a guess that a fair amount of money missed this rally and some of it is on the sidelines waiting for a pullback....
READ MORE
MEMBERS ONLY
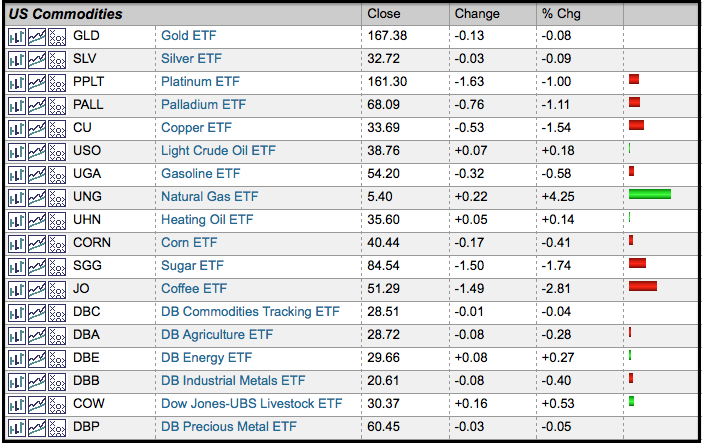
Coffee and Sugar ETFs Take a Hit
by Arthur Hill,
Chief Technical Strategist, TrendInvestorPro.com
The ETF Market Summary shows commodity ETFs under pressure during the day Tuesday. The Coffee (JO) and Sugar (SGG) ETFs were leading the way down. The Copper ETF (CU) and Palladium (PALL) ETFs, which represent industrial metals, were also weak.
Click this chart for a live image...
READ MORE
MEMBERS ONLY
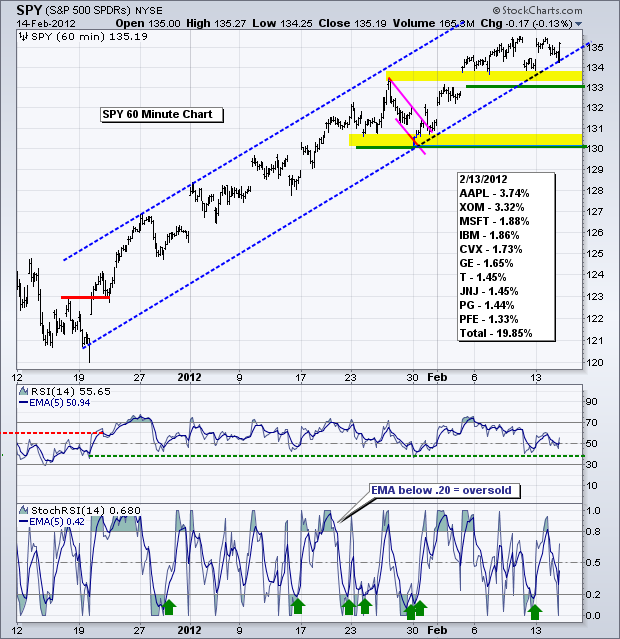
Dollar and Treasuries Firm as Stocks Remain Overbought
by Arthur Hill,
Chief Technical Strategist, TrendInvestorPro.com
Is it turnaround Tuesday? Stocks are in uptrends, but way overbought and ripe for a corrective period. Small-caps (IWM) are lagging large-caps (SPY) the last 6-7 days and this is a sign of market fatigue. The Dollar is way oversold and ripe for a bounce, which could facilitate a stock...
READ MORE
MEMBERS ONLY
Charts: AMZN, FRX, MCK, NIHD, PLCE, SFD, SNDK, WAG
by Arthur Hill,
Chief Technical Strategist, TrendInvestorPro.com
AMZN Fills the Gap.
NIHD Forms Tight Consolidation after Breakout.
SFD Shows Relative Weakness with Falling SCTR.
Plus FRX,MCK,PLCE,SNDK,WAG
This commentary and charts-of-interest are designed to stimulate thinking. This analysis is not a recommendation to buy, sell, hold or sell short any security (stock ETF or...
READ MORE
MEMBERS ONLY
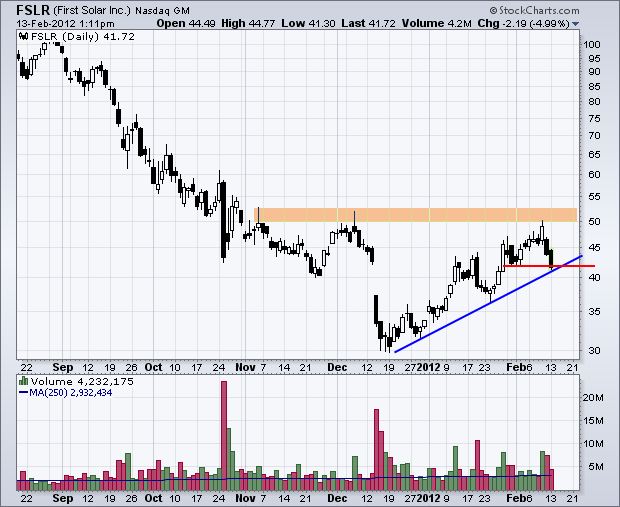
First Solar Fails at Resistance $FSLR
by Arthur Hill,
Chief Technical Strategist, TrendInvestorPro.com
While the market moves higher on Monday, First Solar (FSLR) is moving lower with its second long black candlestick. Also notice that the stock failed at resistance near 50 for the second time in three months.
Click this chart for a live image...
READ MORE
MEMBERS ONLY
Stocks Extend Uptrends as Oil Challanges Resistance
by Arthur Hill,
Chief Technical Strategist, TrendInvestorPro.com
Asian and European markets are in a risk-on mood after the Greek parliament passed the austerity package. This mood is extending to US stock futures, which are up modestly in pre-market trading. Gold, oil and the Euro are high, while the Dollar and treasuries are lower. For stocks, the uptrends...
READ MORE
MEMBERS ONLY
Weekly MACD Keeps Traders on the Right Side of the Bigger Trend
by Arthur Hill,
Chief Technical Strategist, TrendInvestorPro.com
The chart below shows the S&P 500 ETF with weekly candles and weekly MACD (12,26,9). Even though some signals may seem late, this classic indicator combines trend following and momentum to keep players on the right side of trend. Moves above the signal line favor the...
READ MORE
MEMBERS ONLY
Indicator Summary Remain Strong, But Stocks are Overbought
by Arthur Hill,
Chief Technical Strategist, TrendInvestorPro.com
With further strength this week, it is little surprise that the indicator summary remains unchanged at +10. Even though there are no signs of weakness, there are plenty of overbought signs. Eight of the nine sector Bullish Percent Indices are above 80%. The current advance in the major index ETFs...
READ MORE
MEMBERS ONLY
Stocks Remain Overbought as Treasuries/Dollar Look Oversold
by Arthur Hill,
Chief Technical Strategist, TrendInvestorPro.com
While the medium-term and long-term outlooks remain bullish, stocks are in a rather precarious short-term situation. The major index ETFs are overbought, sentiment is excessively bullish and Greek lawmakers have yet to pass the austerity measures required to receive EU aid. Greek legislators and the EU are likely playing a...
READ MORE
MEMBERS ONLY
The Risk (Heat) is On as Commodities Lead
by Arthur Hill,
Chief Technical Strategist, TrendInvestorPro.com
The PerfChart below shows a selection of intermarket related ETFs. Notice that the Commodity Index Fund (DBC), Base Metals ETF (DBB) and Gold SPDR (GLD) are up substantially year-to-date, as are stocks. In contrast, the Dollar and Treasury ETFs are down. Money is embracing risk this year.
Click here for...
READ MORE
MEMBERS ONLY
Stocks Extend Uptrend as Oil Challenges Resistance
by Arthur Hill,
Chief Technical Strategist, TrendInvestorPro.com
The bulls are piling on. While we can never be sure when exactly it happened, note that Nouriel Roubini, aka Dr. Doom, recently turned bullish. In fact, his director of equity and allocation strategy, Gina Sanchez, suggested that the current rally could extend for months. However, Roubini is looking for...
READ MORE
MEMBERS ONLY
Charts of Interest: ABX, CPN, GFI, GG, WLL, YHOO
by Arthur Hill,
Chief Technical Strategist, TrendInvestorPro.com
CPN Surges above Resistance with Big Volume.
GFI Forms Pennant Consolidation.
WLL Breaks Ascending Triangle Resistance.
Plus ABX, GG, YHOO
This commentary and charts-of-interest are designed to stimulate thinking. This analysis is not a recommendation to buy, sell, hold or sell short any security (stock ETF or otherwise). We all...
READ MORE
MEMBERS ONLY
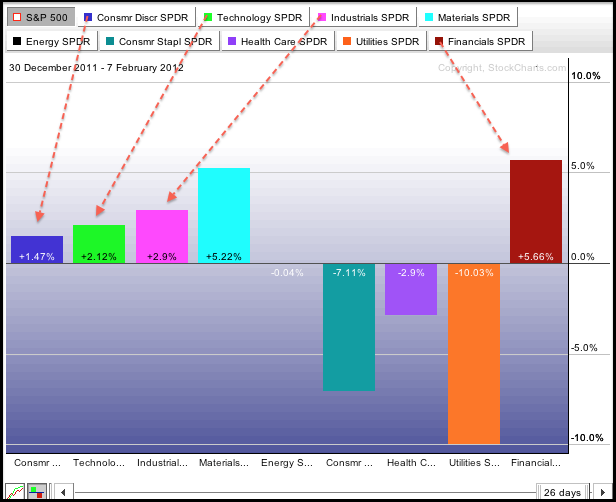
Offensive Sectors Take the Lead on the S&P Sector PerfChart
by Arthur Hill,
Chief Technical Strategist, TrendInvestorPro.com
The stock market is clearly in rally mode this year with the offensive sectors leading the charge. Notice that the consumer discretionary, industrials, finance and technology sectors are outperforming the S&P 500. In contrast, the consumer staples, healthcare and utilities sectors, which are defensive, are lagging the S&...
READ MORE
MEMBERS ONLY
USO Surges above Support Break as UUP Breaks Flag Support
by Arthur Hill,
Chief Technical Strategist, TrendInvestorPro.com
After a narrow day for Average True Range (ATR) indicator on Monday, stocks started the day weak on Tuesday, but quickly recovered and moved into positive territory. Even though stocks are overbought and ripe for a correction, selling pressure remains minimal and the bulls still reign supreme. SPY held support...
READ MORE
MEMBERS ONLY
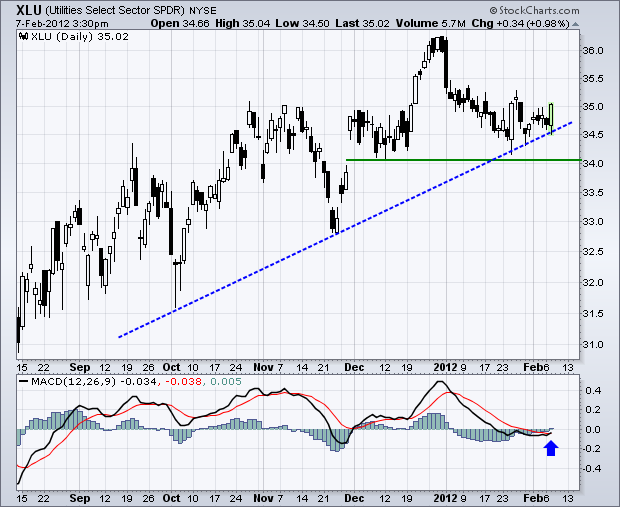
Utilities SPDR Perks Up with Bounce off Support XLU
by Arthur Hill,
Chief Technical Strategist, TrendInvestorPro.com
The Utilities SPDR (XLU) was relatively weak in January as it failed to partake in the broad market advance. More recently, the ETF surged in late January and again on Tuesday with moves that reinforce support in the 34-34.5 area. MACD flattened over the last two weeks and a...
READ MORE
MEMBERS ONLY
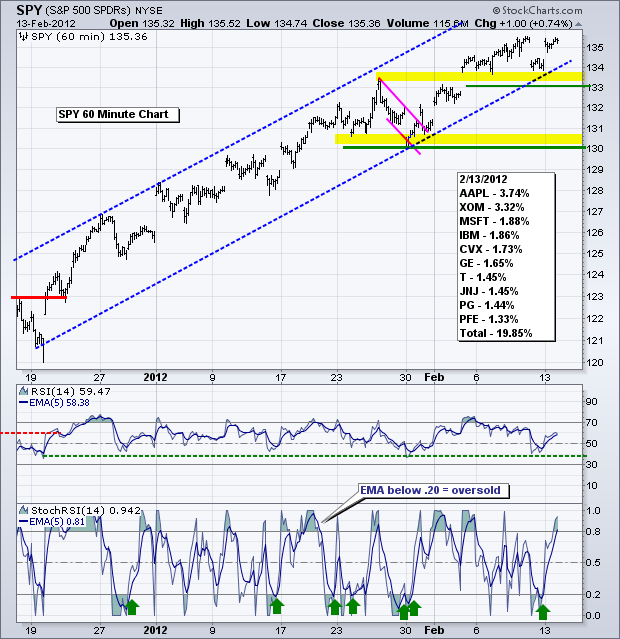
SPY Forms Narrow ATR Day as Dollar Consolidates
by Arthur Hill,
Chief Technical Strategist, TrendInvestorPro.com
Today could be volatile. First, stocks are overbought after a seven week advance. Second, Bernanke testifies before Congress today. Third, Greek debt negotiations continue and Greek unions put out the call for a general strike on Tuesday. Fourth, the Euro is short-term overbought and consolidating, while the Dollar is short-term...
READ MORE
MEMBERS ONLY
Charts of Interest: AEO, ADP, DVN, PLCE, WCRX
by Arthur Hill,
Chief Technical Strategist, TrendInvestorPro.com
$AEO Retraces 61.80% with Rising Wedge.
$DVN Forms Large Triangle Consolidation.
Plus $ADP, $PLCE, $WCRX
This commentary and charts-of-interest are designed to stimulate thinking. This analysis is not a recommendation to buy, sell, hold or sell short any security (stock ETF or otherwise). We all need to think for...
READ MORE
MEMBERS ONLY
German DAX Index Leads the Way in 2012 $DAX $SPX $NIKK
by Arthur Hill,
Chief Technical Strategist, TrendInvestorPro.com
Despite all the "issues" surrounding Europe, the German DAX Index ($DAX) is going strong and outperforming the S&P 500. In fact, the DAX is outperforming the Shanghai Composite ($SSEC) and the Nikkei 225 ($NIKK) as well. The chart below shows that the DAX is up a...
READ MORE
MEMBERS ONLY
Bears Capitulate as Stocks Surge - Dollar Firms within Downtrend
by Arthur Hill,
Chief Technical Strategist, TrendInvestorPro.com
Stocks extended their short-term uptrends with strong moves on Friday. SPY, QQQ and IWM all hit new highs for the move and the short-term uptrends are now entering their eighth week. These moves started with a gap and breakout on December 19th. Overall, stocks are still quite overbought and ripe...
READ MORE